ABSTRACT
HALL, BRIAN S
.
,
GA-Based Optimization of Steel Moment Frames: A Case Study (Under the direction of Dr. Abhinav Gupta).Moment resisting frames are utilized in steel construction in order to provide overall stability and to withstand lateral forces related to wind and earthquake loadings. While the industry focuses on producing more economical moment frames by optimizing for the weight of steel, it should be noted that because of present trends the labor cost associated with rigid moment connection fabrication governs the total cost of these frames.
Therefore, the objective of this case study is to discover alternative ways of producing more cost-effective moment frames without compromising overall stability. This is achieved by considering both the cost of steel and the cost of connections within the design process.
In order to reduce cost, rigid connections within the frame are replaced with standard pinned connections, and member sizes are increased where needed, a method unlike the current least-weight design approach. Optimization techniques are developed in order to identify the most advantageous locations of the remaining moment connections. A Genetic Algorithm, interfaced with a Java-based frame analysis program, is utilized to produce these optimal solutions.
technique that considers both the number of moment connections and the total weight of the frame, the least weight optimal solution can be improved upon drastically, with an almost 50% reduction in the total cost and an approximately 60% increase in total weight. The unorthodox connection arrangements produced are important, as they provide
GA-Based Optimization of Steel Moment Frames:
A Case Study
by Brian S. Hall
A thesis submitted to the Graduate Faculty of North Carolina State University
in partial fulfillment of the requirements for the Degree of
Master of Science CIVIL ENGINEERING
Raleigh, NC 2005
APPROVED BY:
_________________________________ Abhinav Gupta
Chair of Advisory Committee
_________________________________ Emmett Sumner
BIOGRAPHY
Brian S. Hall was born on May 1, 1981 in Wilmington, NC, as the son of Tony LeRoy Hall and Sandra Dee Hall. He grew up in nearby Shallotte, NC, and received a diploma from West Brunswick High School in the summer of 1999. He attended North Carolina State University (NCSU) until May, 2003, graduating Summa Cum Laude with a Bachelor’s of Science degree in Civil Engineering. Later that same year he enrolled in the graduate program at NCSU to begin work on a Masters of Science degree in Structural Engineering.
ACKNOWLEDGEMENTS
First and foremost, I would like to thank my mom, dad, and sister Becky, for their constant encouragement, support and love throughout the years.
I would like to extend a special thanks to my advisor, Dr. Abhinav Gupta, for his patience and guidance during the course of this research. I would also like to thank Dr. Emmett Sumner and Dr. John Baugh for their assistance and their willingness to serve as members of my advisory committee.
Thanks go out to friends and family members, both in Raleigh and at home, for the help and support they provided during my time at NC State.
TABLE OF CONTENTS
LIST OF FIGURES ... vi
LIST OF TABLES... viii
CHAPTER 1: INTRODUCTION ... 1
1.1 Background and Motivation ... 1
1.2 Objective ... 3
CHAPTER 2: DESCRIPTION & DESIGN OF A TEST-BED BUILDING FRAME .... 7
2.1 Building Information ... 7
2.2 Loads & Load Combinations... 9
2.3 Strength & Displacement Calculations... 13
CHAPTER 3: MOMENT CONNECTION DESIGN... 16
3.1 Introduction... 16
3.2 Types of Moment Connections... 17
3.2.1 Welded Flange Connections... 17
3.2.2 Welded Flange Plate Connections... 18
3.2.3 Bolted Flange Plate Connections... 19
3.2.3 Flange Tee-Stub Bolted Connections... 20
3.3 Design of Welded Flange Plate Connections... 21
3.3.1 Design of Top and Bottom Beam Flange Connections... 21
3.3.2 Design of Beam Web Connection... 26
3.3.3 Design of Column Stiffeners... 28
3.3.4 Design of Panel Zone Doubler Plates... 30
CHAPTER 4: OPTIMIZATION OF MOMENT CONNECTIONS ... 34
4.1 Introduction... 34
4.2 GA-Based Discrete Optimization ... 35
4.2.1 GA-Operators: Populating the GA and Selection... 36
4.2.2 GA-Operators: Crossover... 37
4.2.3 GA-Operator: Mutation... 38
4.3 Optimization for Moment Connections ... 38
4.4 Validation of the Frame Analysis Program ... 46
CHAPTER 5: RESULTS... 48
5.1 Hand Optimized Moment Frame ... 48
5.2 SAP 2000 Optimized Moment Frame... 50
CHAPTER 6: CONCLUSION ... 61
6.1 Summary... 61
6.2 Conclusions... 61
REFERENCES ... 64
APPENDIX A : ALTERNATIVE OPTIMAL SOLUTIONS ... 67
APPENDIX B : REFERENCE TABLES & FIGURES ... 81
LIST OF FIGURES
Figure 1: Building Dimensions (Profile View)... 8
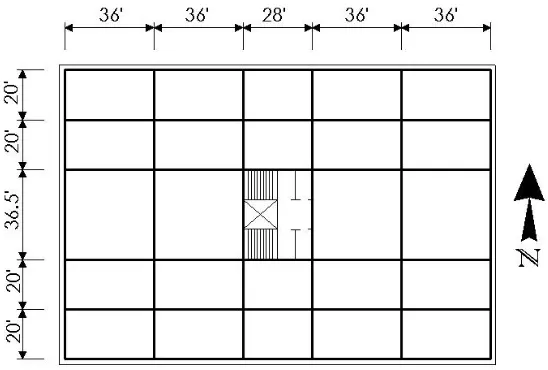
Figure 2: Building Dimensions (Plan View)... 8
Figure 3: Wind Load Distribution... 13
Figure 4: Welded Flange Connection... 17
Figure 5: Welded Flange Plate Connection... 18
Figure 6: Bolted Flange Plate Connection... 19
Figure 7: Flange Tee-Stub Bolted Connection... 20
Figure 8: Transverse Column Stiffener Dimensions... 30
Figure 9: Transverse Column Stiffener... 30
Figure 10: Column Panel Zone... 33
Figure 11: One-Point Crossover in GA... 37
Figure 12: Mutation within the GA... 38
Figure 13: Unique Crossover Scheme... 40
Figure 14: Algorithm for Correcting Solutions that Violate Design Equations... 43
Figure 15: Algorithm for Correcting Solutions that Violate Sway Constraints... 44
Figure 16: GA Flowchart... 45
Figure 17: Two Member Frame Example... 46
Figure 18: 24-Connection "Inverted Arch" Solution... 49
Figure 19: 24-Connection "Arch" Solution... 50
Figure 20: 26-Connection "Bow-Tie" Solution... 50
Figure 21: 10-Connection Solution... 53
Figure 22: 12-Connection Solution... 53
Figure 24: Graph of Connections vs. Total Frame Cost... 54
Figure 25: Graph of Total Weight vs. Total Frame Cost... 55
Figure 26: Member Number Designations for Five-Story Frame... 55
Figure 27: Member Sizes for Various Solutions... 56
Figure 28: Comparison of Cost Ratios Graph... 58
Figure 29: Graph of Connections vs. Total Frame Cost (Lower Column Correction).... 59
Figure 30: Comparison of Cost Ratios Graph (Lower Column Correction)... 60
Figure 31: Optimal Solution Member Sizes... 60
Figure B 1: North Carolina Basic Wind Speeds... 87
Figure B 2: End & Interior Zones for Wind Force Loading... 88
LIST OF TABLES
Table 1: Frame Analysis Program & SAP2000 Comparison... 47
Table 2: Frame Analysis Program & SAP2000 Comparison for 5-Story Frame... 47
Table 3: Cost Ratio Comparison... 57
Table B 1: Dead Load Values (lbs)... 82
Table B 2: Distributed Live Load Values (psf)... 82
Table B 3: Height & Exposure Adjustment Coeff.... 83
Table B 4: Building Classifications & Importance Factors... 84
Table B 5: Main Wind Force-Resisting System Loads... 85
Table B 6: Nominal Hole Dimensions... 85
Table B 7: Minimum Bolt Edge Distances... 86
CHAPTER 1: INTRODUCTION
1.1 Background and Motivation
Moment resisting rigid or semi-rigid steel frames are often utilized to provide increased stability for resisting lateral forces such as those due to earthquake and wind loadings. These frames are much heavier relative to braced frames within a structure. Consequently, a majority of steel frame optimization research has focused on developing “least-weight” designs. These include recent studies by Torregosa (2002) and Kim (2004) involving genetic algorithms, search algorithms based on the concepts of natural selection and adaptation (Burns, 2002). In all of these studies, the objective has been to minimize the total weight of the steel frame by selecting members from a database that provide the lightest frame possible subjected to a set of specified strength and
serviceability constraints.
satisfy serviceability and strength constraints. A nonlinear empirical model is used to include the nonlinear behavior of the moment-rotation relationship of the beam to column connections.
Another study related to moment frames involves design procedures that utilize Ant Colony Optimization (ACO) techniques (Camp, 2004). As in other cases, the objective function considered for this optimization technique is the total weight of the structure subjected to serviceability and strength requirements specified by the AISC Load and Resistance Factor Design (LRFD). Results obtained from ACO are compared with those previously evaluated using genetic algorithms and classical optimization methods.
In another recent study, Sarma (2005) gives comparison between the use of Allowable Stress Design (ASD) methods and LRFD methods in the optimization of high rise buildings. Results are evaluated for two different structures; a 36-story moment frame and a 144-story super high-rise building. This study concludes that the LRFD based design code does not provide any significant “weight savings” when serviceability is the controlling factor. Once again, the study focuses on evaluating the minimum weight design.
labor cost associated with fabrication of the moment connection, which can be excessively high due to in-situ welding. As the industry focuses on producing more economical designs by designing lighter steel frames, it is important to note that the labor costs associated with the fabrication of rigid and semi-rigid moment connections governs the total cost of these frames, not the least weight design. Over the past decade, the labor costs have continued to increase relative to the cost of steel hardware. Therefore, least weight moment resisting frames are not necessarily the most economical. None of the existing steel design software (SAP2000, RAMSteel) can consider these costs directly. Moreover, the existing optimization techniques would need to be modified to achieve such an objective.
1.2 Objective
The objective of this study is to explore the effect of considering the cost of fabricating a connection to produce more economical moment resisting frames without compromising the overall stability of the frame and without focusing primarily on the reduction of frame weight. This is achieved by altering the number of moment connections within the frame to reduce cost; replacing some of the rigid connections within the frame with standard pinned connections, and increasing member sizes wherever needed. For simplicity, this exploratory study focuses solely on rigid
cost are developed to illustrate the benefit of removing connections while often increasing the frame weight.
As stated previously, each joint or connection is ideally represented as a rigid or fixed connection in moment frame design. To provide this rigidity, several different types of connections can be considered with varying amounts of on-site welding (including the welded flange plate connection discussed in detail in the following chapters). By eliminating some of these connections, a significant reduction can be achieved in the amount of on-site labor involved with connection construction and in the fabrication time leading to an appreciable decrease in the overall cost of these frames. Costs associated with added weight from larger/heavier members is quite minimal because of the increasing discrepancy between the labor costs and the material costs.
In order to determine the total number and configurations of rigid connections within a frame that produces the most economical design, we employ heuristic
optimization methods such as Genetic Algorithm which is interfaced with a Java-based frame analysis program for strength and serviceability evaluation. The frame analysis program is validated by comparisons with the corresponding results from SAP2000. While the framework developed in this study can be applied to any typical moment resisting steel frame, this case study considers a 5-story steel frame office building as a test-bed.
• Select an appropriate building model for the case study.
• Create a hand-designed least-weight moment frame for the selected building model.
• Generate an improved least-weight frame design using optimization in SAP2000.
• Design a Welded-Flange Plate Connection to be used as the standard for cost evaluation.
• Develop a frame analysis program for determining the member-end forces and displacements, and for performing strength and serviceability checks.
• Implement an optimization procedure for evaluating optimal number of rigid connections needed in a frame.
• Develop a strategy for updating members that do not satisfy the strength and serviceability requirements due to connection rearrangement.
• Generate trade-off curves between the total cost and the number of rigid connections.
includes several tables and figures from the design manuals and building codes
referenced in Chapters 2 and 3. A numerical design example for Welded Flange Plate moment connections is presented in Appendix C.
CHAPTER 2: DESCRIPTION & DESIGN OF A TEST-BED BUILDING FRAME
2.1 Building Information
In order to achieve the objectives of this study, a commercial building designed in the structural engineering capstone design course (CE420) at North Carolina State
University is considered as a test-bed. The proposed structure is a 100,200 ft2, 5-story steel building, and is expected to be used for office and/or retail space. The building site is located in the vicinity of Raleigh, NC, placing it in Exposure Category B, defined by the 2002 edition of the North Carolina State Building Code as an urban or suburban area with numerous closely spaced obstructions having the size of single family dwellings or larger. The structure measures 172 ft. in length (in the east-west direction), 116.5 ft. in width (in the north-south direction), and stands a total of 57.5 ft. in height. All floor heights are set at 8 ft. (floor to ceiling) or 11.5 ft (floor to floor). This allows 3.5 ft. for the concrete slab, the decking, the supporting beams and girders, the HVAC space and the suspended acoustical ceiling tile. Included in the design of the building is a 28 ft. (in the east-west direction) by 36.5 ft. (in the north-south direction) central core that houses two stairwells, an elevator, and a lobby. Figures 1 & 2 illustrate these schematics.
However, two rigid moment frames located on opposite ends of the building are used to resist lateral wind forces in the north-south direction, in order to create an open floor plan for office and retail space.
Figure 1: Building Dimensions (Profile View)
Due to the 5x5 bay layout, 50 moment resisting connections are required for each of the moment frames. By placing the two moment frames in the exterior walls of the building, deeper beams can be used due to the lack of HVAC space needed between floors.
The roof of the structure is constructed with 5-ply felt and gravel, 2” rigid insulation, and 1.5” x 22 gage steel roof deck, supported by open web steel joists. The floors are constructed with 2” x 20 gage composite steel floor deck with 3.25” thick lightweight concrete slab. Finished flooring consists of carpeting in most areas, with the exception of restrooms, which are covered in ceramic tile. The ceilings are suspended acoustical tile. Exterior walls are 8” lightweight concrete block covered with 4 feet brick veneer. The exterior walls total 4 feet in height in each story to allow space for windows. The structural steel for the beams and columns is A992 steel, whereas the steel used for connection members is A36 steel. All beams and columns are AISC wide-flanged sections. The welds for the moment resisting connections are E70XX.
2.2 Loads & Load Combinations
In designing the building and the moment frame, load factors and load
recurrence. The other loads that are present in a particular combination will only reach their “arbitrary-point-in-time” values. Since the primary purpose of moment frames is to withstand lateral loads, the strength of the moment frame is tested against the three load combinations listed below, where D, L, W and Lr represent dead, live, wind, and roof live loads, respectively:
1.4 D (1)
1.2D + 1.6L +0.5Lr (2)
1.2D + 1.6W + 0.5L + 0.5Lr (3)
Of the gravity loads that are used to verify moment frame strength, the dead loads (D) are determined using weight estimations based on material manufacturing data. For this study, these estimations are taken from the Standard Building Code (1994), and are provided in Table B1. A dead load of 25 psf (lb/ft2) is used for the roof load (which consists of roof covering, insulation, steel decking, roof joists, mechanical and electrical, and ceiling material) and a dead load of 60 psf is used for the floor load (consisting of floor coverings, concrete slab and steel decking, mechanical ducts, electrical and ceiling material). Also, a dead load of 356 lb/ft is applied to each moment frame because of the brick veneer, concrete block and glass on the exterior walls.
Lr = 20R1R2, 12 psf ≤ Lr ≤ 20 psf (4)
in which R1 and R2 represent reduction factors that are controlled by the tributary area (in ft2) supported by any structural member and the slope of the roof, respectively. The maximum tributary area supported by any roof member is less than 200 ft2, resulting in a reduction factor (R1) equal to 1, and because of the flat roof, the slope is less than 4 inches of rise per foot, providing a reduction factor (R2) of 1. Consequently, a roof live load of 20 psf is adopted.
The North Carolina State Building Code (2002) is also consulted when
determining lateral loads for the frame, specifically wind loads (W). According to Figure 1609 of this code (also Figure B1 in Appendix B), the basic design wind speed for Wake County is approximately 100 mph. For a building 57.5 feet high located in Exposure Category B, a height and exposure adjustment coefficient of 1.22 is selected from Table B3, which references Table 1609.6.2.1(4) of the North Carolina State Building Code (2002). This office building also has an importance rating of Category I, as defined in Table B4. This rating simply includes all other structures not assigned to Categories II - IV. Category II structures are those that represent a significant hazard to human life in the event of failure including large schools, colleges, health care facilities, jails, and power-generating stations. Category III structures include those designated as essential facilities including fire, rescue and police stations, hospitals that provide emergency treatment and surgery, water treatment facilities, etc. Buildings represented by Category IV are structures that represent a low hazard to human life in the event of a failure such as temporary facilities or small storage facilities (North Carolina State Building Code, 2002).
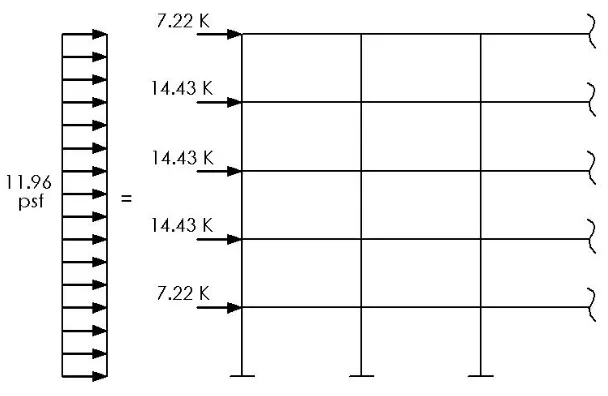
zones. The end zones are calculated to be 23.3 ft in length, creating an interior zone of 125.4 ft, and are defined in Figure B2. The resulting lateral wind load on the exterior of the building in the north-south direction is 11.96 psf (unadjusted). Since the lateral loads are distributed evenly among rigid floor systems, the adjusted concentrated lateral forces applied to the moment frame are illustrated in Figure 3.
Figure 3: Wind Load Distribution
2.3 Strength & Displacement Calculations
When considering the moment frame, both the beams and the columns experience a combination of axial and bending loads due to the wind loading. Therefore, the
For Pu/ΦPn≤ 0.2,
Pu / ΦPn + (8/9)*[(Mux / ΦMnx) + (Muy / ΦMny)] ≤ 1.0 (5) For Pu/ΦPn > 0.2,
Pu / 2ΦPn + [(Mux / ΦMnx) + (Muy / ΦMny)] ≤ 1.0 (6)
where Puand Pnrepresent the required and nominal axial strength, respectively; and Mu and Mn the required and nominal flexural strength, respectively. Also, Φ represents the applicable resistance factor. Due to the fact that this exploratory study considers only a plane frame analysis, the use of the terms Muy and Mny is ignored. When calculating the nominal flexural strength, the modification factor for non-uniform moment is taken conservatively as 1.0, as allowed by section F1.2a in the Manual of Steel Construction (2001). Since the frame analysis program evaluates the strength of the moment frame using the matrix method of analysis and includes second order non-linear analysis for P-∆
effect, the required flexural strength is taken directly from the program, which also calculates the ultimate factored moment along each member of the frame.
The sway of the building is also an important limiting factor for moment frames, and displacement for each story is limited to L/400, where L represents the height of the story (in inches). Lastly, the members are evaluated for shear strength using the
following equations:
For h/tw≤ 2.45 √(E/Fyw),
For 2.45 √(E/Fyw) < h/tw ≤ 3.07 √(E/Fyw),
ΦVn = Φ(0.6)FywAw*{[2.45√(E/Fyw)]/(h/tw)} (8)
For 3.07 √(E/Fyw) < h/tw ≤ 260,
ΦVn = ΦAw*[4.52E/(h/tw)2] (9)
where Vnrefers to the nominal shear strength, and Vu ≥ ΦVn. Vu represents the required shear strength, Fyw represents the minimum yield stress of the web, Aw is equal to the area of the web (defined as the overall depth of the web multiplied by the web thickness tw), E
CHAPTER 3: MOMENT CONNECTION DESIGN
3.1 Introduction
The Manual of Steel Construction defines moment frames as “frames in which the members and joints are capable of resisting forces by flexure as well as along the axis of the members.” These joints, or fully rigid moment connections, are said to possess sufficient rigidity to maintain the angles between intersecting members, or beams and columns. Even for those connections that are characterized as fully rigid connections, it is impractical to achieve zero rotation between members. However, the small amount of flexibility that is often present is neglected, and the connections are idealized as full restraints, allowing no relative rotation (Manual of Steel Construction, 2001). The major functions of these connections are to transfer the beam and floor loads to the columns and to maintain the lateral stability of the frame. The placement of moment frames, as well as the moment connections in the frame, is governed only by the need for symmetry within the structure, to prevent the possibility of torsion that may be present in the absence of symmetry.
detailed design for a Welded Flange Plate Connection, which is selected to develop an estimate of the cost model needed in the proposed optimization study.
3.2 Types of Moment Connections
Although several moment connection designs exist, we consider only four of the most commonly used designs in steel construction. These conventional connections are: (a) Welded Flange, (b) Welded Flange Plate, (c) Bolted Flange Plate and (d) Flange Tee-Stub Bolted. Each of these connection designs are discussed in greater detail below.
3.2.1 Welded Flange Connections
The web of the beam is bolted to a plate which has been previously welded to the column flange during fabrication. The welds connecting the flanges of the column and beam are full penetration welds, while the weld connecting the web plate to the column flange is a fillet weld.
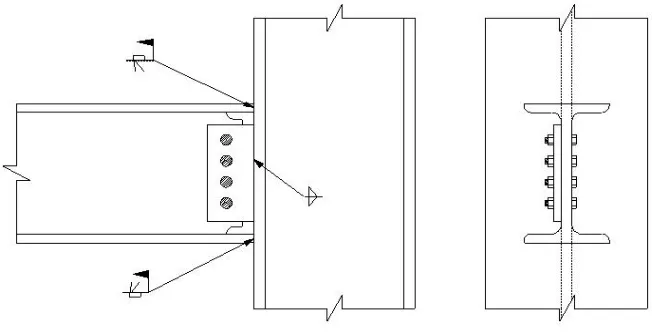
3.2.2 Welded Flange Plate Connections
A typical Welded Flange Plate connection is shown in Figure 5, where the outer surfaces of the beam flanges are welded to plates, which are then welded to the column flange. The web of the beam is also bolted to a plate that has been previously welded to the column flange during fabrication. It is important to note that the top flange plate is narrower than the beam flange, while the bottom flange plate is wider than the beam flange, which facilitates the use of horizontal fillet welds in the field. The minimum shelf dimensions for fillet welds, which govern the width of the flange plate, are specified in Figure B3, which references Figure 8-12 of the Manual for Steel Construction (2001).
This minimum shelf dimension is based on the fillet weld size, and must exceed 7/16”. A partial penetration weld is often used to connect the flange plates to the column flange, and a fillet weld is used to join the web plate to the column.
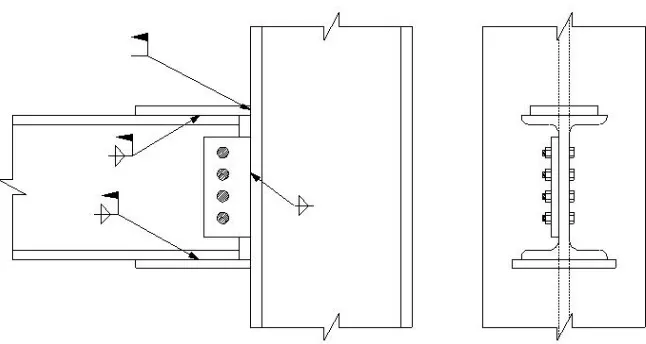
3.2.3 Bolted Flange Plate Connections
Another commonly used moment connection design is the Bolted Flange Plate connection which is shown in Figure 6. This connection is quite similar to the Welded Flange Plate connection and differs in the sense that the flange plates are bolted to the beam flange, but remain welded to the face of the column. The widths of the top and bottom flange plates of this connection are not regulated by minimum shelf dimension requirements. Instead, minimum width requirements are controlled by minimum bolt spacing and edge distances, which are specified in Table B7 and section J3.3 in the Manual of Steel Construction.
3.2.3 Flange Tee-Stub Bolted Connections
An example of the Flange Tee-Stub Bolted Connection is shown in Figure 7. For this connection, the flanges of the beam are connected to the column using tee-stubs such that the beam flanges are bolted to the web of the tee section, and the flange of the tee section is bolted to the column flange. Much like the other three connections discussed earlier in this chapter, the web of the beam is bolted to a plate that has been previously welded to the column flange during fabrication.
Among the four moment connections presented above, fabricators and erectors in North Carolina have conventionally used the Welded Flange and Welded Flange Plate connections. In order to determine an average fabrication and erection cost, the Welded Flange Plate connection is chosen and designed for the particular building considered in this study.
3.3 Design of Welded Flange Plate Connections
The design of fully rigid moment connections is a complex process that
incorporates four different areas of consideration: (i) the design of top and bottom beam flange connections, (ii) the design of the beam web connection, (iii) the design of column stiffeners and (iv) the design of panel zone doubler plates. In order to understand the additional costs associated with rigid connection construction, it is necessary to first examine the rigid connection design process and how it varies from simple pin connection fabrication. Therefore, each of the four design aspects listed above are discussed in greater detail below (with respect to the Welded Flange Plate connection described earlier).
3.3.1 Design of Top and Bottom Beam Flange Connections
In beam flange connection design, it is important to identify the required
dimensions of the flange plate and the size of the weld needed to join the flange plate to the beam. Once these values are established, each flange plate is evaluated for both the tension as well as the compression in order to account for reversible nature of lateral forces. The final stage of this process involves determining the size of the weld used to join the flange plates to the column. The specific tasks in this procedure can be
enumerated as:
• Varying the width of the flange plate with respect to the beam flange creates a ledge or “shelf” on each side of the connection, permitting the use of horizontal fillet welds when joining the plate to the beam.
• The minimum shelf dimensions are dependent on the size of the fillet weld used to join the plate to the beam, and are provided in Figure B3.
• Typically, the cross-sectional areas of the top and bottom flange plates are comparable to each other.
• The minimum fillet weld size is provided in Table B8 of Appendix B, which references Table J2.4 of the Manual of Steel Construction (2001).
• The maximum weld size is defined as the thickness of the material (along the edges of material that is less than 1/4” in thickness), or 1/16” less than the thickness of the material (along the edges of material that is 1/4” or greater in thickness).
• The minimum length of weld to be used (lmin) is calculated using the following equation:
lmin = Puf /1.392D (10)
in which, Puf represents the flange force and D corresponds to the size of the weld in sixteenths of an inch (for example, a 5/16” weld would result in a D
• The flange force can be found using the following equation, where Mu represents ultimate moment capacity and d corresponds to the depth of the beam.
Puf = Mu / d (11)
• The flange force is also compared to nominal design values in order to ensure that the connection meets the design requirements. All nominal design values should exceed the maximum flange force experienced by the connection during loading.
• When considering tension, the plate should be evaluated for yielding (Equation 12) and rupture (Equation 13), as well as base metal strength (Equation 14). In these equations, Fy and Fu are the minimum yield stress and the minimum tensile strength of the type of steel being used, respectively. U
represents the shear lag reduction coefficient used to calculate effective net area, and Aw refers to the area of the weld. Ag is the gross cross-sectional area of the plate.
ΦRn = ΦFyAg≥ Puf (12)
ΦRn = ΦFuUAg≥ Puf (13)
• Welds should be verified for weld rupture (Equations 15 & 16), where FEXX and Aw represent the electrode strength and area of weld, respectively. θ
refers to the angle (in degrees) of loading measured from the weld longitudinal axis.
ΦRn = ΦFwAw≥ Puf (15)
Fw = 0.6FEXX(1+0.5sin1.5θ) (16)
• The beam flange should be checked for block shear (Equation 17). The variables Antand Anvare net areas for tension and shear, respectively. The areas Agtand Agv are gross cross-sectional areas for tension and shear.
ΦRn = Φ{max|Ten. Rupure.+ min | Opposite Yield } ≥ Puf (17)
| Shear Rupture | Opposite Rupture
where the above are defined as: Tension Rupture = FuAnt
Shear Rupture = 0.6FuAnv
Tension Yield = FyAgt
Shear Yield = 0.6FyAgv
• For flange plates under compression, checks are performed for local
rupture (in the plate below or above the welds, depending on the load case – Equation 22).
bf /tp≤ 1.49√(E/Fy) (18)
b/tp≤ 0.56√(E/Fy) (19) ΦRn = ΦFcrAg≥ Puf (20)
ΦVn = Φ0.6FyAg≥ Puf (21)
ΦVn = Φ0.6FuAg≥ Puf (22)
For the stiffened element, bf is the distance (in inches) equal to the base of the beam flange. For the unstiffened element, b represents the length (in inches) of the flange plate that extends beyond the base of the beam flange. In both instances, tp refers to the thickness of the plate. In Equation 20, Fcr is the critical stress associated with the plate (f(kl/r)) and Ag is the gross cross-sectional area of the plate.
• To determine the size of the fillet weld used to join the top and bottom flange plates to the column flange, the following equation is utilized:
Dmin = Puf /(2*1.5*1.392l ) (23)
represent a double sided weld and a load perpendicular to the weld, respectively. l represents the length of the weld to be used.
• Due to the orientation of the weld, a maximum size for this weld is not specified. However, a minimum weld size can be found by referencing Table B8.
3.3.2 Design of Beam Web Connection
Design of the flange plates is followed by the development of beam web connection, which consists of a single plate that is welded to the column flange and bolted to the web of the beam. This process is described in greater detail below.
• To determine the geometry of the web plate, it is necessary to first calculate the number of bolts required for shear. The minimum number of bolts (nmin) can be found using Equation 24, where the shear experienced by the
connection (Vu) is divided by the design strength of the selected bolt (Φrn).
nmin = Vu / Φrn (24)
• The thickness of the plate is restricted by the diameter of the bolt, and cannot exceed a total thickness of 1/16” plus one half of the bolt diameter.
Distances of 3 times the nominal bolt diameter are preferred (Manual of Steel Construction, 2001).
• The minimum edge distances for bolts are listed in Table B7, which is taken from Table J3.4 of the Manual of Steel Construction (2001).
• The total width of the plate should exceed half of the distance between web toes of fillets at the top and bottom of the beam web (T), but should not surpass the total distance T.
• With dimensions established, the web plate is evaluated for shear yielding and rupture (Equations 21 & 22), block shear (Equation 17), and bearing and tear out (Equations 25, 26, & 27). In these equations, Rn represents the design strength (per bolt hole) for bearing and tear out, and is set equal to the smaller of the two values (Rn = 1.2LctFu ≤2.4dbtFu). Furthermore, dbrefers to the diameter of the bolt, t represents the thickness of the plate, and Lc is the clear distance between two bolt holes or between one bolt hole and the edge of the plate.
2.4dbtFu (bearing strength) (25)
1.2LctFu (tear out strength) (26)
Φ∑Rn ≥ Puf (27)
• The size of the weld used to join the web plate to the column flange should be greater than 75% of the plate thickness and must be greater than or equal to the minimum weld size given in Table B8.
• It is important to note that for all the bolt hole related limit states, with the exception of bearing and tear out, the effective hole diameter used in calculations is 1/16” greater than the actual hole diameter. For tear out, the actual hole diameter is used in calculations, while the bolt diameter is used for calculating bearing. Table B6 defines the nominal hole dimensions.
3.3.3 Design of Column Stiffeners
The design of actual moment connection is followed by evaluation for several column limit states. These include local flange bending, local web yielding and
crippling, and web buckling, which are discussed in further detail in sections K1.2, K1.3, K1.4 and K1.6 of the Manual of Steel Construction. A failure related to these limit states, with the exception of web buckling, results in the use of half depth column stiffeners. A web buckling violation necessitates the use of full depth stiffeners. Next, we provide a detailed description of specific tasks needed in the method for sizing the column stiffeners when installation is required.
Ast = (Ru – ΦRn)/0.9Fys (tension) (28)
Ast = (Ru – ΦRn)/0.85Fys (compression) (29)
in which Ru and Rn are the required and nominal strengths, respectively, Fys is the minimum yield stress of the stiffener material, and Φ is the resistance factor.
• The restrictions for the dimensions of the width or breadth (bs) and thickness (ts) of the stiffener plate (Figures 8 & 9), are:
bs + (twc/2) ≥ (bp/3) (30)
ts≥ (tp/2) (31)
bs/ts≤ 0.56 √(E/Fy) (32)
• In Equations 30, twc refers to the thickness of the column web, and bp represents the breadth of the plate used in the moment connection. In
situations where plates are not utilized, the breadth of the flange (bf) is used.
Figure 8: Transverse Column Stiffener Dimensions
Figure 9: Transverse Column Stiffener
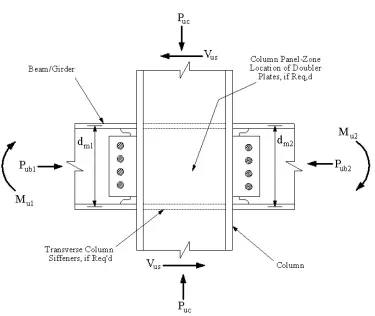
3.3.4 Design of Panel Zone Doubler Plates
• The equation used for determining the total force acting on the panel zone is:
∑Fu = [(Mu1/dm1) ± (Pub1/2)] + [(Mu2/dm2) ± (Pub2/2)] – Vus≤ 0.9Rv (33)
in which The variables Mu1and Mu2 refer to the moments experienced by the beams that are framed into the column at the connection, Pub1 and Pub2 refer to the beam axial loads, and Vus represents the story shear. The lengths dm1 and dm2 can be found by subtracting the thickness of the beam flange from the corresponding beam depth, which is approximated as 0.95 times the beam depth (Clean Columns, 2005).
• If the sum of forces exceeds the web shear strength (Rv), which is multiplied by the appropriate resistance factor (Φ = 0.9), panel zone doubler plates are required (Figure 10).
• The shear acting on the doubler plate (Vu) then becomes equal to the difference between ∑Fuand ΦRv.
• A plate thickness (tp) should be selected so that Vu ≤ 0.9Vn, where for shear yielding,
Vn = 0.6Fyphtp , h/tp≤ 2.45 √(E/Fy) (34)
in which Fypcorresponds to the minimum yield stress of the doubler plate, and
Fy represents the minimum yield stress of the column material.
• The dimension h for the doubler plate is found by subtracting a total of twice the column flange thickness from the column depth. If the thickness required is greater than one inch, the use of two doubler plates is necessary (Clean Columns, 2005).
A numerical design example for Welded Flange Plate connections is provided in
were considered negligible. Furthermore, the cost of steel (for fabrication and materials) was approximated as $600 per ton of steel.
CHAPTER 4: OPTIMIZATION OF MOMENT CONNECTIONS
4.1 Introduction
The majority of optimization studies performed in the past have focused on minimizing the weight of moment resisting steel frames and fail to consider the labor costs associated with fabricating and erecting moment connections. In recent years, the labor cost of in-situ welding and fabrication have contributed significantly to the total frame cost. The purpose of this study is to develop an optimization technique that considers both these costs, i.e. the cost of fabrication and labor associated with rigid connections and the hardware cost of the members. In doing so, the emphasis is not placed on finding lighter members to create a least-weight design, but on identifying the number and locations of moment connections that result in a design with the least overall cost.
to strength and serviceability constraints. In the event that strength or serviceability violations occur because of a reduction in the total number of moment connections, those beams or columns associated with the violation are replaced with larger/heavier
members. A detailed discussion of Genetic Algorithms and the optimization method used in this study is provided in this chapter.
4.2 GA-Based Discrete Optimization
Genetic Algorithms, or GA’s, are population-based search algorithms that model the processes of evolution, most notably the concepts of natural selection and adaptation. Because they are population-based algorithms, GA’s operate on a collection of potential solutions that are represented using strings, instead of attempting to improve upon a single/initial solution. The strings consist of a sequence of characters, usually numbers, which correspond to the values of distinct design variables of the problem. A string can consist of either binary or integer numbers depending upon the nature of formulation used to represent the optimization problem. It is important to note that a valuable characteristic of the GA is the ability to maintain population diversity during the search process in order to avoid local optimal solutions in the pursuit of finding a global (true) optimal solution.
Optimal Structural Design, 2002). In structural design, the fitness function typically includes: (a) the total cost of the structure, (b) stress constraints and (c) displacement constraints. Typically, problem-specific constraints are modeled as penalty functions in the fitness function. The total penalty applied to a particular solution is related to the degree by which it violates constraints. The optimization technique used in this study implements a corrective scheme, which does not enforce the application of penalties in the case of a constraint violation. Rather, penalty values are assigned only when the solutions with violations are deemed uncorrectable.
4.2.1 GA-Operators: Populating the GA and Selection
generation. While the selection operation does not change the features of the strings, it provides each string with a varying probability of becoming a parent string. Then, the next generation of solutions is created using selected pairs of parent strings and processing them through the crossover and mutation genetic operators.
4.2.2 GA-Operators: Crossover
The second GA-operator, crossover, allows for a pair of parent strings to spawn two offspring by mixing and matching their desirable traits through a random process. Here, traditional one-point crossover is illustrated as an example. During this method, a single parent string is broken into two segments, and one of these two segments is exchanged with the corresponding segment of the other selected parent string. The location and length of the segments to be switched are chosen at random. A simple example of one-point crossover is provided in Figure 11 in which the division occurs after the fourth bit in a string of length seven bits.
PARENT 1: 0 0 1 1 1 0 1 PARENT 2: 0 1 0 1 0 1 0
OFFSPRING 1: 0 0 1 1 0 1 0 OFFSPRING 2: 0 1 0 1 1 0 1
4.2.3 GA-Operator: Mutation
Mutation is the third genetic operator used by the GA, and allows an occasional feature to be created and passed on to the offspring that may not have existed in either parent string. Introducing these new traits permits the search area to be expanded so that possibly unexplored regions are introduced into the search. The purpose is to maintain diversity for avoiding local optimals. This method mimics natural mutation, reading through the string of binary characters and changing them from 0 to 1 or from 1 to 0 if the random probability test is passed. The probability of mutation is typically very low, but helps to protect against the loss of important characteristics (or diversity) from generation to generation. A simple example of mutation is given in Figure 12. In this case, the probability of mutation is set to 0.003, i.e. only those bits (characters) assigned probability values lower than 0.003 are mutated.
OLD STRING RANDOM PROBABILITY NEW STRING
0011 0.571 0.303 0.107 0.001 0010
1011 0.714 0.161 0.002 0.259 1001
Figure 12: Mutation within the GA
4.3 Optimization for Moment Connections
serviceability constraints. A binary string is used in this study, where a value of 1 represents the existence of a moment connection at that location and a value of 0
represents a pinned connection. Using a “roll-of-the-dice” process to seed the GA results in strings having a random mix of ones and zeros. As stated earlier in this thesis, the focus of our study is on identifying the trade-off between the total cost and the number of moment connections used. Evaluation of the trade-off curves requires generation of the optimal solution for a specified number of connections and repeating the process by varying the specified number of connections. Therefore, each GA run is seeded with all solutions having exactly the same number of moment connections as specified by the user.
two offspring (Gupta, 2005). An example of the new crossover technique is illustrated in the following figure.
PARENT 1: 0 1 0 1 1 1 0 0 PARENT 2: 1 0 0 1 0 1 1 0
OFFSPRING 1: 0 0 0 1 1 1 1 0 OFFSPRING 2: 1 1 0 1 0 1 0 0
Figure 13: Unique Crossover Scheme
Imposing symmetry throughout the frame is also an important feature of the GA used in this study. The two dimensional frame solutions are required to be symmetrical in order to provide the same amount of resistance against lateral loading applied in either of the two possible directions. This feature is also preferable in three dimensional models, because it prevents torsion from developing within the structure. Such a restriction would not be necessary if the frame were irregular in shape or if it were exposed to asymmetrical loading. Imposing symmetry also provides a significant
reduction in the search space, making it easier for the GA to identify acceptable solutions.
The main purpose of the study is to include the cost of connections in the optimization of moment frames, so the cost function is set as follows:
where CT, nc, and Ws represent the total cost of the frame ($), the number of connections, and the weight of the steel (in tons), respectively. The $600 and $900 values are based on industry averages provided by steel fabricators and structural engineering firms located in the building area. After defining the cost function, the GA’s optimization scheme is set to minimize the following objective function (Z):
Z = CT + 100000PI + 100000PS (37)
The variables PI and PS correspond to penalties added to the total cost based on violations in strength (interaction values) and serviceability (sway), respectively. These penalties are applicable only to solutions that violate the respective constraints, i.e., PI > 0 only if the solution violates Equations 5 - 9 and PS > 0 only if the sway in any floor of the frame exceeds the limit, L/400, where L is the story height. In a feasible solution, each member of a frame must conform to Equations 5 - 9 and also satisfy the story sway requirements. Hence, PI = PS = 0 for feasible solutions. For an infeasible solution, PI equals the sum of the left-hand side of Equations 5 - 9 for each of the members of the frame that violate these equations. Similarly, PSis the sum of the sway violations for each column member in the frame. In Equation 37, the multiplication factors are set very high (= 100,000) to ensure that infeasible solutions are eliminated from the population.
The GA incorporates analysis performed by a Java-based strength and
frame model is created (Figure 16). A matrix analysis is then performed for the
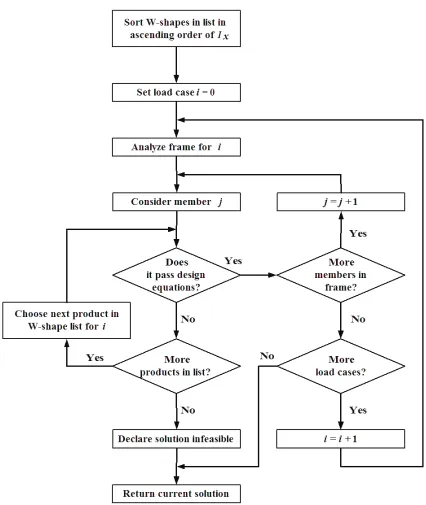
predefined load cases to solve for member end forces and displacements, and shear and moment distributions. P-∆ effects are considered for both the entire frame and for the individual members (by way of the geometric stiffness matrix). The interaction value for each member is computed using the results from matrix method analysis. If violations occur based on this strength condition, the members are replaced with acceptable AISC wide-flanged steel sections from a database. This selection is performed by opting for the column or beam with the next highest moment of inertia in the list. The database for replacement columns is limited to wide-flanged beams 14” in depth. A check is also performed for failure due to shear. This algorithm is illustrated using a flowchart in Figure 14.
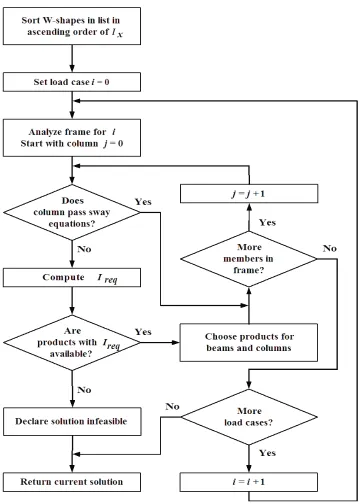
After replacing the faulty members, the frame is then re-evaluated, and floor displacements are calculated. When sway violations are present, the program uses the algorithm given in Figure 15 to correct the solution. Suitable members are once again selected from a database of AISC wide-flanged steel sections, which are arranged in order of increasing moment of inertia. Since the floor displacement is proportional to the bending stiffness, all of the members of that specific floor – beams and columns, are replaced with new members such that the moment of inertia for each new member (Inew) satisfies the following condition,
whereδactis the actual floor displacement, Iorig is the moment of inertia for the member being replacedand δallowed = L/400, the permitted sway given the story height is L.
Figure 15: Algorithm for Correcting Solutions that Violate Sway Constraints
lightest members are included in the database. The severity of the violation determines the order in which the floors are selected for replacement of members by the program, and the frame is re-examined after each phase. Information for the new solution is then sent back to the GA in order to determine fitness. If a solution can not be found where both of the limit states were met, penalties are applied to the objective function,
decreasing the probability that the characteristics of the faulty frame are passed on to future generations. A flowchart of the GA and the fitness evaluation process are provided in the following figure.
Figure 16: GA Flowchart
Seeding of Population
Fitness Evaluation Reproduction Crossover Mutation Fitness Evaluation Test for Convergence YES Stop NO Perform Matrix Analysis
Find Member End Forces & Displ.
Evaluate Interaction Equation
Replace Faulty Members and
Re-evaluate Fitness
Evaluate Floor Displ.
Replace Faulty Members and
Re-evaluate Fitness
4.4 Validation of the Frame Analysis Program
As stated in previous sections, the GA within this optimization method incorporates analysis performed by a Java-based strength and serviceability program when evaluating the effectiveness of new solutions. This analysis program is based on the matrix method of determining member-end forces and displacements. As validation for the accuracy of this program, a comparison of analyses performed by both the Java-based program and SAP2000 is provided in Tables 1 and 2. This comparison includes two separate examples: (1) a simple two member frame provided in Figure 17 and (2) a 5-story moment frame subjected to lateral wind loads. While slight discrepancies exist, the frame analysis program sufficiently models the reaction of the frame to loading.
DX (in)
DY (in)
Rz (rad)
0.0213 -0.0673 -0.0025 0.0213 -0.0673 -0.0026 FRAME ANALYSIS PROGRAM SAP2000
NODE 2 OF TWO MEMBER FRAME EXAMPLE
Table 1: Frame Analysis Program & SAP2000 Comparison
FLOOR 1 2 3 4 5
DX (in) OF FIVE STORY MOMENT
FRAME (LATERAL LOADING ONLY)
FRAME ANALYSIS SAP2000
0.1920 0.1920 0.4830 0.4870 0.7790 0.7950 1.019 1.195 1.045 1.227
CHAPTER 5: RESULTS
5.1 Hand Optimized Moment Frame
The preliminary optimization attempt using a connection-dependent optimization scheme focuses solely on reducing the total number of moment connections, without altering the sizes of the members within the frame. The motivation behind this initial phase is two-fold: improving upon the model of a hand designed least-weight optimal solution and observing patterns associated with connection removal, so that connections more important to overall frame integrity could be identified. The subject frame is designed with moment connections at every beam to column intersection (50 total connections) in an attempt to reduce the total weight of the frame as much as possible. While placing rigid connections at each beam end causes a slight increase in the size of the beam (the beam is required to support greater moments), serviceability constraints related to floor displacements and sway typically control the design of a frame. Therefore, increasing the rigidity of the frame through the use of moment connections ultimately reduces the total weight of the frame. The hand-designed frame has a total weight of approximately 36 tons and costs an estimated $66,568.00 for materials and labor. The largest beam member is a W30x99, while the largest column member is a W14x211.
the hand designed frame satisfies all the strength and serviceability requirements even if half the number of total possible rigid connections in the frame are eliminated Several solutions with totals ranging between 24 and 28 number of connections are found
acceptable, passing both strength and serviceability requirements (Figures 18, 19, & 20). Most, if not all, of the solutions presented by the optimization scheme consisted of unorthodox connection placements, which allows for the discovery of more cost effective designs not considered by current practices. Some of the most notable connection layouts are the 24-connection “inverted arch” and “arch” solutions and the 26-connection “bow-tie” solution. A reduction from 50 to 24 connections results in a difference of
$23,400.00, with the 24-connection frame costing an estimated $43,168.00.
Figure 19: 24-Connection "Arch" Solution
Figure 20: 26-Connection "Bow-Tie" Solution
5.2 SAP 2000 Optimized Moment Frame
replacement strategy that allows for further reduction in the number of moment
connections within the frame. As mentioned previously, the use of moment connections at each beam to column intersection results in the lightest possible moment frame. While the hand-optimized frame provides a good starting point, it is considerably over-designed (as evidenced by the large reduction in moment connections before the occurrence of failure due to sway). Therefore, a least-weight design of this frame with all the connections as rigid connections will provide a more accurate comparison and
differences between the least-weight optimization and connection-based optimization. SAP 2000 (version 7.0) is used to generate a new least-weight design using the function Auto Select Frame, a steel optimization method which implements a list of possible frame sections for each member. Unfortunately, this function is limited; only selecting the lightest section in an Auto Select group that satisfies all of the stress requirements.
The member replacement approach used to eliminate moment connections from the least-weight design shows that an even greater reduction can be achieved in the number of moment connections and in the total cost. Each possible connection total, between 2 and 48, is processed by the GA on three separate occasions using a population size of 100, producing the graph pictured in Figure 24. On several instances the results are duplicated by the GA, further establishing those values as close to true minimums. Through the exchange of sections, an optimal solution is found to contain a mere 12 rigid connections (Figure 22), weighing 31.679 tons and costing approximately $29,800. Only an additional 9.481 tons of steel ( 42.7% more than the original least-weight) is required to produce such a drastic reduction in overall cost. These results illustrate our original premise that with currently high costs of fabrication and labor, a majority of the focus should be placed on minimizing the quantity of connections used (or reducing the
connection-related costs) instead of on developing methods centered around least-weight designs. Several acceptable alternative designs are found to contain 10 and 14
Figure 21: 10-Connection Solution
Figure 23: 14-Connection Solution
25,000 30,000 35,000 40,000 45,000 50,000 55,000 60,000
0 5 10 15 20 25 30 35 40 45 50
Number of Moment Connections
To
ta
l Fr
a
m
e
C
o
s
t
($
)
0 10,000 20,000 30,000 40,000 50,000 60,000
0 10 20 30 40 50 60
Weight of Steel (tons)
T o tal F ram e C o st ($ )
Figure 25: Graph of Total Weight vs. Total Frame Cost
6 16 26 36 46
7 17 27 37 47
8 18 28 38 48
9 19 29 39 49
10 20 30 40 50
1 15 14 13 12 11 5 4 3 2 21 35 34 33 32 31 25 24 23 22 41 55 54 53 52 51 45 44 43 42
Member Number SAP 2000 Optimized 10 Connector Solution 12 Connector Solution 14 Connector Solution Member Number SAP 2000 Optimized 10 Connector Solution 12 Connector Solution 14 Connector Solution 1 W14x120 W14x132 W14x132 W14x132 31 W14x120 W14x132 W14x132 W14x132 2 W14x120 W14x257 W14x233 W14x233 32 W14x120 W14x257 W14x233 W14x233 3 W14x53 W14x120 W14x74 W14x74 33 W14x53 W14x132 W14x74 W14x74 4 W14x53 W14x74 W14x68 W14x68 34 W14x53 W14x74 W14x68 W14x68 5 W14x53 W14x53 W14x68 W14x61 35 W14x53 W14x53 W14x68 W14x61 6 W12x14 W12x14 W12x19 W12x16 36 W12x14 W12x14 W12x19 W12x16 7 W14x22 W18x35 W18x35 W18x35 37 W14x22 W18x40 W18x35 W16x31 8 W18x35 W24x62 W21x44 W21x44 38 W18x35 W24x62 W21x44 W21x44 9 W18x35 W24x62 W24x76 W24x76 39 W18x35 W24x84 W24x55 W24x55 10 W18x35 W18x40 W16x40 W16x40 40 W18x35 W18x40 W16x40 W16x40 11 W14x120 W14x132 W14x132 W14x132 41 W14x120 W14x132 W14x132 W14x132 12 W14x120 W14x257 W14x233 W14x233 42 W14x120 W14x257 W14x233 W14x233 13 W14x53 W14x120 W14x74 W14x74 43 W14x53 W14x120 W14x74 W14x74 14 W14x53 W14x74 W14x68 W14x68 44 W14x53 W14x74 W14x68 W14x68 15 W14x53 W14x53 W14x68 W14x61 45 W14x53 W14x53 W14x68 W14x61 16 W12x14 W12x14 W12x19 W12x16 46 W12x14 W12x14 W12x19 W12x16 17 W14x22 W18x40 W18x35 W16x31 47 W14x22 W18x35 W18x35 W18x35 18 W18x35 W24x62 W21x44 W21x44 48 W18x35 W24x62 W21x44 W21x44 19 W18x35 W24x84 W24x55 W24x55 49 W18x35 W24x62 W24x76 W24x76 20 W18x35 W18x40 W16x40 W16x40 50 W18x35 W18x40 W16x40 W16x40 21 W14x120 W14x132 W14x132 W14x132 51 W14x120 W14x132 W14x132 W14x132 22 W14x120 W14x257 W14x233 W14x233 52 W14x120 W14x257 W14x233 W14x233 23 W14x53 W14x132 W14x74 W14x74 53 W14x53 W14x120 W14x74 W14x74 24 W14x53 W14x74 W14x68 W14x68 54 W14x53 W14x74 W14x68 W14x68 25 W14x53 W14x53 W14x68 W14x61 55 W14x53 W14x53 W14x68 W14x61 26 W14x22 W14x22 W16x26 W14x26
27 W16x26 W18x40 W18x40 W18x40 28 W18x35 W24x62 W21x44 W21x44 29 W18x35 W24x62 W24x55 W24x55 30 W18x35 W18x40 W16x40 W16x40
Figure 27: Member Sizes for Various Solutions
The benefit of evaluating trade-off between the total cost and the number of connections is quite dependent upon the relative costs associated with the labor and the material. Consequently, we decided to conduct a sensitivity study by reevaluating the trade-off curves for different ratios of connection cost (labor and fabrication) to hardware cost (material cost per ton of steel).i.e.
Consequently, the trade-off curve presented earlier in Figure 24 is valid for only a value of CR = $900/$600 = 1.5. To evaluate the sensitivity of trade-off curves to the value of CR, we considered four different values of CR that are equal to 1.0, 1.25, 1.75, and 2.0 by varying the connection cost from $750 to $1000 per connection and by varying the material cost between $500 to $750 per ton of steel. The cost combinations and the corresponding values of cost ratios considered in the study are given in Table 3.
Regardless of the cost ratio, the resulting frames all experience a substantial reduction in both the number of moment connections used and in the total cost of the frame. Each optimization series within this range produces an optimal solution with either 10 or 12 moment connections, and total cost savings of at least 38%. Figure 28 gives these trade-off curves.
Cost of Moment Connection ($)
Cost of Steel per
Ton ($) Cost Ratio
Least-Weight Design Cost ($)
Minimized Cost ($)
% Reduction in Total Cost
750.00 750.00 1 54,148.31 33,218.63 38.65
825.00 660.00 1.25 55,900.52 31,367.00 43.89
900.00 600.00 1.5 58,318.65 29,807.25 48.89
945.00 540.00 1.75 59,236.79 28,183.55 52.42
1,000.00 500.00 2 61,098.88 27,409.38 55.14
20,000 25,000 30,000 35,000 40,000 45,000 50,000
0 2 4 6 8 10 12 14 16 18
Num ber of Mom ent Connections
T o ta l F ram e C o st ( $ )
1.0 Ratio 1.25 Ratio 1.75 Ratio 2.0 Ratio
Figure 28: Comparison of Cost Ratios Graph
and $900 per moment connection) the optimal solution contained only 10 moment connections, weighed approximately 35.710 tons and cost an estimated $30,425. Figure 29 illustrates the same general cost-saving trend as before, but with a small increase in total cost throughout. Figure 30 provides new trade-off cost curves, comparing the loss of moment connections to an increase in total frame weight. Figure 31 lists the member sizes of the optimal 10 connection solution, and also gives an example of how the adjusted GA produces a more realistic moment frame.
25,000 30,000 35,000 40,000 45,000 50,000 55,000 60,000
0 5 10 15 20 25 30 35 40 45 50
Number of Moment Connections
T ot al F ram e C os t ( $)
25,000 27,000 29,000 31,000 33,000 35,000 37,000 39,000 41,000 43,000 45,000
0 2 4 6 8 10 12 14 16 18 20
Number of Moment Connections
To ta l Fra m e C os t ($ )
1.0 Ratio 1.25 Ratio 1.75 Ratio 2.0 Ratio
Figure 30: Comparison of Cost Ratios Graph (Lower Column Correction)
1 W14x120 W14x193 29 W18x35 W21x44 2 W14x120 W14x193 30 W18x35 W18x35 3 W14x53 W14x99 31 W14x120 W14x193 4 W14x53 W14x99 32 W14x120 W14x193
5 W14x53 W14x90 33 W14x53 W14x120
6 W12x14 W12x22 34 W14x53 W14x99
7 W14x22 W21x44 35 W14x53 W14x90
8 W18x35 W21x55 36 W12x14 W12x22
9 W18x35 W21x44 37 W14x22 W18x40
10 W18x35 W18x35 38 W18x35 W21x55
11 W14x120 W14x193 39 W18x35 W24x68 12 W14x120 W14x193 40 W18x35 W18x35 13 W14x53 W14x99 41 W14x120 W14x193 14 W14x53 W14x99 42 W14x120 W14x193
15 W14x53 W14x90 43 W14x53 W14x99
16 W12x14 W12x22 44 W14x53 W14x99
17 W14x22 W18x40 45 W14x53 W14x90
18 W18x35 W21x55 46 W12x14 W12x22
19 W18x35 W24x68 47 W14x22 W21x44
20 W18x35 W18x35 48 W18x35 W21x55
21 W14x120 W14x193 49 W18x35 W21x44 22 W14x120 W14x193 50 W18x35 W18x35 23 W14x53 W14x120 51 W14x120 W14x193 24 W14x53 W14x99 52 W14x120 W14x193
25 W14x53 W14x90 53 W14x53 W14x99
26 W14x22 W16x31 54 W14x53 W14x99
27 W16x26 W21x44 55 W14x53 W14x90
28 W18x35 W21x55
SAP2000 Optimized 10 Connection Solution Member Number SAP2000 Optimized 10 Connection Solution Member Number
CHAPTER 6: CONCLUSION
6.1 Summary
A majority of optimization studies, past and present, have placed a strong
emphasis on reducing the total weight of steel, without formally considering the effect of escalating labor costs associated with fabrication and erection of moment resisting rigid connections. Therefore, the objective of this study is to develop an optimization scheme that focuses on evaluating connection costs in addition to costs associated with frame weight. Instead of determining least-weight designs, optimal solutions are found by altering the number of moment connections within the frame; replacing some of the rigid connections within the frame with standard pinned connections, and increasing member sizes where needed. A Genetic Algorithm is used in order to identify the optimal number and location of connections within a frame, and each frame is evaluated using the matrix method of analysis to ensure that strength and serviceability requirements are met.
6.2 Conclusions
considerably, i.e. to only 10 connections instead of 50 connections. In doing so, the weight of the frame increases by 13.512 tons, i.e. from 22.198 to 35.710 tons. The reduction in overall cost is almost 48%. Furthermore, a sensitivity analysis by varying the ratio of connection cost to material cost shows that the results do not change much and the contribution of connection cost remains significantly high.
The unorthodox connection arrangements produced are also important, as they provide alternative designs that, while functional, may never be explored by the designer. Regardless of connection arrangement, a majority of the frames failed due to sway
violations rather than strength-related limit states. It is important to note that due to the technique used in the member replacement method, results produced by the GA consist of several different beam and column sizes throughout. In current practice, it is not practical to change the size of the column for each story. Therefore, as with most computer-based optimization or design programs, engineering judgment still plays and important role in developing a final product.
6.3 Future Work
Moment frame designs often include panel zone doubler plates at every beam to column connection. This is a very conservative approach which contributes to a
of connections with varying cost amounts (instead of applying an average cost of $900 per connection): connections without bracing, connections with column web stiffeners, connections with panel zone stiffener plates, and connections with both forms of bracing. The inclusion of steel erection costs (in addition to the $600 material cost) would also improve the cost model.
Extending the use of this optimization technique to other structures and loading cases could provide more useful data for the eventual development of a new design method. While this study focused on a two-dimensional rectangular structure, this
technique could be applied to both irregular structures and three-dimensional symmetrical structures to observe how changes in geometrical characteristics of the moment frame affect the entire structure. These modifications to the moment frame may also affect its ability to resist other lateral loading cases, especially during an earthquake.
Improvements on the current least-weight design model could also be made. By reviewing the information in Figures 24 & 25, one may observe that a total of 16
REFERENCES
American Institute of Steel Construction. (2001). Manual of Steel Construction: Load and Resistance Factor Design (3rd ed.).
American Institute of Steel Construction. (2005). Clean Columns (Version 3.1). < www.aisc.org > (2005, February 14).
American Society of Civil Engineers. (2002). Recent Advances in Optimal Structural Design (Scott A. Burns, Ed.).
Camp, Charles V. (2005). Design of Steel Frames Using Ant Colony Optimization. Journal of Structural Engineering, 131 (3), 369-379.
Camp, Charles V. (2004). Design of Low-Weight Steel Frames Using Ant Colony Optimization. Proceedings of the 2004 Structures Congress – Building on the Past: Securing the Future, 1529 – 1539.
Gupta, Abhinav, et al. (2005). Genetic Algorithm-Based Decision Support for Optimizing Seismic Response of Piping Systems. Journal of Structural Engineering, 131 (3), 389-398.
Holland, J.H. (1975). Adaptation in Natural and Artificial Systems. Ann Arbor: The University of Michigan Press.
Jenkins, W.M. (1991). Towards Structural Optimization Via The Genetic Algorithm. Computers and Structures, 40 (5), 1321-1327.
Jenkins, W.M. (1991). Structural Optimisation with the Genetic Algorithm. The Structural Engineer, 69 (24), 418-422.
Kameshki, E.S. (2001). Optimum Design of Nonlinear Steel Frames with Semi-Rigid Connections Using a Genetic Algorithm. Computers and Structures, 79 (17), 593-1604.
Kim, Seung-Eock (2004). Optimal Design Using Genetic Algorithm with Nonlinear Elastic Analysis. Structural Engineering and Mechanics, 17 (5), 707-725.