ABSTRACT
HOSSAIN, MD. SAHADAT. Mechanics of Compressibility and Strength of Solid Waste in Bioreactor Landfills (Under the direction of Prof. Mohammed A. Gabr)
Bioreactor landfills are operated to enhance refuse decomposition, gas production, and waste stabilization. A major aspect of bioreactor landfill operation is the recirculation of collected leachate back through the refuse mass. While there are significant economic advantages to the operation of landfills as a bioreactor, our understanding of the mechanics governing accelerated waste degradation and its impact on waste geotechnical properties is limited. As such, there is a need to explain and quantify such impact on compressibility and shear strength parameters; these parameters are needed for the three design phases of landfill construction, operation, and post-closure.
The overall objective of the research was to develop an understanding of change in refuse compressibility and strength during accelerated waste decomposition in landfills operated as bioreactors. An experimental program was performed to provide data on parameters describing MSW compressibility and strength properties as a function of the state of decomposition, gas generation, and physical characteristics of waste particles. The research links the measured parameters to the physical and biological changes that take place as waste decomposition is accelerated. The research provides data on the significance of using relatively small equipment and shredded waste relative to field-estimated properties. The research develops a model of waste settlement that considers the effect of high moisture content and time-dependent property changes on waste compressibility. This research also develops a model for shear stress-displacement behavior of MSW in bioreactor landfills.
production phase, and early and late in the decelerated methane production phase.
The experimental program was performed using oedometer and direct shear tests to determine the compressibility parameters and shear strength parameters and illustrate the effect of shredding and equipment size on compressibility and strength parameters for refuse (at different degrees of degradation). The extent of degradation was documented by gas production rates as well as (C+H)/L ratios.
Oedometer test conducted on 63.5 mm, 100mm, 200mm diameter equipment with constant R, specimen to equipment size ratio, indicate that compressibility parameters are dependent on R. Compressibility parameters are similar with constant R even though the equipment size varies. Shredding of MSW affects mainly initial compression as observed from the test results on same equipment with variable R. For example, initial compression for MSW in 200mm equipment is 31% and 35% for R =0.34 and 0.17, respectively. Creep and biological strain rate of MSW is not affected by shredding. The variation of the magnitude of biological indices with varied R is minimal. The shear strength is affected by shredding as the light-weight reinforcing materials are shredded into smaller pieces during specimen preparation. The measured shearing angles are 31 o and 27 o for R=0.50 and 0.25, respectively. The larger components in the specimen act as better reinforcing element than shredded smaller components during the shear test.
Compressibility increased with increasing gas production as solid-to-gas conversion took place. Testing results indicated a correlation between the coefficient of primary compression (Cc) and (C+H)/L ratio. The coefficient of primary compression (Cc) for all samples showed an increasing trend with decreasing (C+H)/L. Results indicated the creep index (Cα) to be independent of the state of waste decomposition. The
creep index range was 0.02 to 0.03 for traditional and bioreactor samples in various states of decomposition. The magnitude of the biological indices varied with the state of decomposition and yielded the highest values (Cβ=0.19) when samples were actively
decomposing and had substantial methane potential remaining.
material, percentages of plastic content increases and contributes to decrease in friction angle. Accordingly, testing results indicated a correlation between strength parameters and (C+H)/L ratio. For example, measured shearing angle for bioreactor samples decreased from 32 o to 24 o as (C+H)/L ratio decreased from 1.29 to 0.25. The predicted shear behavior by the developed constitutive model for shear stress displacement was matched with the experimental results.
BIOGRAPHY
iii
I would like to extend my gratitude to the Environmental Protection Agency for funding the research.
I am very grateful to my advisor, Dr. Mohammed A. Gabr, for his constant guidance, encouragement and support during the research period. Completion of the work required for this degree would have been impossible without him. The input provided by Dr. Morton A. Barlaz, his interest and optimism in the research were wonderful. Dr. Barlaz was very helpful and patient with lot of my questions regarding every aspect of municipal solid waste generation and degradation process. I was very lucky to have the opportunity to work with Dr. Gabr and Dr. Barlaz. The availability and input provided by Dr. Roy H. Borden and Dr. Shamim Rahman are highly appreciated.
In the Riddick laboratory, the guidance and support provided by David Black and Phil was very helpful during the research period. They helped me a lot performing gas composition, gas volume, and leachate characterization of the generated sample. I am very grateful to David and Phil. The help provided by Dr. David Parish in the soil laboratory is highly appreciated.
I am grateful to all my friends for their support and encouragement. Their faith in me was a great source of inspiration for me. Thank you.
TABLE OF CONTENTS
Page No.
LIST OF TABLES vii
LIST OF FIGURES ix
INTRODUCTION
Background 1
Problem Statement 2
Research Objective 3
Contributions to the State of Art 3
Scope of the Report 4
LITERATURE REVIEW
Gas Phases and Biological Effect 5
Properties of Municipal Solid Waste 7
Physical Properties of Municipal Solid Waste 7
Classification 8
Composition 8
Moisture Content 9
Organic Content 10
Unit Weight 10
Specific Gravity 12
pH 13
Grain Size Distribution 13
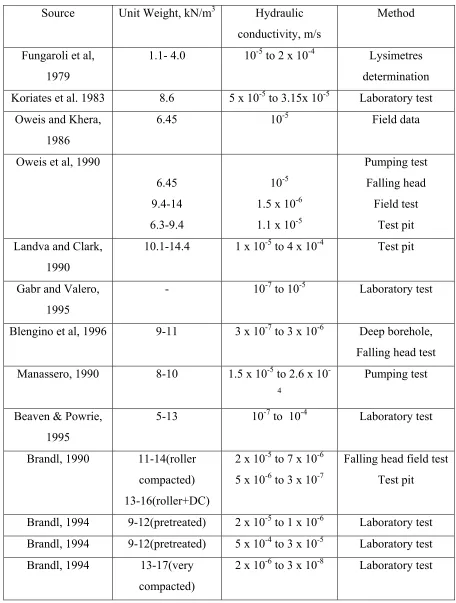
Hydraulic Conductivity 13
Engineering Properties of Municipal Solid Waste 14
Review of Compressibility and Shear Strength 14
Waste Compressibility Parameters 14
Waste Compressibility Model 17
Conventional Compressibility Model 17
Power Creep and Hyperbolic Model 21
Biological Model 24
Shear Strength 29
Shear Strength Parameters of MSW 29
Change in Shear Strength with Decomposition 30
Increase in Strength with Displacement 31
References 33
Tables 41
Figures 48
THE EFFECT OF SHREDDING AND EQUIPMENT SIZE ON MEASURED COMPRESSIBILITY AND STRENGTH PARAMETERS OF MUNICIPAL SOLID WASTE WITH LEACHATE RECIRCULATION
Abstract 61
v
Oedometer Tests 66
Direct Shear Tests 66
Results 67
Refuse Decomposition 67
Compressibility Parameters 67
Shear Strength Parameters 70
Reliability of Data 71
Summary and Conclusions 71
References 73
Tables 76
Figures 80
COMPRESSIBILITY PARAMETERS OF MUNICIPAL SOLID WASTE WITH LEACHATE RECIRCULATION
Abstract 88
Introduction 89
Refuse Biodegradation and Gas Production 91
Experimental Design 93
Preparation of Fresh and Decomposed Refuse 93
Oedometer Tests 94
Results 95
Refuse decomposition 95
Compressibility Parameters 96
Coefficient of Primary Compression 98
Effect of Shredding 99
Summary and Conclusions 99
References 101
Tables 105
Figures 108
PREDICTION OF MUNICIPAL SOLID WASTE LANDFILL SETTLEMENT WITH LEACHATE RECIRCULATION
Abstract 117
Introduction 117 Background 119
Proposed Compressibility Model 121
Compressibility Parameters 124
Experimental Design 124
Model Parameters 125
Model Validation 126
Results of Model Predictions 130
Summary and Conclusions 131
References 133
Tables 136
SHEAR STRENGTH PARAMETERS AND MODEL OF MUNICIPAL SOLID WASTE WITH LEACHATE RECIRCULATION AND DEGRADATION
Abstract 145
Introduction 146
Shear Strength Parameters: Past Work 146
Refuse Biodegradation and Gas Production 148
Experimental Design 149
Preparation of Fresh and Decomposed Refuse 150
Direct Shear Tests 151
Results 151
Refuse Decomposition 151
Shear Strength Parameters of Major Constituents 152
Mobilized Strength Incompatibility 153
Decrease in Strength with Decomposition 153
Increase in Shear Strength with Displacement 155
Non-Linear Failure Envelope 155
Model 156
Model Parameters 157
Samples at Advanced Stage of Decomposition 157
Samples at Initial Decomposition Stage, Fresh Paper and Plastics 158
Calibration of Model 158
Summary and Conclusions 158
References 160
Tables 163
Figures 164
vii
Page No.
LITERATURE REVIEW
1 Composition and methane potential of municipal refuse by
chemical constituents 42
2 MSW- components as weight percentage for different cities 42
3 Typical municipal waste components as fill materials 43
4 Composition of municipal refuse by component 43
5 Comparison of waste characteristics from different countries 44
6 Moisture content in the landfill 44
7 Range of unit weight of uncompacted and compacted refuse
components 45
8 Lightest and heaviest combinations of refuse constituents 46
9 Summary of determination of hydraulic conductivity of domestic
Waste 47
THE EFFECT OF SHREDDING AND EQUIPMENT SIZE ON MEASURED COMPRESSIBILITY AND STRENGTH PARAMETERS OF MUNICIPAL SOLID WASTE WITH LEACHATE RECIRCULATION
1 Tests to evaluate the effect of shredding and equipment size
on measured laboratory parameters 76
2 Description of the Sample Reactors and Their Gas Production
Record 77
3 Compressibility parameters for bioreactor samples for different
equipment size and variable R 78
4 Shear strength and compressibility parameters of bioreactor
samples from repeatability tests 79
COMPRESSIBILITY PARAMETERS OF MUNICIPAL SOLID WASTE WITH LEACHATE RECIRCULATION
2 Description of the sampled reactors and their gas production record 106
3 Compressibility parameters for bioreactor and traditional samples 107
PREDICTION OF MUNICIPAL SOLID WASTE LANDFILL SETTLEMENT WITH LEACHATE RECIRCULATION
1 Description of the sampled reactors and their gas production record 136
2 Compressibility parameters for bioreactor and traditional samples 137
3 Model Parameters for Settlement Prediction 138
SHEAR STRENGTH PARAMETERS AND MODEL OF MUNICIPAL SOLID WASTE WITH LEACHATE RECIRCULATION AND DEGRADATION
1 Number of tests for measuring shear strength parameters 163
2 Description of the sampled reactors and their gas production
ix
Page No.
LITERATURE REVIEW
1 Methane Gas Production as a Function of Time 48
2 Classification System Suggested by Landva and Clark (1990) 49
3 Variation of Moisture Content, Liquid Limit, Plastic Limit
with Depth (Gabr and Valero, 1995) 50
4 Summary of Observed Trend in Leachate Recycle (Barlaz, 1990) 50
5 Grain Size Distribution by Dry and Wet Testing
(Gabr and Valero, 1995) 51
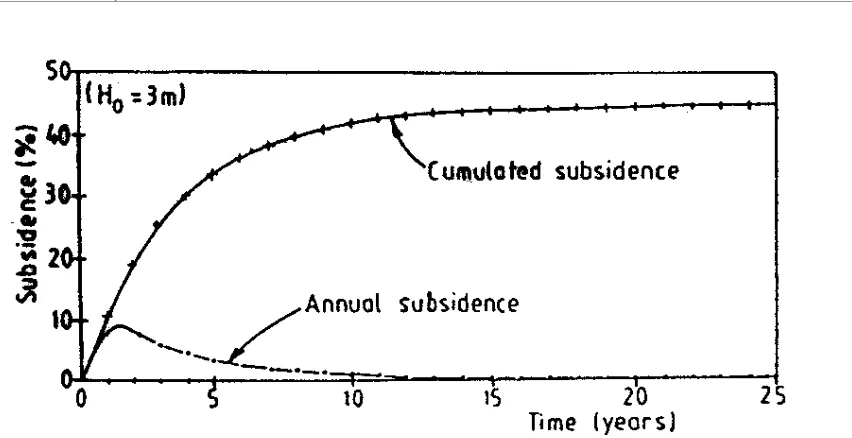
6 Time Progression of the Specific MSW Subsidence in a
Large Diameter Drained Column Test ( Gandolla et al 1995) 51
7 Compressibility Properties as Measured from Conventional and
Unconventional Tests (Gabr and Valero, 1995) 52
8 Relative Height as a Function of a) Applied Pressure b) The Log
of the Applied Pressure (Rao, 1977) 53
9 Rheological Model (Edil et al, 1990) 54
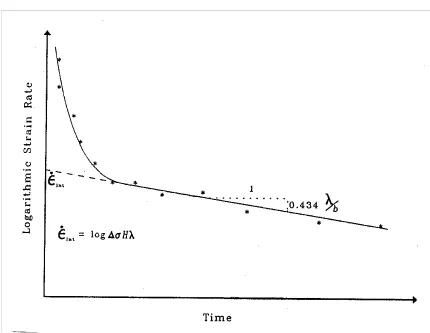
10 Evaluation of Gibson and Lo Parameters (Valero, 1994) 54
11 Settlement Model (Bjarngard & Edgars, 1990) 55
12 Evaluation of Power Creep Parameters 56
13 Evaluation of Rate Process Creep Parameters 57
14 Typical Landfill Bacteria Growth Curve (Valero, 1994) 58
15 Shear Stress vs Shear Displacement Curve (Edincliler et.al., 1996) 59
THE EFFECT OF SHREDDING AND EQUIPMENT SIZE ON MEASURED COMPRESSIBILITY AND STRENGTH PARAMETERS OF MUNICIPAL SOLID WASTE WITH LEACHATE RECIRCULATION
1 Percentage Distribution of Individual Components in MSW for
2 Rate of Methane Production for Bioreactor and Traditional
Samples 81
3 Variation of pH with Time for Bioreactor and Traditional
Samples 81
4a Comparison of waste compressibility using different size
equipment diameter. R, Specimen to equipment size ratio = 0.5 82
4b Comparison of waste compressibility using different size
equipment diameter. R, Specimen to equipment size ratio = 0.5 82
5a Comparison of waste compressibility using different R,
specimen to equipment ratio. Equipment size =200 mm 83
5b Comparison of waste compressibility using different R,
specimen to equipment ratio. Equipment size =200 mm 83
6 Comparison of waste compressibility using different R,
specimen to equipment ratio. Equipment size =300 mm 84
7 Comparison of Shear Strength Parameters using Different R,
Specimen to Equipement Ratio 85
8 Compressive Strain vs Log Pressure for the Shredded
/Un-shredded Samples. Sample B3 is from this study
and the other three samples are from Landva and Clark. 85
9 Repeatability test for compressibility parameters on samples
from the same reactor 86
10 Repeatability test for shear strength parameters on samples
from the same reactor 86
COMPRESSIBILITY PARAMETERS OF MUNICIPAL SOLID WASTE WITH LEACHATE RECIRCULATION
1 Methane production rate for a landfill that receives 286,000 metric ton/yr for 20 years. With reference to eqn. 2, Lo = 170 L/kg, the default value used for NSPS guidelines. The decay rate (k) varies to represent the NSPS default value of 0.05
and enhanced decomposition in a bioreactor (k = 0.15). 108
xi
4 Variation of pH with Time for Bioreactors 110
5 Variation of pH with Time for Traditional Reactors 110
6 1-D Oedometer Test Results for Bioreactor Samples 111
7 1-D Oedometer Test Results for Traditional Samples 111
8 1-D Oedometer Test Results for Bioreactor Samples
(Degradation Inhibited) 112
9 Void Ratio vs Log Pressure for the Bioreactor Samples 113
10 Void Ratio vs Log Pressure for the Traditional Samples 113
11 Compression Index Cc as a Function of (C+H)/L Ratio 114
12 Primary Compression Parameter as a Function of Initial
Void Ratio 115
13 Compressive Strain vs Log Pressure for the Shredded /Un-shredded Samples. Sample B3 is from this study
and the other three samples are from Landva and Clark. 115
PREDICTION OF MUNICIPAL SOLID WASTE LANDFILL SETTLEMENT WITH LEACHATE RECIRCULATION
1 Phase Diagram as a Function of Degradation Phase 139
2 Compressibility Parameters for Bioreactor Samples 140
3 Compressibility Plot for Bioreactor Sample 141
4 Time Factor Determination for the Compressibility Model 141
5 Time Factor t3 for Yolo County Landfill (One Year Waste) 142
6 Comparison of Predicted and Observed Field Settlement for
Bioreactor Landfills 143
SHEAR STRENGTH PARAMETERS AND MODEL OF MUNICIPAL SOLID WASTE WITH LEACHATE RECIRCULATION AND DEGRADATION
1 Methane production rate for a landfill that receives 286,000 metric ton/yr for 20 years. With reference to eqn. 2, Lo = 170 L/kg, the default value used for NSPS guidelines. The decay rate (k) varies to represent the NSPS default value of 0.05
2 Rate of Methane Production for Bioreactors and Traditional
Samples 165 3 Variation of pH with Time for Bioreactors and traditional samples 165
4 Direct Shear Test Data for Plastics 166
5 Direct Shear Test Data for Fresh Paper 166
6 Shear strength parameters for fresh paper and plastics at
10 mm displacement 167
7 Direct Shear Test Data for Degraded Paper, Textile and Organics 167
8 Direct Shear Test Data for Samples at (C+H)/L=0.73 168
9 Direct Shear Test Data for MSW Samples (Bowders, 2002) 168
10 Direct Shear Test Data for Samples at (C+H)/L=1.29 169
11 Shearing Angle for MSW at 10 mm Displacement 169
12 Comparison of Shear Strength Parameters with Existing Results 170
13 Effective Shear Strength Parameters for Municipal Solid Waste 171
14 Repeatability test for shear strength parameters on samples from
the same reactor 172
15 Mobilized Friction Angle with Displacement for Paper and Plastics 172
16 Comparison of mobilized friction angle with existing results 173
17 Non-linear failure envelope for MSW 173
18 Schematic Diagram of Shear Stress – Displacement Behavior of
MSW 174
19 Variation of Model Pararmeters against Normal Stress 175
20 Variation of Model Pararmeters against Normal Stress 176
21 Variation of Model Pararmeters against Normal Stress 177
22 Model Verification using Experimental Results 178
1
INTRODUCTION Background
In 1998, 217 million tons of municipal solid waste (MSW) was generated in the U.S., with approximately 55% of this waste buried in landfills (U. S. EPA, 1999). While portions of this waste are recycled and composted (28%), and converted to energy (17%), landfills will remain a significant aspect of MSW management for the foreseeable future. There have been substantial changes in the design and operation of landfills over the past twenty years. First, state and federal regulations now require that landfills be constructed with low permeability liners and leachate collection systems. These systems are intended to isolate waste from the environment and to insure that contaminated water is collected and treated prior to its release. Furthermore, low permeability covers must now be installed once a landfill has reached its permitted capacity to minimize long-term leachate production.
A second major change occurred concerning the operation of landfills. Though first suggested in the mid 1970s (Pohland, 1975), the concept of operating a landfill as a bioreactor has recently received increased attention (Pacey et al., 1999). A bioreactor landfill is operated to enhance refuse decomposition, gas production, and waste stabilization. A major aspect of bioreactor landfill operation is the recirculation of collected leachate back through the refuse mass. There are several benefits associated with the operation of landfills as bioreactors including (1) more rapid settlement which results in increased effective refuse density and air space, (2) in-situ leachate treatment, (3) increased gas production which can improve the economics of energy recovery, and (4) ultimately the rapid stabilization of a landfill to a more environmentally benign state (Reinhart and Townsend, 1998). As a result of these benefits, there has been a significant increase in the number of landfills that are being operated with leachate recycle and discussions of bioreactor landfills have dominated waste industry conferences for at least the past two years.
2
change with the increasing moisture content. These changes must be considered during the design phase to ensure slope and cover stability. Second, the enhanced rate of waste decomposition can result in an enhanced rate of waste settlement as refuse solids are converted to landfill gas (CH4 and CO2). Third, the shear strength of the waste will vary with time, as the cellulose plus hemicellulose to lignin ratio decreases. Materials such as paper and textiles can initially provide reinforcement action to increase waste slopes stability. However, as these materials degrade, the density of the buried waste increases coupled with the possible reduction in waste shear strength.
Having these changes occur over a relatively short time can affect the design philosophy of landfills as well as operating practices as waste exhibits a highly compressible skeleton depending on its degradation phase. This was demonstrated through a recent comparison of traditional and bioreactor landfills. The comparison was conducted on 0.25 acre, 12 m (40 ft) deep test cells at the Yolo County, CA landfill. After 3 years, settlement was measured to be 2% and 16% in the traditional and bioreactor cells, respectively, (Mehta et al. 2002).
Problem Statement
3 Research Objectives
The overall objective of the research is to develop an understanding of change in refuse compressibility and strength during accelerated waste decomposition in landfills operated as bioreactors. An experimental program was completed to provide data on parameters describing MSW compressibility and strength properties as a function of the state of decomposition and associated changes in waste density and physical characteristics of waste particles. The research links the measured parameters to the physical and biological changes that take place as waste decomposition is accelerated. The research also provides data on the significance of using relatively small equipment and shredded waste relative to field-estimated properties. Specific objectives are to: 1. Investigate the effect of equipment size on measured waste compressibility and shear
strength as degradation takes place and the chemical composition of the waste changes. This includes characterizing the effect of initial physical particle size on waste compressibility and strength parameters.
2. Investigate the dominant mode of waste compressibility at different stages of waste decomposition.
3. Measure and define time-dependent waste compressibility as a function of the
cellulose plus hemicellulose to lignin ratio as well as gas production. Compressibility components due to the overburden weight of the waste, creep, and biodegradation will be characterized.
4. Develop a model of waste settlement that considers the effect of high moisture
content and material a time-dependent property changes on waste compressibility. 5. Develop general behavior patterns and a model describing refuse shear strength as a
function of stress state and gas generation rates taking into account the state of waste decomposition. In addition, define changes in strength properties with degree of decomposition.
Contributions to the State of Art
4
geotechnical properties of waste in bioreactor landfills. The research will have global impact as professional communities’ worldwide search for strategies to extend the life span of existing landfills and operate new ones in the most cost-effective manner possible. As implementation of leachate recycle will lead to in more rapid waste decomposition, and the waste will be considerably wetter than is typical of conventional landfills. The lack of defined testing techniques to measure design properties and the lack of understanding of the mechanics governing compressibility and strength can have grave consequences. The specific contributions of the proposed research are:
1. Development of a fundamental understanding of factors governing refuse
compressibility and strength as waste decomposes, linking gas generation, and chemical composition with geotechnical properties, which will enhance design and operating practices for bioreactor landfills,
2. Development of a simple model of bioreactor waste settlement that provides the
professional community with a tool to study key scenarios during design, operation, and post-closure periods, and
3. Establishment of a model for waste strength as a function of the state of waste
decomposition.
In general, the research result presented herein will advance rational design, operation, and regulation of MSW landfills.
Scope of the Report
5
LITERATURE REVIEW
Gas Phases and Biological Effects
Biodegradability rate is a function of waste composition, waste nutrient level, the presence or absence of buffering agent and operational management practices. As degradation takes place, the solid mass is converted to gas, and void ratio increases, with consequent increase in the compressibility of waste. Accordingly, the settlement component due to biodegradation of solid waste can be related to landfill gas production and enhanced biodegradability with leachate recirculation.
In general, gas production is a function of waste composition. Waste composition can be performed by visual or chemical methods. Cellulose and hemicellulose comprise 45-60% of the dry weight of MSW and are its major biodegradable constituents (Barlaz et al., 1989). The decomposition of these compounds to methane (CH4) and carbon dioxide (CO2) in landfills is well documented and their decomposition contributes to the long-term settlement and stability of landfills (Barlaz et al., 1990; Pohland and Harper, 1986; Bookter and Ham, 1982). The conversion of cellulose and hemicellulose to CH4 and CO2 is carried out by three groups of anaerobic bacteria working together; (1) the hydrolytic and fermentative bacteria, (2) the acetogenic bacteria and (3) the methanogens (Zehnder 1982). This process proceeds efficiently over a relatively narrow pH range around neutral. Table 1 (Barlaz, 1990) shows the chemical composition and methane potential of typical residential municipal solid waste The data in Table 1 indicate that about 60% of the total solid composition are cellulose and hemicellulose. These two constituents are responsible for 90% of methane production in the landfill.
Methane potential was calculated assuming 100% conversion of the degradable constituents to gas i.e. carbon dioxide and methane. For cellulose, conversion reaction was given by Barlaz (1990) as:
Equation (1) (C6 H10 O5)n + n H2 O 3n CH4 + 3 n CO2
Cellulose Monomer Bacteria
6
with the initial phase (phase 0) is taken as the fresh refuse before biological and chemical reactions take place. The four phases of waste were characterized as follows (Barlaz, 1990):
Phase 1: Aerobic Phase – During this phase oxygen present in the voids will be consumed for the CO2 production and this will continue until all the oxygen is consumed. In aerobic phase leachate strength is relatively low and the gas produced are mainly CO2 and N2 with no methane production. The solid with gas potential remains almost same as the fresh refuse (may be 5-10% decomposition of solids) because this phase continues for a short period of time.
Phase 2: Anaerobic Acid Phase – In anaerobic phase carboxylic acids accumulate and pH decreases. The gas produced is still mainly CO2 with little methane production at the end of the phase. As transition to phase 3 takes place, the pH starts to increase and carboxylic acid accumulation goes down with the measurable production of the methane. Cellulose and hemicellulose starts to decompose in this phase. The decomposition of solid is estimated to be between 15-20% based on laboratory data. The acid phase explains the time lag between the refuse burial and the onset of methane production.
Phase 3: Accelerated Methane Production Phase – An increasing rate of methane production, increase in pH, decrease in carboxylic acid concentration, methane concentration of 50-60% marks the onset of this phase. Due to decrease in accumulation
of carboxylic acid, pH increases significantly. Some additional solids decomposition
occurs in this phase but much of the methane is due to depletion of carboxylic acids accumulated in phase 2.
7
Gas production from landfills is typically modeled using a first order decomposition rate such as that in the US EPA Landgem Model (1998).
Equation (2) G = WL0ke-kt
G is annual methane generation for a specific year t (ft3 CH4/yr); W is the mass of waste buried annually (tons/yr)
Lo is the methane potential (ft3 CH4/ton of waste): t is time after initial waste placement (yr);
k is the first order decay rate constant (1/yr)
Methane production rates calculated from equation 2 for traditional and bioreactor landfills are presented in Fig. 1. It should be noted that the decay rate for a biroeactor landfill has not been verified and is used here to represent accelerated decomposition. Properties of MSW
One of the major challenges for the geotechnical engineers is to determine the soil properties with the variation of material content within them. Quantification of engineering properties is extremely important. Environmental geotechnics deal with soil as well as different kind of waste materials contained within them. The reliable knowledge of geotechnical properties of these waste materials is required for the evaluation and prediction of actual behavior of landfill. Determination of Municipal Solid Waste properties is extremely difficult as stated by Manassero et.al (1997) due to the following reasons:
1. It is difficult to obtain samples of relevant size to be representative of in situ condition,
2. There are no generally accepted sampling procedure for waste materials, 3. The properties of waste materials changes drastically with time,
4. The level of training and education of the personnel on site is not high enough to deal with all necessary basic interpretation and understanding of the measurements, and,
5. Municipal solid waste is inherently heterogeneous and variable among different
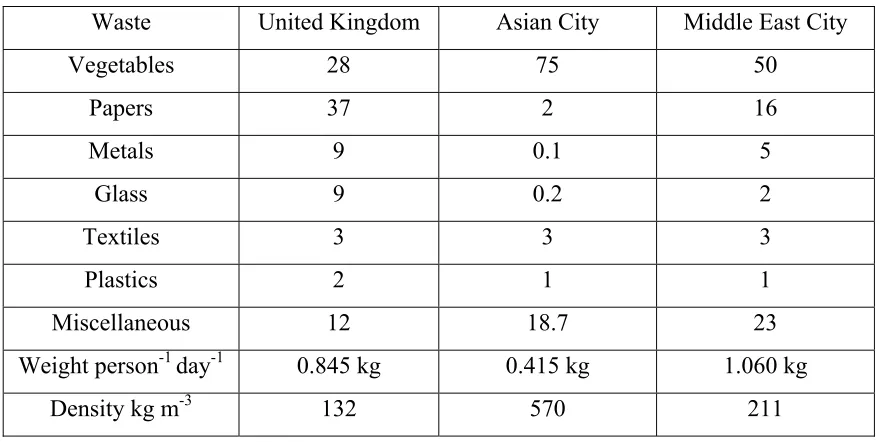
geographical locations, (Table 2)
Physical Properties Municipal Solid Waste
8
Gabr and Valero (1995), Manassero et.al (1997) have determined compressibility, degradability and other characteristics of MSW. In general, waste are commonly divided into two types (ETC8, 1993):
• Soil-like waste defined as granular waste (for example fly ash and bottom ash), for which conventional soil mechanics testing and soil mechanics theory to a large extent is applicable. In case of MSW this models are far from realistic.
• Other waste for which engineering properties should be defined as case by case. Classification
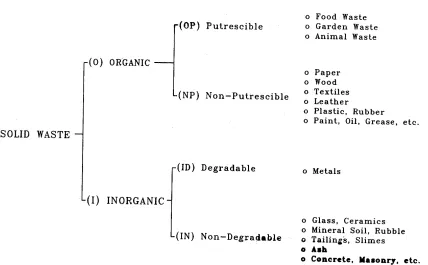
Considering the biodegradability of the waste materials, the classification system suggested by Landva and Clark (1990) are shown in Fig. 2. The materials classified as ON,IN,ID may contain large void-forming object which affect the engineering characteristics of the waste fill. According to the authors, the classification system along with visual inspection should be supplemented with water content, specific gravity, organic content and particle size distribution. Sowers (1968, 1972) discussed the major components of the waste materials, which affect the bearing capacity of soil greatly (Table 3).
Composition
Barlaz (1990) showed the refuse composition on the basis of visual inspection, which is shown in Table 4. It should be noted that at different time of the year, the material in the waste varies. Geographical location also plays a very important role in the composition of the landfill.
9 Moisture Content
For the purposes of characterizing the amount and distribution of liquids within an MSW landfill, mechanisms of moisture retention within the waste mass was classified as follows (Zornberg et. al. 1999):
1. moisture within the waste particles (i.e. within intraparticle voids)
2. moisture between particles (i.e., within interparticle voids), held by capillary stress 3. moisture between particles, retained by low hydraulic conductivity
There is generally limited information regarding the in situ moisture distribution with depth in MSW landfill. The moisture content of the solid waste (w) can be defined as the wet weight (ww) or dry weight (wd) method. The following two equations are used for the calculation of moisture content:
Equation 3(a) ww = (wo – w1 )/ wo or
Equation 3(b) wd = (wo – w1) / w1 where,
wo = initial weight of sample, w1 = weight of sample after drying
Zornberg et. al. (1999) presented the relationship between the volumetric moisture content, θ and gravimetric moisture content ww. In situ volumetric moisture content is the ratio between the volume of liquid and total control volume (θ = Vw/V)
Equation 4 θ = (γd/γw).ww where,
γd = bulk dry unit weight of porous material γw = unit weight of water
ww = gravimetric moisture content
10
significantly increasing trend with the depth. But the volumetric moisture content increases with depth.
Huitric (1981) and Tchobanouglous (1993) reported that for most of the domestic landfill in the USA, the moisture content varies from 15% to 40% depending on the composition of the waste, season of the year, the natural humidity and weather condition particularly rain. The moisture content for different authors is presented in Table 6.
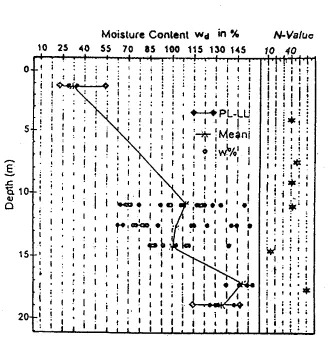
Blight et.al. (1992) showed that water content in the waste at a depth of 3-5m increased by a factor of two between the period of 1988 and 1990. This was due to the unseasonal precipitation. Gabr and Valero (1995) presented results from the test made at the Pioneer Crossing Landfill, Pennsylvania. The authors showed that the water content can be 30% near the surface and as high as 130 % at greater depth closer to the ground water table (Fig 3). The general trend is increase in moisture content and liquid limit with depth as waste decomposition is increased. An opposite is reported by Columbus et.al (1995) from the Ano Liossa Landfill in Greece. Upto 15m depth the water content is more than 60% but decrease with depth to less than 40%.
Organic Contents
The organic content in a landfill affects the compressibility characteristics of the waste. Barlaz (1990) , Landva and Clark (1990), Gifford et.al (1990) showed that the organic content ranges from 5 to 75 % with the major constituents being cellulose and hemicellulose. The organic content, cellulose and hemicellose, is higher at surface level and low at a deeper depth (Barlaz, 1988). The author suggested that due to the complete decomposition at the deeper depth, the cellulose content is lower. Landva and Clark (1990) showed that with increasing organic content, water content also increases and surface area increase due to the breakdown of particles. Wall and Zeiss (1995) reported that with the increasing organic content, the compression index increased. Therefore the organic content in the waste material should play a vital role for the development of compressibility model.
Unit Weight
11
depth from which the sample is taken, amount of water or lechate present etc. Domestic waste usually weights higher than industrial waste. Table 7 (Oweis and Khera, 1998) shows the range of uncompacted and compacted municipal solid waste components. Fassete (1994) reported that unit weights ranged from 3-8 kN/m3 for uncompacted waste, 5-9 kN/m3 for moderately compacted waste and 10-11 kN/m3 for well-compacted waste.
Zornberg et.al. (1999) completed a field investigation for the total unit weight profile of the waste for the San Gabriel Valley in Log Angeles County, California. The
total unit weight ranged from 10 kN/m3 to 15 kN/m3 between 3m and 55m below the
landfill surface. The upper 3m and lower 3m showed higher unit weights of the waste. Landva and Clark (1990) proposed a unit weight determination method, which takes into account the intraparticle and interparticle void, porosity and degree of saturation. In general the average dry unit weight of the constituents is (Landva and Clark, 1990): Equation 5
∑
= n i c i c w w 1 1 . 1 γ γwhere: γi = unit weight of solid portion of an individual constituent i
=
c i
w
w weight of constituent I as a fraction of the total weight w
c of the
constituents
n = number of constituents
When exposed to water, the unit weight of the constituents absorbing water would increase. A new average unit weight of the constituents would be as follows (Landva and Clark, 1990):
Equation 6
∆ +
=
∑
ni i c i c c w w 1 ' . 1 γ γ γ γ
where: ∆γi = increase in unit weight of constituent i
all others are same as equation 5
12
combination given in Table 8. The lightest combination yields 3.6 kN/m3 and the heaviest combination yields 16.4 kN/m3. It was emphasized that these are the average unit weights of the constituents, not the unit weight of the waste aggregate. The unit weight of the waste aggregate could be determined if the porosity and void ration for the same material is known as well as the degree of saturation. Overall range given by the authors is 6.8 to 16.2 kN/m3.
Exact means of determining unit weight in-situ are not known. Landva and Clark used the excavation method. They measured the depth and width of the excavation and weighted the excavated materials. Then they oven-dried the material in pottery klin. In the end, they reported the in situ unit weight to be 6.2 to 16.8 kN/m3. Table 8 shows that, the very high variability in the municipal waste can be expected. This is a complicating factor for determining the influence of self-weight on the settlement of waste.
Gabr and Valero (1995) determined the compacted unit weight and optimum moisture content through compaction tests. The maximum dry weight density was 9.3
kN/m3 and optimum moisture content was 31%. The variation of the measured unit
weight with increasing moisture content was similar to that observed in soil. Full saturation was achieved at approximately 70% water content with a unit weight of 8
kN/m3. A unit weight of 12 kN/m3was estimated from the zero air void curves at
moisture content of 31%. Specific Gravity
13 pH
Barlaz (1990) reports that the pH of the refuse in the anaerobic acid phase remained between 5.7 to 6.2. The microbial population, gas production and chemical constituent’s data are presented in Fig. 4. This, in fact, is four phase characterization of refuse decomposition. Therefore the pH is a very good indication for the decomposition grade.
Grain Size Distribution
Wastes are classified as a) soil like and b) other waste. Soil mechanics concepts are difficult to apply for waste. One of the basic approaches to identify the waste is to run a gradation test (Jesserberg, 1994) for the various portions of the material. The interesting observation is that the tendency to increase in fine grain materials with aging. Two-particle size determinations of waste cuttings from 14.5m to 19.2m depth were performed by Gabr and Valero (1995). For the shallow depth, the specimens were oven dried and mechanical sieve analysis was conducted. For 19m depth, the specimens were washed through each sieve used in the test. Hydrometer analyses were conducted for materials passing through the No. 200 sieve. Fig. 5 shows the results of both the mechanical and hydrometer test results. Specimen from shallower depth indicated coarser particle distribution. The difference in grain distribution may be due to the higher degree of decomposition of the deeper sample, the conglomeration of the particles in dry sample as well as the difference in dry and wet sieve method. Grain size distribution is very helpful for the classification of waste. According to Landva and Clark (1990) at least a partial grain size distribution can also be helpful.
Hydraulic Conductivity of waste
14 Engineering Properties of Municipal Solid Waste
The determination of the engineering properties of waste is a difficult task. For fine-grained soil like waste, mechanical properties like shear strength, compressibility, swelling and shrinkage behavior can be determined by using the conventional geotechnical test methods. But for the mixed and coarse-grained waste the conventional method is not appropriate for determination of mechanical properties. Most of the waste mechanical properties and compressibility are determined from estimation, back calculation or laboratory/ field-testing.
Review of Compressibility and Shear Strength
There is a dearth of data on the physicochemical and biological effects of leachate recirculation on the compressibility and strength properties of MSW. As waste decomposition is enhanced through leachate recirculation, there are gaps in the literature regarding (1) changes in waste properties with time and stress level, (2) methods for evaluation of the magnitude and rate of settlement as a function of moisture content, (3) the impact of leachate recycle on waste strength and above-grade slope stability, and (4) the configuration of stable and cost-effective "interim" and final cover designs to meet the objective of operating and then closing a bioreactor landfill.
Waste Compressibility Parameters
The compressibility properties of waste are of special importance when designing the interim and final closure covers for solid waste landfills. The variability of the waste properties has been highlighted in the previous sections and such variability is expected to affect cover stability as decomposition takes place. Factors affecting changes in waste compressibility include physiochemical and biological changes and decomposition of the waste, distortion and reorientation of the refuse, erosion of the fine material into large void due to the nature of the waste and long term creep process.
15
degradation, as current regulations call for entombing and fossilizing the waste material by minimizing moisture infiltration. Unlike soil, the landfill experiences differential settlement causing a lot off damage in the structures and developments over the landfill (Sowers, 1968 & 1972, Edil et.al 1990, Ling H.I, 1999). Dodt et.al, (1987) measured differential settlement in the order of 1 inch vertically for every 10 feet horizontally during vertical expansion of an existing landfill. Sowers (1968) explains large, relatively hard inclusion such as appliances or boulders are responsible for such differential settlement. Sowers (1972) showed that waste settlement was similar to that of peat with large initial consolidation and substantial secondary compression. Rao (1977) indicated that a settlement time curve from waste specimens might vary from those for typical clay soils but is similar to those from organic soils and peat.
Since waste exhibit a highly compressible skeleton, primary and secondary consolidation occur simultaneously. It is difficult to identify the magnitude of primary settlement as well as time taken for the settlement. The primary settlement of waste may take place shortly after fill placement, within a few months. The determination of secondary settlement is a major concern because a large reduction of volume occurs due to waste decomposition through biological and chemical process (Ling et.al.,1999). The decomposition process is complicated by many factors such as the type of materials, moisture content, temperature and so forth. For aerobic moist conditions above the water table, secondary compression is three times as great as for anaerobic conditions below a stagnant water table (Sowers, 1968).
Based on the mechanism proposed by Sowers, the factors affecting the magnitude of settlement are many and are influenced by each other (Edil et.al, 1990). They include: 1. initial domestic waste density or void ratio;
2. content of the decomposable materials in the waste; 3. fill height;
4. stress history (treatment during and after placement); 5. leachate level and fluctuation;
6. environmental factors (such as moisture content, temperature and gases present to
16
For analysis of load-induced settlement, methods derived from soil mechanics
concepts include using elastic approaches, or e-log p from consolidation testing method (Sowers, 1973). Landva and Clark (1990), Gabr and Valero (1995) have conducted some of the conventional and unconventional test and the results are plotted in Figure 7. These results show the very high compressibility of waste. Typical values of Compression Ratio, CR, is in the range of 0.2 to 0.5 depending on the stress level whereas rate of compression index, Cαe was found to be in the range of 0.2% to 3%. It also appeared that Cαe increased with increasing organic content. Gabr and Valero (1995) conducted small scale compression test (conventional equipment) on old waste samples (15 to 30 years old). The CR was found to be 0.15 to 0.22 and Cαe ranged between 0.8 to 0.9%. The compression index were between 0.4 and 0.8 for a void ratio of 1.0 to 3.0, the secondary compression index ranged from 0.03 to 0.09 and appeared less dependent on void ratio and more dependent on microbial activity conditions.
Coumoulous (1999) evaluated secondary settlement data from 13 landfill case studies and showed a range of the secondary compression coefficient from 0.02-0.07. Sharma (1999) also studied old landfills (10-15 years old) and found secondary compression coefficients to be between 0.02 and 0.07. In comparison, El Fadel and Al-Rashed (1998) analyzed 1576 days of settlement data from the Mountain View landfill test cell that was operated with leachate recycle and computed a secondary compression coefficient of 0.1-0.32. These values are five times the values obtained by Sharma (1999) and Coumoulous (1999).
17 Waste Compressibility Model
Most settlement models applied to solid waste were developed for inorganic soils or peat and were not necessarily developed considering leachate recirculation. The models used for refuse were typically developed using one of the following approaches: 1) Based on traditional methods for clay settlement using consolidation data,
2) based on rheological simulation in which the soil, waste skeleton, was replaced by Hookean spring and dashpots,
3) based on correlation with field and laboratory test data and application of rate process theory or
4) A combination of the above three approaches.
These approaches provide a convenient, familiar, and relatively simple methods to evaluate and model waste compressibility. However, in the case of bioreactor landfills, time-dependent settlement will be due to compressibility of the waste matrix as manifested by changes in waste stiffness with decomposition as well as waste density. Waste settlement will include creep and biological components due to the heterogeneous nature of waste particles, and accelerated cellulose and hemicellulose biodegradation, respectively, as leachate is recycled. On a conceptual level, the compressibility of waste can be viewed as due to mechanistic (layer weights), creep (rearrangement of waste particles as physiochemical changes takes place) and biological (increase in void space and compressibility as solid-to-gas conversion takes place).
Conventional Compressibility Model
The most frequently applied model is Sowers (1968) model. The model is simplified one-dimensional compressibility model with an empirical term to account for time dependent secondary compression effects. The equation, which represents the model, is as follows:
Equation 8
+ Η + +∆ + = ∆Η p o o o o c t t e e H C log . 1 log . 1 . ' ' α σ σ σ
Where: ∆H = vertical settlement
Cc = mpression index
18 eo = initial void ratio
σ/o = initial effective vertical stress acting at the middle of the layer ∆σ = change in effective vertical stress
α = secondary compression factor (gradient of void ratio log time
curve)
tp = time at the end of primary consolidation t = any time of interest > tp
Either laboratory consolidation tests or field settlement data can be used for the construction of void ratio versus log pressure curve, and void ration versus log time curve, on order to estimate Cc and α. As with soils, the compression index is the average slope of the void ratio versus log pressure curve, in the applicable stress range, while the slope of void ratio versus logarithmic time beyond 100 percent “primary consolidation” defines the secondary compression factor. Alternatively Sowers (1973) showed that Cc and α are related to the initial void ratio, eo in the following manner:
Equation 9 Cc = p.eo Equation 10 α = s. eo
Where: p = 0.15 for fills with low organic content, = 0.55 for fills with high organic content s = 0.03 for conditions unfavorable to dacay = 0.09 for conditions favorable to decay,
all the terms are as equation 8
Therefore, if organic content, conditions for decomposition, and initial void ratio are known, the Cc and α can be determined. According to Sowers (1973) the laboratory consolidation test data can not be used for the waste due to heterogeneity and large particle size. The author suggested that field test data should be used for the model parameters. Furthermore the initial void ratio determination for the waste is also a very difficult task.
19
biodegradability of the waste. According to the authors the conventional void ratio log pressure curve cannot be used for the waste as there is no way of computing reliable void ratio. To estimate the total settlement, Rao (1977) used the following equation:
Equation 11 (a)
i o i o H H H H H S ∆
= (considering Fig. 8.a)
where: S = settlement
Ho = existing thickness of refuse
Ho/Hi = relative height corresponding to the existing overburden pressure σo ∆H/Hi = change in relative height corresponding to the stress increment ∆σ
Equation 11 (b)
o o i o s o H H C H S σ σ σ +∆
= log (considering Fig. 8.b)
The rheological model proposed by Gibson and Lo (1961) for the long term secondary compression of soils was found to be useful in predicting settlements of peat Representation of the rheological model is shown in Fig. 9 (Edil et.al, 1990) and it represents the one-dimensional compression of refuse fill. The applied stress may be self-weight or load imposed on the landfill. When a stress increment ∆σ, acts on the model, Hookean spring, with a spring constant a, compress instantaneously. This is same as primary compression. The compression of lower spring with a constant b parallel to dashpot (viscosity of λ/b) is retarded by Newtonian (linear) dashpot. This is analogous to the continuous process of secondary compression. After a long time the load will be taken by the two springs. The equation in this case is as follows (Gibson and Lo, 1961):
Equation 12 S(t)= H∈(t)=H.∆σ
{
a+b(1−exp[
−(λ/b)t]
}
Where:
S = settlement
H = initial height of refuse
20
a = primary compressibility parameter b = secondary compressibility parameter λ/b = rate of secondary compression t = time since the load application
To evaluate the parameters a, b and λ/b, Lo et.al (1976) show that the equation can be expressed as follows also:
Equation 13 t
b t log( . ) 0.434. .
log = ∆σ λ − λ
∂ ∈ ∂
Where: ∂ε/∂t = strain rate in secondary range, other terms are as same as equation 12
A plot of logarithmic strain rate versus time (Fig. 10) produces the straight line described by the equation after dissipation of pore water pressure. The parameters b and λ can be obtained from the slope and intercept and a may be evaluated by substituting a known strain at a particular time into equation 12.
This model also assumes classical Terzaghi’s assumptions of consolidation and suffers some theoretical inadequacies. Additionally parameter variation analysis performed by Lo showed a value to be mildly nonlinear with time and λ to be strongly non-linear with time. Edit et.al (1990) pointed out that as average strain rate increases, so does the rate of secondary compression. The same was also observed for peat soil and indicates that the dashpot is essentially non-linear in the model. The implication is that the parameters obtained from a given field test on refuse should be extrapolated with much care for settlement prediction at another fill with different applied stress.
Bjarngard and Edgers (1990) and Fassette et.al (1994) compiled available MSW landfill data, evaluated the data, and proposed two models for the prediction of settlements in landfills. The model proposed by Bjarngard and Edgers (1990) is presented below (Fig.11): Equation 14 2 3 2 1 2
1log log
log t t C t t C P p P CR o
o +∆ + α + α
21 Where:
∆H = settlement
H = initial thickness of waste layer
∆H/H = vertical strain (normalized settlement) Po = Initial average vertical effective stress
∆P = average induced vertical stress increment
t1 = time (days) for completion of “initial” compression as in Fig. 11 t2 = time (days) for completion of “intermediate”compression as in Fig. 11 t3 = period of time (days) for prediction of settlement as in Fig. 11
CR = compression ratio
Cα1 = intermediate secondary compression index
Cα2 = long term secondary compression index
Fassett et.al (1994) model is same as the previous model except the two secondary compression indices for intermediate and long term are combined into one
denoted as Cα. Equation 15
i f o o t t C P p P
CRlog +∆ + αlog =
Η ∆Η
Where: tf = t3 & ti = t1 as in equation 14
Cα2= Cα2 = Cα as in equation 14 , all other terms are same as equation 14
Bjarngard indicated that short term settlement versus vertical stress generally exhibits a linear behavior. On the other hand, Fassett et al (1994) indicated that strain versus log vertical stress is often non-linear. These models are expressed in terms of effective stress. Since the waste mass is generally in moist state, the use of total stress for the prediction of settlement would be appropriate as well. The initial vertical stress is extremely important for the prediction of settlement and therefore site specific unit weight data are required rather than being assumed.
Power Creep and Hyperbolic Model
22
Equation 16
n r t t m H t H t S ∆ = ∈ = . . . . ) ( σ
where: S = settlement
H = initial height of refuse ∆σ = compressive stress m = reference compressibility n = rate of compression t = elapsed time since loading
tr = reference unit time to make time dimensionless
The logarithmic strain versus logarithmic time method is used for the evaluation of m and n. the logarithmic strain versus logarithmic time graph (Fig. 12 & 13) is plotted using the laboratory or field test data. The slope of the line is used as n value whereas the intercept is the value for m. The reference compressibility m shows no discernible pattern with respect to placement condition of the refuse. Rate of compression n indicates some pattern with respect to age and placement conditions of the refuse (Edil et.al, 1990). These model parameters lack physical meaning.
Ling et. al. (1998) combined the logarithmic function and power function and proposed new empirical relationship for the settlement prediction of waste. A hyperbolic model is also proposed as an improved tool for the time-settlement relationships and to predict the final settlement as well. Logarithmic function (Yen and Scanlon, 1975) is used to determine the settlement using the following equation:
Equation 17 (a) m n t
dt dS log . − = = ρ
where m and n = positive empirical constants.
t = time
ρ = settlement rate
This is known as ρ-log t, or logarithmic function.
Power function has been used by Edil et al (1990) for the settlement prediction with time as follows:
Equation 17(b) q
23
Where p, q = positive empirical constants. ρ = the settlement rate at unit time
Since the logarithmic function and power function express strain rate-time relationship, they can be integrated with respect to time to predict settlement.
Equation 17(c) S =
[
m−n(
logt−1)
]
tEquation 17(d) t q
q p S − − = 1 1
The settlement may be expressed directly using log t and power functions as follows:
Equation 18 S =m/ +n/.logt
Equation 19 S = p/.tq/
Ling et.al. (1998) model gives negative settlement for very large times. This indicates that the landfill undergoes expansion which is physically impossible. The logarithmic function does not allow a maximum time to be defined such that the final settlement will be determined when settlement rate approaches to zero. A solution does not exist for settlement rate equal to zero.
Hyperbolic function (Ling et. al. 1998) has been used successfully for the settlement of embankment on soft clay. For the prediction of MSW settlement, the following expression was used:
Equation 20 ult o S t t S + = ρ 1
Where t = difference between time of interest and time of starting measurement = ti – to
S = difference between settlement at time ti and that measured at time to = Si – So
ρo = initial rate of settlement (at t = to) Sult = ultimate settlement (i.e. at t = α )
24
model (Ling et.al., 1998) gave better prediction of long term settlement over log t and power functions.
Biological Model
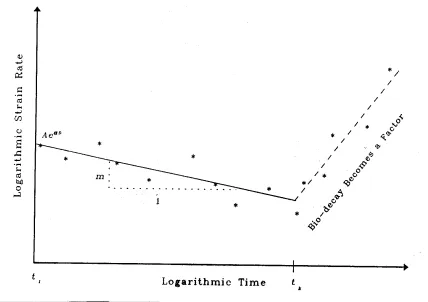
By considering approximately 25 case studies, Edgars et al (1992) developed a refuse settlement model which takes into consideration the microbiological process within the landfill. Edgars et.al (1992) observed that several fills which were initially modeled successfully by rate process had experienced a marked increase in compressive strain rate after extended period, some of which did not experience direct exposure to oxygen as in Sowers (1972) case. According to them, this increase was due to rapid biological decomposition corresponding to the exponential growth phase of microorganism in the fill. They also suggested that the long time lag phase, years in some cases, is a result mass transfer limitations and mixed microbial populations within the landfill. Based on these observations, Edgars et al proposed modeling landfill settlement as a creep rate process until a critical time where biological decay must be accounted for. Equation 21a and 21b express compression due to structural creep as linear and non linear functions of logarithmic time, respectively. These equations were originally proposed by Singh and Mitchell (1968) to model creep deformation of soil. Singh and Mitchel suggested testing two identical samples at different creep stress levels to evaluate A and α. However, Edgars et al (1992) indicated that all parameter may be evaluated from a single set of time-settlement data.
Equation 21a
+ ∈=∈ 1 1
1 . . .ln
t t t e
A αD ; when m=1
Equation 21b . .
{
ln 1}
1
. 1
1 1
1 −
− + ∈=∈ −m D t t t m e A α
; when m=1
Where: ε = compressive vertical strain t = elapsed time
ε1=known strain at time t1 D =stress level
25
m= creep parameter controlling strain rate decrease with time
To determine the parameters, a plot of logarithmic of strain rates versus logarithmic of time, as shown in Fig. 13 must be constructed. The slope of best fit line through the data points where strain rate is decreasing yields m while the intercept at t1
represents the quantity A.eαD.
Equation 22 predicts compression due to biological decay. Edgars et al based this on the growth cycle of the microbial population within a landfill as in Fig 14.
Equation 22 ∈ =
[
(t−tk) −1]
bio Beβ
Where: εbio = compressive vertical strain due to biological decomposition β = average landfill microorganism growth rate
B = scale factor relating field settlement to growth kinetics t = elapsed time
tk = critical time at which strain rate increase due to biological activity
The equation was developed on the basis of the following assumptions:effects of decomposition are small until some critical time , tk, (possibly corresponding to the lag phase), when strain rate increases, (ii) decomposition and associated gas production is characterized by exponential bacterial growth and (iii) strain due to decomposition is directly proportional to the number of bacteria present. This is the model, which considers the biological process into landfill settlement calculation. But there is no accurate method available to predict tk.
26
Six cells were tested and monitored during the whole process of the test. Three of them were enhanced cells while three others were inactive cells. All cells were monitored for gas composition and volume, leachate pH and total organic carbon, and refuse settlement. In order to calculate rate constants, first order kinetics were used on carbon mass balance data.
Wall and Zeiss (1995) observed that during the first period of secondary settlement biodegradation has very little effect on the secondary settlement rates. To determine whether an effect of solids removal on settlement is probable, the percentage of carbon decomposed during the test period (250 days) and estimated five year predictions were compared to present and future secondary settlement and rates. The total mass of solids decomposed during the test period were 1% whereas the secondary settlement at the same period accounts for a deformation of 4%. That means decomposition does not have a significant effect on the rate of secondary settlement. At this time, either bridging between the refuse particles or creation of a skeleton of large objects or both may mask the contribution of decomposition to the settlement rate. Five years future predictions can be derived from settlement and biodegradation model. By using the first order model and the measured rate constants, the organic carbon mass loss in five years will be equal to:
Equation 23 kt
o o t
o C C C e
C .
. −
− = −
Where: Co = initial carbon mass Ct = carbon mass at time t k = constant
The lost organic carbon mass indicates 5-8% of the total refuse. From their results, it is evident that settlement occurs at a faster rate than the decomposition initially then slows considerably. This predicts that decomposition will become increasingly significant over time.
27
tool for the determination of that lag period. Wall and Zeiss (1995) concluded that enhancing initial settlement with the addition of water can significantly increased the capacity of landfill. The research is limited over a short period and extrapolated results need to be verified over the period to link between the secondary compression and refuse decomposition.
Park and Lee (1997) presents a mathematical model that considers the decomposition process of biodegradable refuse from a geotechnical point of view and suggested the overall compressibility behavior of refuse including decomposition effect. The theoretical compressibility curve, which takes into account most of the characteristics of refuse deformation, proposed by Grisolia and Napoleoni (1995) were considered for the settlement analysis. This curve is divided into five stages: Phase I : the initial settlement stage, which shows large reduction in the macro porosity by arrangement of deformable materials, Phase II : the initial residual settlement stage; Phase III : the mechanical secondary settlement stage which may be caused by long term slipagges, reorientation of materials and deformation induced by decomposition of biodegradable elements; Phase IV : the decomposition completion stage, in which settlement due to decomposition has mostly completed; Phase V : the residual settlement stage, which is characterized by long term slippage’s and reorientation of residual materials. Therefore the long term secondary settlement is due to the mechanical secondary compression and decomposition.
This can be expressed as:
Equation 24a ∆ε (t)long-term = ∆ε (t)mec + ∆ε (t)dec
Mechanical secondary compression (∆ε mec) occurs due to long term slippages, reorientation of the particles and delayed compression of some refuse materials. This can be expressed as:
Equation 24b ∆∈(t)mec =CαLog
[
(
t+∆t)
/t]
Where Cα : the rate of secondary compression
28
Equation 25 ε (t) dec = f (ε tot-dec, k) = ε tot-dec (1-e-kt) where: k : strain rate due to decomposition
ε(0) dec = ε tot-dec ,total compression due to decomposition of biodegradable refuse.
The authors has applied this model for the aged refuse landfill and found that decomposition induced a considerable amount of compression in the overall settlement behavior. It was also found that the biological strain would be completed within 3-5 years. These results are contradicting the finding of Edgars et al (1992) and Wall and Zeiss (1995), who found that decomposition becomes significant after a lag time.
In summary, no models are available in literature which considers the effect of leachate recycling on compressibility of solid waste. Bjangard and Edgers (1990) compiled data from traditional landfills and proposed a model for the prediction of settlement. Fassett et al. (1994) later presented an extension of the 1990 model with the
two secondary compression indices (Cα1 and Cα2) for intermediate and long-term
29
with leachate recycle operation. With the exception of Mountain View Landfill data and the recently-started Yolo County test, past work reported in the literature did not document solids composition and gas generation potential in conjunction with compressibility or strength parameters. On the other hand, once an understanding of how compressibility parameters change with decomposition is achieved, a simple model can be developed to provide engineers and regulators with a needed analytical tool to estimate available air space, provide estimates of deformation associated with future vertical expansions/land use of landfills, and assist with the design of interim and final cover systems. Such a model should account for changes in material characteristics as a function of the waste biodegradation rate.
Shear Strength
In addition to settlement, the evaluation of waste shear strength is important for the design of waste slopes, covers, vertical expansions and future land use, as well as assessing the seismic stability of landfills. Traditionally, failures of waste slopes are not highly publicized, or published, although they are known to occur. One of few of cases reported in literature was by Stark et al (2000) in which they indicated that strain incompatibility and progressive failure can occur between MSW and underlying materials and lead to a reduction in mobilized shear strength and failure. A number of studies have been conducted on the shear strength of MSW, e.g. Landva and Clark (1986); Siegel et al. (1990); Singh and Murphy (1990); Gabr and Valero (1995); and Edincliler et al. (1996).
Shear Strength Parameters of MSW
Landva and Clark (1986) determined drained shear strength parameters for old refuse samples. They measured friction angles ranging from 38o to 42o and cohesion's (c) ranging from 16 to 19 kPa.
Landva and Clark (1986) also conducted direct shear test on fresh shredded refuse containing a large amount of plastic sheet waste. They found the friction angle of 24 o and cohesion of 23 kPa. The low friction angle was attributed to sliding between plastic sheets.