18th International Conference on Structural Mechanics in Reactor Technology (SMiRT 18) Beijing, China, August 7-12, 2005 SMiRT18-C02-4
IMPROVED FUEL ASSEMBLY DYNAMIC MODEL
Sudhir J. Shah
*
Ben Brenneman
Framatome
ANP
Framatome
ANP
P.O.
Box
10935
P.O.
Box
10935
Lynchburg, VA-24506-0935, USA
Lynchburg,
VA-24506-0935,
USA
(434) 832-2306 phone
(434) 832-2629 fax
[email protected]
John
H.
Strumpell
Gary
T.
Williams
Framatome
ANP
Framatome
ANP
P.O.
Box
10935
P.O.
Box
10935
Lynchburg, VA-24506-0935, USA
Lynchburg,
VA-24506-0935,
USA
ABSTRACT
Currently in the Pressurized Water Reactor (PWR) core seismic analysis, testing methods are used to determine in-grid stiffness and through-grid stiffness. The in-grid stiffness is determined by fuel assembly lateral impact tests in air at room temperature. The in-grid stiffness is the effective horizontal stiffness between all of the fuel rods at a grid elevation and a center point of the grid. The through-grid stiffness is determined in air at hot conditions by dynamic compression tests. The through-grid is the horizontal stiffness from side to side that comes from compression between its two opposite faces.
This paper presents linear and nonlinear fuel assembly mechanistic dynamic models which would allow for the analytical prediction of the fuel assembly lateral impact loads from the knowledge of grid geometric properties. These models would permit detailed studies of interaction between fuel assembly grids impacting a rigid wall and the effects of changes in grid characteristics, thereby eliminating the requirements for expensive prototype fuel assembly lateral impact testing. Currently, testing methods are used to determine in-grid stiffness of spacer grids.
The main advantage of the successful development of such a fuel assembly model is that it is straight-forward and “physical”. For example, changing the developed fuel assembly model from a beginning of life (BOL) condition to an end of life (EOL) condition, may be performed easily just by removing the preload. The preload is modeled by means of modeling the fuel rod-to-spacer grid interference. “Tight” (representative of the BOL condition) and “relaxed” (representative of the EOL condition) prototype fuel assemblies were tested to account for the grid preload effect. A comparison of the test and analytical impact forces for the tight and relaxed prototype fuel assemblies is provided to confirm model impact behavior for these cases.
KEY WORDS:
3-BeamFuel Assembly Model, In-Grid Stiffness, Fuel Assembly Lateral Impact Test1. INTRODUCTION
since it uses a composite beam approach. Hence, the one beam per assembly model cannot predict lateral impact test data. Normally in this model, the in-grid stiffness value used as input into linear and nonlinear finite-element core models is derived from fuel assembly lateral impact test data.
A nonlinear one-beam model was presented by Shah and Brenneman (2002) to approximate free vibration response for large amplitudes fuel assembly motion.
The fuel assembly is modeled in a novel way as 3 beams per assembly. It employs the obvious technique of grouping items with common properties and boundary conditions on the assumption that they would exhibit common behaviors. The governing factor in the fuel assembly in-grid stiffness characteristics is the fuel rod-to-spacer grid interface. Thus, modeling of the hard stops and soft stops appropriately allows for the determination of the in-grid stiffness by analytically plucking the fuel assembly. If this 3-beam (per assembly) model is implemented in the core model used in the fuel assembly seismic and LOCA analyses, it would remove the requirement of modeling the in-grid stiffness.
The objective of this paper is to compare various fuel assembly lateral impact test data with the prediction of the 3-beam linear model and the 3-beam nonlinear model. The forces required to impose the initial displacement calculated by the linear and nonlinear models are also compared to the test results.
2. MODEL
DESCRIPTION
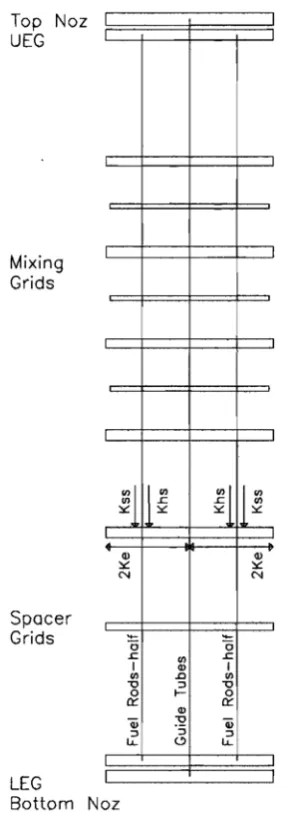
A finite-element linear model of the fuel assembly is created by 3 beams shown in Figure 1. The first and the third beam each represent half of the number of the total fuel rods. The center vertical beam models all of the guide tubes and the instrument tube in the actual structure, which forms the “cage” of the fuel assembly. There are 10 elements in each span of each beam. The rotational springs are placed at each grid location. This stiffening effect is partially from the intermittent ties between the rods supplied by each grid. The end rotations of the guide tube model are fixed to represent the presence of the nozzles. The tested prototype fuel assembly had the mid-span mixing grids which as shown in Figure 1 are incorporated into the model. The fuel assembly 3-beam linear model is benchmarked to test frequencies by using the nominal area and moment of inertia of the cladding and adjusting only the rotational stiffnesses. The nonlinear model is created by replacing the rotational springs of the linear model with rotational sliders at each grid elevation. The rotational slider stiffness used in the nonlinear model is the same as the total rotational stiffness used in the linear model. The slip moment is determined by iteration to get the best match between computed and test pluck forces. The assigned slip moment is not changed for the different test amplitudes. The nonlinear model also considered the lateral sliders for the orthogonal rod friction supports.
The fuel rods in the fuel assembly are gripped at the grid locations by hard stops and soft stops, which serve to position the fuel rods and provide a restoring moment that opposes rotation. The hard stops and soft stops in the plane of the bending are modeled by two discrete gap-springs, one spring with the stiffness of the soft stop and the second spring with the stiffness of the hard stop. The soft-stop spring has some initial interference that causes a preload on the fuel rod. The mixing grid rod supports with small gaps (i.e. no preload) on each side of the fuel rods are incorporated into the model.
Horizontal springs representing the through-grid are incorporated in this model to allow for the grid impact. The through-grid springs are attached to the “cage” beam model. The gaps in these horizontal springs are artificially changed to represent each tested case reported below. For example, for the tests where only Spacer Grid No. 3 and Spacer Grid No. 4 impact the stiff walls, the gap in the spring at Midspan Mixing Grid No. 1 is made very large so that it does not impact.
3.
PLUCK FORCES AND IMPACT LOADS STUDY
measured. The pull forces required to impose the initial deflections on the fuel assembly were also measured. These values are matched with numerically calculated values.
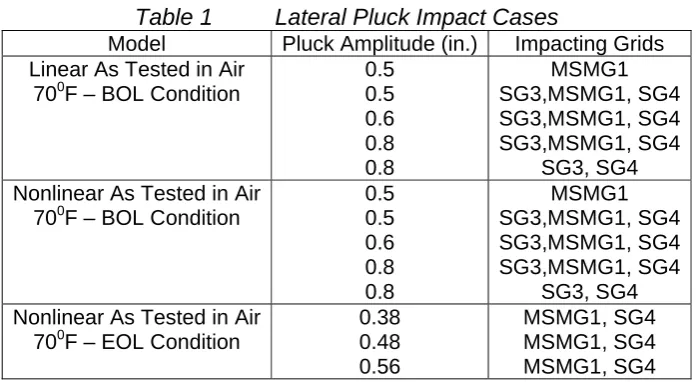
Table 1 lists the cases that are examined in this paper.
An effective fuel assembly damping of 6% as obtained from the test was used in the analysis. The natural frequency of 2.7 HZ to 3.0 HZ was obtained from the nonlinear model for the BOL prototype fuel assembly and 2.2 to 2.5 HZ was obtained from the nonlinear model for the EOL prototype fuel assembly. These values compared well with the test data.
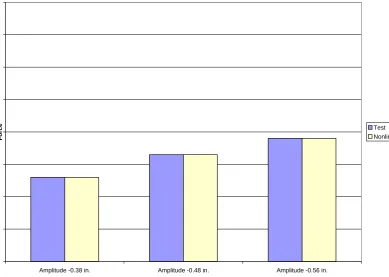
The forces required to impose initial deflections of the fuel assembly for the linear and nonlinear models for the BOL condition are plotted in Figure 2. The pull forces for the linear model at small deflections are roughly 5 to 7% lower at 0.5 in. and 0.6 in. deflections and 15% larger at 0.8 in. deflection. For the nonlinear model, the pull forces are about equal to the test values. The forces required to impose the initial deflections of the fuel assembly for the nonlinear model for the EOL condition are plotted in Figure 3. These results match very well.
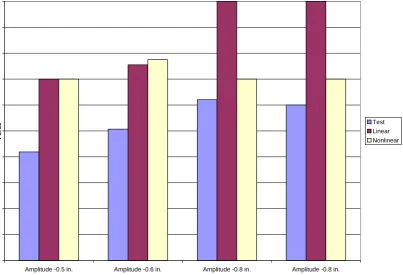
Figures 4, 5 and 6 show the test and numerical impact forces obtained using the linear and nonlinear models for the BOL condition for Spacer Grid No. 3, Spacer Grid No. 4 and Midspan Mixing Grid No.1 respectively. As the plots show, the agreement between the test data and the model predictions is within 10% at 0.5 in. and 0.6 in. deflections for both the linear and nonlinear models for Spacer Grid No. 3. The linear analytical model overpredicts the impact load by 30% while the nonlinear model overpredicts the impact load by 9% at 0.8 in. deflection for Spacer Grid No. 3. For Spacer Grid No. 4 and Midspan Mixing Grid No.1, the linear and nonlinear models seem to over predict the impact loads in some cases.
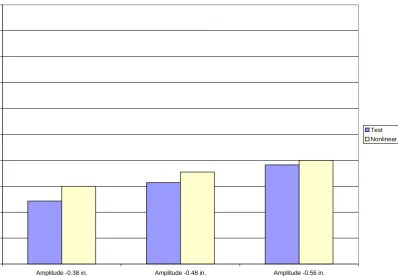
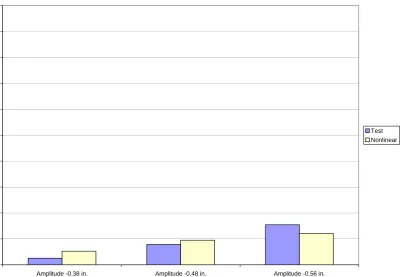
Figures 7 and 8 shows the test and numerical impact forces obtained using the nonlinear model for the EOL condition for Spacer Grid No. 4 and Midspan Mixing Grid No. 1 respectively. It is evident that good agreement is achieved between the numerical impact forces and the test results for the EOL condition, considering the variability of the test conditions. This means that the analytical model is correctly analyzing the grid preload effect.
Because of the symmetry, Spacer Grid No. 3 and Spacer Grid No. 4 should carry about the same impact loads, which the linear and nonlinear models seem to predict. Also, impact loads are larger than those from the tests for the larger deflections from the linear model. Both the linear and nonlinear models seem to be sensitive to the gaps between the grid and the stationary wall on which the grid is allowed to impact. In addition, it is likely that there are initial residual forces in the test that are not in the model.
4. CONCLUSION
The fuel assembly is modeled in a novel way with 3 beams, and hard-stop and soft-stop characteristics directly for the determination of dynamic assembly behavior. The pluck forces required to impose the initial deflections of the fuel assembly plotted in Figures 2 and 3 for the BOL and EOL prototypes respectively show the following:
● linear (BOL only) is slightly low at low amplitudes and high at high amplitudes.
● nonlinear is practically perfect for both BOL and EOL conditions and all amplitudes.
A comparison of the fuel assembly lateral impact test data with the predictions of the model is shown to demonstrate the power of the model. Plots of test, linear and nonlinear impact forces shown in Figure 4 for the BOL prototype show that at Spacer Grid No. 3 very good agreement is obtained except for with the linear model at high amplitudes.
The somewhat over prediction of the loads for Spacer Grid No. 4 and Midspan Mixing Grid No. 1 for the BOL condition prototype fuel assembly could be attributed due to imprecise knowledge of ‘stand-off” distances between the grid and the stationary impact wall (Figures 5 and 6). A good agreement is achieved between the numerical impact forces and the test results for the EOL condition (Figures 7 and 8). This shows that the 3-beam fuel assembly model is correctly analyzing the grid preload effect.
This 3-beam fuel assembly model can be easily incorporated into the faulted core models for LOCA and seismic analyses. The 3-beam fuel assembly model does not require the calculations of the in-grid stiffness. Hence the use of this model would eliminate the requirement of determining the in-grid stiffness of the spacer grids and the mid-span mixing grids through the rather expensive prototype fuel assembly lateral impact testing.
5. REFERENCE
Shah S.J., Brenneman B., (2002), “Fuel Assembly Nonlinear Dynamic Model”, ICONE 10, Washington, D.C, USA, Track 3.
Table 1
Lateral Pluck Impact Cases
Model
Pluck Amplitude (in.)
Impacting Grids
Linear As Tested in Air
70
0F – BOL Condition
0.5
0.5
0.6
0.8
0.8
MSMG1
SG3,MSMG1, SG4
SG3,MSMG1, SG4
SG3,MSMG1, SG4
SG3, SG4
Nonlinear As Tested in Air
70
0F – BOL Condition
0.5
0.5
0.6
0.8
0.8
MSMG1
SG3,MSMG1, SG4
SG3,MSMG1, SG4
SG3,MSMG1, SG4
SG3, SG4
Nonlinear As Tested in Air
70
0F – EOL Condition
Amplitude -0.5 in. Amplitude -0.6 in. Amplitude -0.8 in.
Force
Test Linear Nonlinear
Figure 2: Pluck Forces - Tight (BOL) Prototype Fuel Assembly
Amplitude -0.38 in. Amplitude -0.48 in. Amplitude -0.56 in.
Forc
e Test
Nonlinear
Amplitude -0.5 in. Amplitude -0.6 in. Amplitude -0.8 in. Amplitude -0.8 in.
Force
Test Linear Nonlinear
Figure 4: Impact Forces – BOL Prototype Fuel Assembly - SG3
Figure 5
Impact Forces – BOL Prototype Fuel Assembly – SG4
Amplitude -0.5 in. Amplitude -0.6 in. Amplitude -0.8 in. Amplitude -0.8 in.
Force
Amplitude -0.5 in. Amplitude -0.5 in. Amplitude -0.6 in. Amplitude -0.8 in.
Force
Test Linear Nonlinear
Figure 6: Impact Forces – BOL Prototype Fuel Assembly – MSMG1
Figure 7: Impact Forces – EOL Prototype Fuel Assembly – SG4
Amplitude -0.38 in. Amplitude -0.48 in. Amplitude -0.56 in.
Force
Figure 8: Impact Forces – EOL Prototype Fuel Assembly – MSMG1
Amplitude -0.38 in. Amplitude -0.48 in. Amplitude -0.56 in.
Force