MASTER THESIS
ANALYSING RELATIONSHIPS BETWEEN
BUILDING CHARACTERISTICS AND
AIRTIGHTNESS OF DUTCH DWELLINGS
Paper and Documentation
CHELY N. BRAMIANA (S1376322)
CONSTRUCTION MANAGEMENT AND ENGINEERING
GRADUATION COMMITTEE
PROF. DR. IR. J.I.M. HALMAN
DR. IR. A.G. ENTROP
Table of Contents
Preface 4
Paper 5
Abstract 6
I. Introduction 7
II. Literature Review 9
III. Research Method 12
IV. Results 13
V. Discussion 22
VI. Conclusion and recommendations 24
Acknowledgements 25
References 25
Research proposal 28
Abstract 31
1. Introduction 31
2. Research Design 35
3. Research Method 37
4. Literature Review 40
References 46
Appendix 50
Documentation of the research 51
I. Digital available documentation 52
II. Descriptive Statistics 52
III. Correlations Analysis 54
IV. Regression Analysis 57
V. One-way ANOVA 62
VI. Two-way ANOVA 78
VII. Summary of Exploratory Analysis 86
VIII. Multi linear regression 87
IX. Original data on spread sheet 89
PREFACE
This research is the final proof of competence for obtaining Master of Science (MSc) degree in Construction Management and Engineering (CME), from the University of Twente. This research has been assigned internally and executed in Department of Construction Management and Engineering, University of Twente under supervision of Prof. Dr. Ir. J.I.M. Halman and Dr. Ir. A.G. Entrop. The executed research focuses on relationship between building characteristics and building airtightness of dwellings. Interest in this work was informed by the lacuna found in both policy on and practice of energy-efficient buildings. This is directly influenced by the quality of building envelope to prevent air leakages. The centre of this study are Dutch dwellings to further expand knowledge on airtightness and air leakages of buildings in The Netherlands. This is hoped that findings could also contribute to the pool of literature on airtightness all over the world.
Enschede, 26th August 2015
PAPER
ANALYSING RELATIONSHIPS BETWEEN BUILDING CHARACTERISTICS
AND AIRTIGHTNESS OF DUTCH DWELLINGS
Analysing
relationships
between
building
characteristics
and
airtightness of Dutch dwellings
ABSTRACT
Several studies have shown that building airtightness is an important parameter to improve energy efficiency of buildings. Towards this end, many countries also emphasize the importance of addressing air leakage in their regulatory policies. Many scholars and research organizations have attempted and/or developed models to predict building airtightness in order to ensure that buildings comply with the minimum requirements permitted by law. However, none of these models can substantially substitute the results of blower door tests. This warrants the need to explore factors that have both effects and interaction with building airtightness. This paper explores 320 Dutch dwellings by studying the relationship between measured building airtightness and building characteristics abstracted from past studies. Correlational analyses as well as the ANOVA test were done to determine relationships between building characteristics and measured building airtightness. Multiple linear regressions were also done to measure the effects of these factors on building airtightness. Year of construction, total leakage, roof type, building method and building typology were found to have significant relationships with building airtightness; but, only year of construction and total leakage were found to have influence on building airtightness, in terms of specific leakage rate. A significant interaction was also found between these two variables and specific leakage rate (m3/(h.m2)). This means that actors in the construction industry must strive to minimize the chances of air leakage by improving the quality of workmanship at all phases of construction to reduce the chances of the leakage paths happening in the building at all interfaces. This study recommends more exploration of other factors to test their relationship and effect on building airtightness.
Keyword: building airtightness, specific leakage rate, air leakage, building characteristics, Dutch dwellings
Nomenclature:
Symbol Quantity Unit
Vm Measured air flow rate m
3
/h
Venv Air flow rate through the building envelope m
3
/h
VL Air leakage rate m
3
/h
V50 Air leakage rate at 50 Pa m
3
/h
Cenv Air flow coefficient m
3
/(.Pan)
CL Air leakage coefficient m
3
/(.Pan)
n Air flow exponent -
p Pressure Pa
Δp Induced pressure difference Pa
AE Envelope area m
2
AF Floor area m2
v Internal building volume m3
N50 Air change rate at 50 Pa h-1
Q50 Air permeability at 50 Pa m
3
/(h.m2)
I. INTRODUCTION
A. Energy-efficient buildings and airtightness: an overview
The building sector is responsible for a significant portion of energy use in the world. Different stakeholders across the world such as governments, scientists and environmentalists are aware of the impact of buildings on the environment. With the issue of sustainability getting more important, several attempts are made to reduce the energy use of buildings by improving building energy efficiency. This calls for more development and wide adoption of sustainable buildings. It motivates the actors in the construction industry to promote innovations such as zero-energy buildings, energy neutral buildings, high-efficiency building and smart buildings. The focus is still the same: to reduce the energy needs of buildings. Therefore, while innovation in the building technology area is rapidly developing to reduce energy consumption, it is also intrinsic that engineers and contractor ensure they construct new buildings in compliance with the current regulations. Apart from guidelines in the policy, other organizations such as the Energy Saving Trust (EST) in the United Kingdom (UK) [1] and SBRCURnet [2] in The Netherlands also foster compliance with the legal directives. This is geared towards the ultimate goal of achieving energy-efficient buildings.
However, to achieve this goal, different active or passive strategies are employed [3]. Measures such as improving heating ventilation and air conditioning (HVAC) systems and installing a solar panel are categorized as active strategies. On the other hand, improving the quality of the building envelope through improvement of the wall, window and door penetration, and roofs is categorized as a passive strategy. Moreover, passive houses, which require certain measures of building envelope (air change rate N50 of 0.6 ACH), are obvious examples of passive strategy implementation. In addition, not every
household can afford to apply active energy efficient strategies. Therefore passive strategies such as improving the thermal insulation and building airtightness to reduce heat loss are recommended and regulated in the building code.
As part of the passive strategy, airtightness is considered important for improving the energy efficiency of buildings. Building airtightness has been included in the regulations in many countries to achieve energy efficient buildings, which is in most cases usually measured in terms of air permeability level. The term ―airtightness‖ pertains to the intensity of the uncontrolled flow of air through the building envelope as a result of pressure differences between interior and exterior air [4]. Several studies have addressed the importance of ensuring building airtightness in order to reduce air infiltration and thus reducing the cooling load and heat loss of the building [3]. These studies indicate that tightening the building envelope provides a large energy benefit[5], [6]. Recent studies suggest the importance of building airtightness towards energy efficiency, thermal comfort and indoor air quality of dwellings [7]–[10]. Maintaining building airtightness is also essential for the effectiveness of heat recovery installed in the building [11], [12]. Therefore, it is important to maintain a certain level of building airtightness to optimize the energy efficiency of a building.
B. Issues arising: the Dutch context
European legislation on the energy performance of buildings (Energy Performance Building Directive – EPBD) states that member states must calculate the energy efficiency of a building in their countries [13]. The ripple effect of this, for example, is evident in the Dutch Building Code [14], which requires residential buildings to comply with a certain level of energy performance (Article 5.2) and a given limit of total airflow (Article 5.4). However, there is a minor flaw in the Code. It explicitly mentions the minimum requirement of the energy performance coefficient (EPC) to comply with and maximum total airflow allowed. Nevertheless, it does not explain other minimum requirements such as how the total airflow is broken down into ventilation and infiltration; and degree of building airtightness. This might initiate some confusion as it is found in some cases that buildings comply with the minimum required EPC but they do not comply with the minimum value of building airtightness or vice versa. Every Dutch house is required to have an energy performance certificate which contains the energy performance coefficient. And every new Dutch house to be constructed takes the value of qv10 into
account in the calculation of energy performance coefficient. Therefore, the engineers or architects must include in their design and calculation the value of qv10 that will be assigned to the EPC.
new building must include this minimum value in the EPC. Moreover, they cannot be certain whether this value can be achieved. To ensure that this minimum value is fulfilled, a blower door test can be conducted, to measure the airflow rate of the assigned building.
However, another problem is that contractors only rely on the measurements results done after the completion of the building. The required airtightness is then sometimes not complied with. Whereas, efforts can be taken to ensure that a certain level of building airtightness is integrated from the beginning of any new construction project. For the last couple of years, this blower door test has been taken prior to completion or the moment of turnkey in order to ensure that any minimum requirement set for the building is fulfilled. Therefore, contractors can still manage to improve the building before it is occupied. In addition, plans for the retrofitting or rehabilitation of existing buildings are required to get measured [5], [6], [15], [16]. Nevertheless, it is unfortunate that contractors cannot harness their resources to provide better overview of estimating building airtightness. Even though they have the complete specification of the forthcoming building, they might not be able to estimate the exact value of qv10 because they cannot estimate the building airtightness from the drawings they provided
themselves. Therefore, analysing estimated building airtightness prior to conducting blower door test, might be an important intervention.
C. Research objectives and scope of study
The objectives of this research are ―to determine the building characteristics abstracted from past studies that have significant relationship with building airtightness and those that have the most significant influence on measured building airtightness of existing building ex post‖. Therefore, this research aims at exploring variables that substantially influences building airtightness by assessing existing measurements in order to develop a predictive model. There have been many studies in the past to estimate airtightness without taking the blower door test. Even though a predictive model still cannot replace the results of a blower door test, it still can help stakeholders to improve building airtightness. At least contractors and designers can use it to maintain the target of minimum air permeability during the early construction phase. Even though not every variable is expected to be useful to develop a predictive model, the findings can contribute to future research in predicting building airtightness of dwellings more consistently.
The scope of this research will cover only residential buildings in The Netherlands, based on data from pressurization tests on dwellings gathered by the University of Twente. The reason residential buildings are in this study‘s interest is predicated on the following facts. First, there are more residential buildings than service buildings in the Netherlands. The 2013 report from the Central Bureau of Statistics shows that there are more than 7.2 million dwellings in The Netherlands. With a share of 87.3%, dwellings constitute the bulk of the total building stock compared to non-dwellings, which only made up approximately one eighth of the total building stock in the Netherlands (nearly 1.1 million objects) [17]. Consequently, the residential buildings yield the highest energy cost. Second, the inhabitancy of residential buildings and the usage of the structures differ to service buildings, because people generally live their lives and spend more time at home. Therefore, residential buildings are more intensely used than service buildings, which have more structured and regular opening and closing hours.
II. LITERATURE REVIEW A. Air leakage measurements
In order to determine the airtightness of a building, a test is usually carried out to measure the amount of air leaking within building envelope. The level of building airtightness is firstly measured in terms of the amount of air leakage between different indoor and outdoor pressure using standardized method. The most common method to measure air leakage in a building is the pressurization test, which uses a blower door. This method is based on the mechanical pressurization or depressurization of a part of a building, using a blower door mounted in the front door with all ventilation sealed and all adjacency remain open. The airflow rate measured through the building envelope is caused by the differences in pressure between the air inside and outside. The airtightness of building components and elements is measured according to standard NEN-EN 13829 [18]. Another thing to be noticed is that even though the measurement method is not complicated and can be carried out with little amount of equipment and time, the interpretation of the results requires a certain extent of knowledge.
When measuring the building airtightness, the occurring air leakage is quantified as the airflow getting through the building envelope, which is V as a function (m3/s), through differences in pressure, expressed in P (Pascal). The pressure-flow relationship, which acts according to the power law, is often expressed by the equation:
Equation 1
The flow coefficient is a function of the size of building openings, and the pressure exponent is expressed 0.5 ≤ n ≤ 1.0. An exponent of 0.5 denotes fully turbulent and an exponent of 1.0 represents laminar flow. Usually the flow exponent is 0.65 [10]. The airflow is often denoted with the reference pressure as a sub-script (e.g. V50 or V25). The reference of 50 Pa in air pressure differences is most
often used. Another common reference pressure used is 4 Pa, but 1 Pa, 10 Pa, 25 Pa, and 75 Pa are used as well [10].
B. Defining airtightness
The next step of measuring airtightness is to define the building airtightness term by normalizing the measured air leakage (VL). There are three quantities commonly used to normalize the measured air
leakage: building volume, envelope area and floor area [10], [19], [20]. These normalisations are used depending on the context of the regulation either where or for what purpose. Consequently, there are three different terms used to address building airtightness, which this research borrowed the term from NEN-EN 13829. Each has advantages and disadvantages and each is useful for evaluating different issues:
1) Air change rate
When the building volume is used to normalize such data the result is normally expressed in air changes per hour at the reference pressure and it is the second most common air tightness metric reported in the literature [7], [21], [22]. Many people find this metric convenient since infiltration and ventilation rates are often quoted in air changes per hour. The air change rate at 50 Pa pressure difference (N50) is calculated by dividing the mean air leakage rate at 50 Pa by the internal volume
using equation 2 with unit h-1:
Equation 2
2) Air permeability
used, but they are actually opposing terms. The lower the air permeability is, the more airtight a building is.
The air permeability in 50 Pa pressure difference is symbolised as Q50 and the unit is m 3
/h.m2. Air permeability is calculated by dividing the mean air leakage rate at 50 Pa by the envelope area using equation:
Equation 3
3) Specific Leakage Rate
Normalization using floor area, expressed as specific leakage rate at reference pressure difference, is the easiest to determine from a practical aspect compared to the other normalizations. Since usable living space scales most closely relate to floor area, normalizing these scales is sometimes viewed as being more equitable [10]. This normalisation is also used in the EPC in the Dutch Building Code. Specific leakage rate at 50 Pa difference, w50, is calculated by dividing the mean air leakage rate at 50
Pa by the floor area using equation 4 and the unit is m3/h.m2:
Equation 4
[image:10.595.58.537.339.379.2]Table 1 explains the difference between different building airtightness terms used in different context. Table 1 Differences in building airtightness terms
Terms Normalisation Symbol Units
Air change rate (infiltratie voud) Air leakage rate divided by internal building volume N h-1 Air permeability Air leakage rate divided by building envelope surface Q m3/h.m2 Specific air leakage rate Air leakage rate divided by usable floor area w m3/h.m2
Even though, Q50 and N50 are the most commonly used in many countries, The Netherlands use the
norms w10 (equivalent to qv10 in Dutch policy) which is the specific leakage rate at 10 Pa difference.
On the other hand, Dutch Building Code only mentions that the permitted total air flow rate of residential including toilet and bathroom must not be bigger than 0.2 m3/h. The desired specific leakage rate is stated in EPC, depending on the volume of the building. For comparison, the relation between qv10 and N50 is depending on the flow coefficient (n) and divided by about 25 – 30. The
airflow (qv10) of about 113 dm 3
/s, equals to an N50 of about 3.5 to 4.5 [De Gids, 2010].
C. Airtightness prediction and important variables
Studies carried out with the purpose to develop a model to predict building airtightness can be divided into two broad research categories: ‗experimental‘ and ‗correlational‘[8].‗Experimental‘ research is carried out under controlled experimental conditions with the purpose of measuring the causal effects of independent variables on dependent ones, while ‗correlational‘ research is carried out under statistical control with the purpose of understanding the correlation between variables. Experimental studies can be carried out by building simulation and test specimen which can be found in the studies carried out in Portugal [24], in Ireland [16] and in Italy [25]. ‗Correlational‘ research mostly employ regression method, which can be found in some studies carried out in Finland [7], in the UK [8], in the US [19], in Catalonia [21], in Greece [22] and in Estonia [23]; and the most recent one used neural networks conducted in Croatia by Krstic et al. [4]. These studies, furthermore, were carried out to develop a model to predict or estimate value of building airtightness prior to a blower door test. Moreover, Relander, Holøs and Thue [26] categorized method to estimate building airtightness into three groups: (1) estimation based on multiple regressions, (2) estimation based on the rough characteristics of the building and (3) estimation based on the component leakage and geometry of the building.
construction type [21], type of foundation [19] and building method [23]; while non-structural building characteristics includes floor area [19], house height [19] and number of storeys [23], ventilation system [19], [23], insulation type [21] and management context [8].
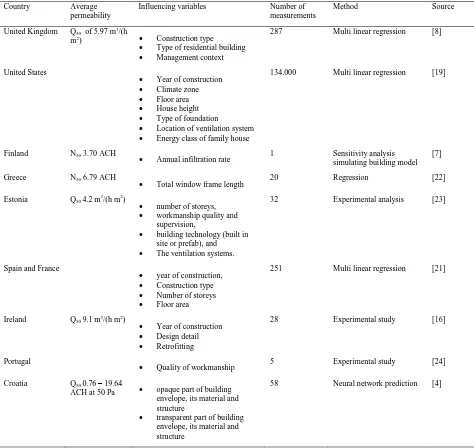
[image:11.595.60.534.272.720.2]Many literary studies has shown that the quality of workmanship plays a critical role in achieving building airtightness [16], [23], [24], especially that it corresponds directly to possible leakage path. Parameters included in workmanship are: installation methods, detail of joints and amount of opaqueness and transparency of building envelope. The possible leakage paths on joints were found in the window-wall interface [27], as well as the structural floor [28]; the joints between the basement wall and the wooden frame wall [29]; between the wall and the roof [30]; and in the roof joints [31]; many of which were caused by the method of sealing joints [27]–[29]. Table 2 summarised the abstracted variables from past studies. These abstracted variables will constitute the independent variables to be tested for significance and included in the analysis.
Table 2 Summary of predictors of building airtightness from past studies
Country Average permeability
Influencing variables Number of measurements
Method Source
United Kingdom Q50 of 5.97 m3/(h
m2) Construction type
Type of residential building
Management context
287 Multi linear regression [8]
United States
Year of construction
Climate zone
Floor area
House height
Type of foundation
Location of ventilation system
Energy class of family house
134.000 Multi linear regression [19]
Finland N50 3.70 ACH
Annual infiltration rate 1 Sensitivity analysis simulating building model [7]
Greece N50 6.79 ACH
Total window frame length 20 Regression [22]
Estonia Q50 4.2 m3/(h m2)
number of storeys,
workmanship quality and supervision,
building technology (built in site or prefab), and
The ventilation systems.
32 Experimental analysis [23]
Spain and France
year of construction,
Construction type
Number of storeys
Floor area
251 Multi linear regression [21]
Ireland Q50 9.1 m3/(h m2)
Year of construction
Design detail
Retrofitting
28 Experimental study [16]
Portugal
Quality of workmanship 5 Experimental study [24]
Croatia Q50 0.76 – 19.64
ACH at 50 Pa opaque part of building envelope, its material and structure
transparent part of building envelope, its material and structure
III. RESEARCH METHOD
This research focused on the results measurements of 320 Dutch residential buildings. A quantitative analysis was employed in this research to study the correlation between variables since it can give more elaborate analysis. This study falls into correlational research.
A. Description of data
Measurements are gathered from several organizations that run blower door tests in many houses in The Netherlands. Because the blower door tests were conducted by different organization, consequently, there are different formats of measurements results. Some reports reported more data than the others and few of them did not mention the location of the building, only the results of the blower door test. 7.5% of the measurements were taken during construction, 70% around completion, 8.1% during occupancy and 14.4% of them were unknown.
Even so, all reports must indicate some essential elements which are: the value of qv10, which further
will be mentioned as w10 in this paper, the airflow leakage from different pressure difference, flow
coefficient and pressure exponent. Some reports separate the results by pressurization and depressurization, while other only mention the general result. The building data, such as: drawing plan, ventilation system and building characteristics; leakage path and infra-red image to identify the leakage path were also provided in some reports.
Nevertheless, the regulation in The Netherlands mentioned the pressure reference is at 10 Pa difference, the results of 50 Pa difference are also analysed. The pressure reference at 10 Pa difference is used because it refers to the condition under normal weather circumstances, while 50 Pa difference is used to measure building airtightness since it is low enough not to deteriorate the measurements and high enough to be independent from weather condition. Equation 1 and 4 is used to convert the specific leakage rate to 50 Pa by calculating the flow exponent and leakage coefficient gathered from the measurement results. The specific leakage rate at 50 Pa difference (w50) will be used in some
analysis because regarding the local context of Dutch regulation, the building airtightness is measured as specific leakage rate at 10 Pa difference (w10). Hence, the main target of this research will be the
specific leakage rate at 10 Pa difference. B. Variables accounted
Literature on building airtightness suggests a wide range of influencing variables grouped under year of construction, structural and non-structural building characteristics and quality of workmanship. Besides those variables, some additional parameter also included in the measurement results will be taken into account in the research. This section summarizes the variables from those two sources that will be analysed in this research.
The variable ‗year of construction‘ (YEAR) is included in this research, because many studies suggested that there is a correlation between year of construction and building airtightness. Even though the target found in the literature is mostly air permeability at 50 Pa difference (Q50) and air
change rate at 50 Pa difference (N50), this research will test the correlation of year of construction and
specific leakage rate at 10 Pa difference (w10). Variables that fall into structural building
characteristics are building method (BM) and building typology (BT). Building method corresponds on how the building is constructed, either by on-site construction, prefabrication or combination of both. Building typology correspond to the main material of the construction type such as: concrete, wood frame, masonry and steel construction.
The next variables measured are leakages occur in the measured building. Some measurements results reported the leakage path or air leakage penetration either with infra-red image or using smoke to identify the location of leakage paths and determine the damage caused by the leakages. There are four classifications of leakages provided in the measurements results. Level 1 is for the least damaging leakage and level 4 is the most critical one. To accumulate this different level of leakages, we compute the total score of leakages and name it under a new construct 'TotalLK'. Construct Total Leakage is defined by the cumulative amount of all leakage together by weighting the leakage level 1 is 1 and so on. Therefore, the construct TotalLK = LK1*1 + LK2*2 + LK3*3 + LK4*4. This variable is tested to show the relationship between leakages that occur in the building and building airtightness.
C. Analysis method
There are 320 measurement results of different houses in The Netherlands provided. The first attitude towards the data is to compile the data in the Microsoft Excel to ease the categorization of the measurement results. Afterwards, the spread sheets will be exported into statistical software program for more complex analysis. This research used IBM SPSS 20 because this software provides more elaborate analysis results.
Variables mentioned in the previous section will act as independent variables with the target of specific leakage rate at 10 Pa difference (w10) and 50 Pa difference (w50), act as dependent variables.
The variables are treated differently according to the type of data. Variables YEAR, DT, BM, BT and ROOF are nominal data where each number represents another value. To check the correlation between these variables and dependent variables, we run the ANOVA test between variables by comparing means the independent and dependent variables. The variables are tested to see which variables differs significantly, thus are significant factors to predict building airtightness. For the scale data, which are FLOOR, QEPC and TotalLK, linear regression analysis is carried out to see the relationship and how significant the correlation is. For both kind of data type, correlation analysis is carried out for all dependent variables and independent variables.
The ANOVA test is run to compare means and the results shows whether there is a significant difference between-group of means. The significance of each variable was assessed according to the P-value of the F-test, and applying confidence interval of 95%; that is, Pearson P-value (p-P-value) higher than 0.05 is considered not significant. Variable year of construction, for example, have F-test 103.058 with p-value < 0.05 implies that there is significance difference in means between groups, meaning that this variables is a good predictor to be included in the model development. On the other hand, the test of homogeneity of variances is also carried out to check the equal variances of the data (Levene 14.801, p < 0.05). The variance of the data in variable year is not equal. Higher F-test results means the data is spread out around the mean and to each other. Because F test only tells whether there is significant difference between groups but do not inform where it lies, therefore, a post-hoc Scheffe test was run to suggest significant difference between the means of all the pairs. Furthermore, the interaction between variables is studied using two-way ANOVA, because there are some variables that do not give significant effect individually but give significant effect with interaction with other variables.
IV. RESULTS
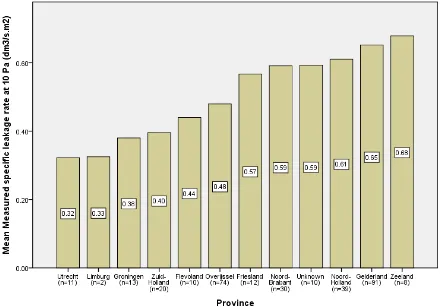
Figure 1 Specific air leakage of all dweliings studied; max = 5.04 dm3/s.m2, min = 0.06 dm3/s.m2
From 320 measurements, only 310 mentioned the location of the building in 11 provinces: Groningen, Friesland, Overijssel, Flevoland, Utrecht, Holland, Zuid-Holland, Gelderland, Zeeland, Noord-Brabant, and Limburg. Figure 2 illustrates the mean dispersion of building airtightness in The Netherlands. From the representation, houses measured in Province Utrecht have the lowest mean of specific leakage rate (0.32 dm3/s.m2) compared to other provinces, followed by Limburg (0.33 dm3/s.m2) and Groningen (0.38 dm3/s.m2). The highest mean of building airtightness is reported from houses in Province Zeeland (0.68 dm3/s.m2).
[image:14.595.79.519.427.734.2]A. Correlation between building characteristics and specific leakage rate
The first analysis carried out is the correlation analysis between dependent variables w10 and w50, and
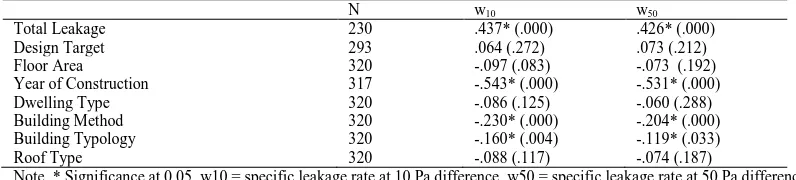
[image:15.595.64.462.195.285.2]independent variables. Table 3 presents the results of the correlation analysis. Pearson value (P-value) suggests the type of correlation and how strong the correlation is. In this case the correlation is significant at 0.01. N shows how many valid data is used to analyse the correlation between variables and missing data is not included in the analysis.
Table 3 results of correlational analysis between variables
N w10 w50
Total Leakage 230 .437* (.000) .426* (.000)
Design Target 293 .064 (.272) .073 (.212)
Floor Area 320 -.097 (.083) -.073 (.192)
Year of Construction 317 -.543* (.000) -.531* (.000)
Dwelling Type 320 -.086 (.125) -.060 (.288)
Building Method 320 -.230* (.000) -.204* (.000)
Building Typology 320 -.160* (.004) -.119* (.033)
Roof Type 320 -.088 (.117) -.074 (.187)
Note. * Significance at 0.05. w10 = specific leakage rate at 10 Pa difference. w50 = specific leakage rate at 50 Pa difference
Table 3 suggests that variables year of construction, building method, building typology and total leakage are significant and might be a good predictor to specific leakage rate at 10 Pa. However, variable building year and total leakage are the best predictors because they have higher P value (-0.543 and 0.437) compared to the rest. Compare to specific leakage rate at 10 Pa, variable year of construction, building method and total leakage are also significant for specific leakage rate at 50 Pa. However, the correlation analysis only shows whether there is correlation between variables but not the effect of one variable to another; and also did not give deeper insight of the differences between groups‘ means. Therefore, an ANOVA test is carried out to explore those variables that influence specific leakage rate.
[image:15.595.78.300.433.655.2]1) Total Leakages
Figure 3 Scatter Plots of Total Leakages
A positive correlation was found between measured specific leakage rate at 10 Pa difference and total leakages in the building with r = 0.437, (p < 0.05, 2-tailed) for 10 Pa difference, as plotted in Figure 3. Further statistical tests revealed the correlation for measured specific leakage rate at 50 Pa and total leakages (r = 0.426, p < 0.05, 2-tailed). However, only 19.1% of the variation in w10 and only 18.2%
of the variation in W50 can be explained by the variable total leakages. This result points out that
leakages in the building contributes to the building airtightness in considerable amount.
2) Design Target
As mentioned in the introduction, most of the buildings were assigned a qv10 to be included in the EPC
calculation. This assigned qv10 is treated as a variable design target, which means that this value is the
minimum value that must be compelled. 91.6% of the measurements mentioned the target qv10 of the
EPC. 8.5 % of the entire measurement results has targeted below 0.15, 49.5% below 0.4 and 91.1% below 0.625.
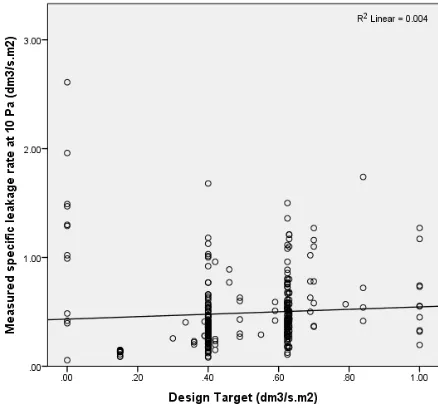
However, no significant correlation is found between the variable design target and specific leakage rate at 10 Pa difference (n = 293, r = 0.064, p = 0.272) as well as at 50 Pa difference (n = 293, r = 0.073, p = 0.212). The scatter plot of design target and specific leakage rate at 10 Pa, as seen on Figure 4, shows that the assigned qv10 on EPC does not necessarily ensure the accomplishment of building
[image:16.595.75.294.328.532.2]airtightness.
Figure 4 Scatter Plot of Design Target
3) Floor area
Analysis was also carried out of the correlation between measured specific leakage rate and floor area. The result suggests there is no significant correlation between floor area with specific leakage rate at 10 Pa difference (n = 320, r = -0.097, p = 0.083) and at 50 Pa difference (n = 320, r = -0.073, p = 0.192).
B. One way ANOVA
1) Year of construction
[image:17.595.77.359.193.422.2]The variable ‗year of construction‘ is going to be studied its correlation with building airtightness. Because there are many buildings with different year of construction, the first step is recode year built into range. The consideration is based on Dutch Building Code, which are 'Bouwbesluit 1992, 2003 and 2012'. Therefore, we categorized the year range based on the year of the regulation apply. Figure 2 shows that older buildings (pre-2003) have significantly higher specific leakage rate (3.09 dm3/s.m2) compared to newer buildings (0.17 dm3/s.m2 and 0.52 dm3/s.m2). However, the measurement results were dominated by building from post-2012 (92.2%). Consequently, there is more spread in the building from this group with more extreme cases occurring.
Figure 5 Specific leakage rate by year built
To compare the means of building airtightness among different group of year of construction, a one-way ANOVA F-test was used. F test of 68.876 (p < 0.01), for target of specific leakage rate at 10 Pa difference, suggests that the different between groups is significant. Likewise, the results with specific leakage rate at 50 Pa difference (F = 61.864 p < 0.01) also suggests that conclusion. The test of homogeneity (Levene Statistic 10.192, p < 0.05) suggests that the variance between 4 groups is not statistically equal. It means there is at least one group that differs significantly than the others. Therefore, a post-hoc Scheffe test was run to reveal where the differences lie between groups. The same procedure applies for the target of specific leakage rate at 50 Pa (Levene Statistic 7.468, p < 0.05) because the homogeneity test suggests the same results.
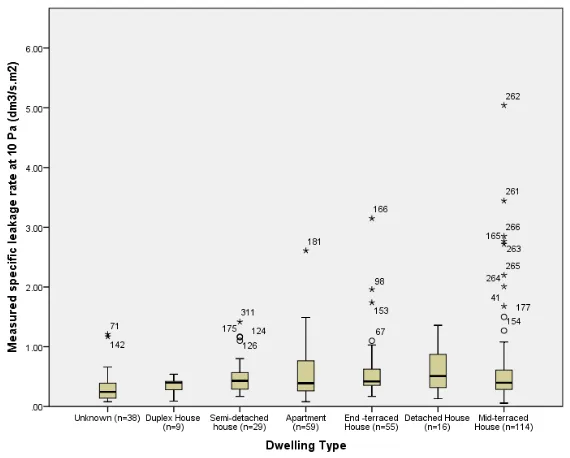
2) Dwelling type
The residential buildings studied were grouped into seven types of dwelling type: apartment, duplex house, end-terraced house, mid-terraced house, semi-detached house, detached house and the remaining buildings which type weren‘t known is grouped as unknown. ANOVA tests were run to compare between-groups means divided by the within-groups one.
[image:18.595.74.359.276.505.2]Firstly, the test of homogeneity (Levene‘s test) carried out to show that the variance between 7 different groups. The results of the homogeneity test suggests that variance between groups on specific leakage rate at 10 Pa difference as target is equal (F = 1.948 p = 0.073); however, with specific leakage rate at 50 Pa different as target, it was found that there is a difference between the variances among 7 groups (F = 2.944 p < 0.05). However, the results of the ANOVA test suggests otherwise. The F ratio of 1.817 (p = 0.095) implies that the differences between means of specific leakage rate at 10 Pa difference were not statistically significant. The same conclusion applies to the means of specific leakage rate at 50 Pa difference (F = 2.064 p = 0.057). In conclusion, variables dwelling type is not a suitable predictor for specific leakage rate, neither at 10 nor 50 Pa difference, because statistics suggest means between groups are not significant.
Figure 6 Specific leakage rate by dwelling type
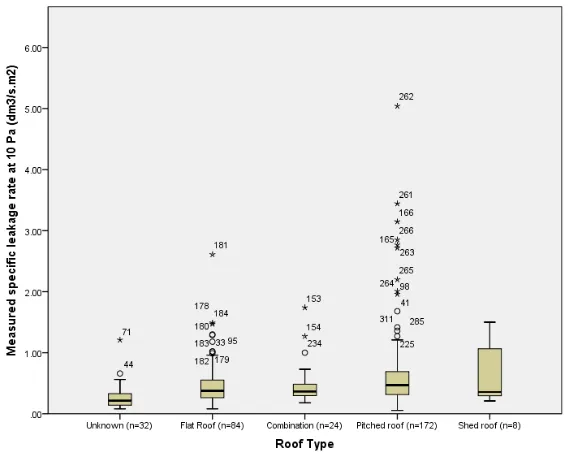
3) Roof type
The differences between roof types are also studied in this research. The dwellings studied in this research were grouped according to the roof types that are: shed roof, flat roof, pitched roof, combination (of more than one roof type) and the unknown group, which the roof type is not recognized. The test of homogeneity (Levene Statistic 2.551, p < 0.05) suggests that the variance between 5 groups is not statistically equal. It means there is at least one group that differs significantly than the others. The same procedure applies for the target of specific leakage rate at 50 Pa (Levene Statistic 5.168, p < 0.05) because the homogeneity test suggests the same conclusion. ANOVA test results suggest (F = 4.251, p < 0.01), for target of specific leakage rate at 10 Pa differences, that the difference between groups is significant. Likewise, the results with specific leakage rate at 50 Pa difference (F = 4.719 p < 0.01) also suggests the conclusion. A post-hoc Scheffe test is run to reveal where the differences lie between groups.
significant difference was found in unknown group and pitched group. The explanation of this result will be discussed in section 5.
[image:19.595.80.364.101.329.2]
Figure 7 Specific leakage rate by roof type
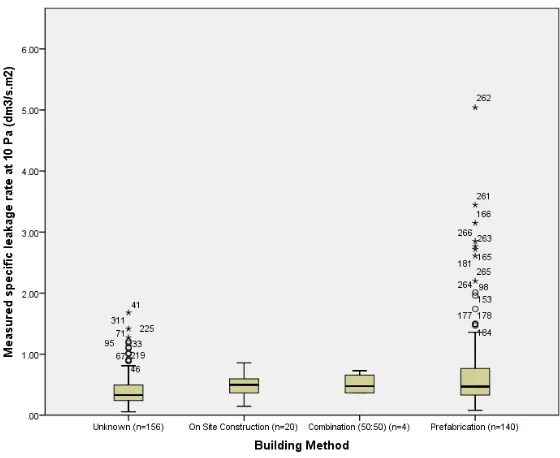
4) Building method
Figure 8 Specific leakage rate by building method
5) Building typology
The building typology is categorized according to the material of the structure, which are: concrete, wood frame, masonry, steel construction and group ‗unknown‘. F test of 4.598 (p < 0.01) suggests that there is significant difference in mean specific leakage rate at 10 Pa difference between groups. However, the other results (F = 3.025 p = 0.018) suggest that there is no significant different in mean specific leakage rate at 50 Pa difference between groups. The test of homogeneity (Levene Statistic 9.827, p < 0.05) suggests that the variance between the four groups is not statistically equal. There is at least one group that differs significantly from the others. Therefore, a post-hoc Scheffe test was run to reveal where the differences lie between groups. However, a post-hoc test cannot be run because there is one group that has less than two cases and that is the steel construction group.
Figure 9 Specific leakage rate by building typology
[image:20.595.76.358.485.712.2]following variables have significant influence on specific leakage rate at 10 Pa difference: year of construction, total leakage, dwelling type, roof type, building method and building typology.
C. Two-way ANOVA
The analysis above suggests that all variables, except floor area, design target and dwelling type are significant to predict specific leakage rate at 10 Pa difference. Even though every variable is significant, or equivalent as having main effect on building airtightness, the interaction between variables might have effect on building airtightness as well. Therefore, two-way ANOVA tests were run to analyse the interaction between variables. The difference between one-way and two-way ANOVA is that one-way ANOVA only studies main effect of variables to the target variables, while two-way ANOVA also studies whether interaction between variables giving effect on target variables. There are six variables included in the analysis, which resulted in seventeen pair of two-way ANOVA to run. Although previous analysis shows both measured specific leakage rate at 10 and 50 Pa difference, the main target of this research is still the Dutch context with 10 Pa difference.
However, not all variables showed interaction effect and cannot be accounted as good predictors. The results of two-way ANOVA test suggest that interaction effect occur between building year built x total leakages (F = 6.655 p < 0.01) with adjusted R-squared 0.703; total leakages x roof type (F = 2.128 p < 0.01) with adjusted R-squared 0.528; total leakages x building method (F = 3.135 p < 0.01) with adjusted R-squared 0.609; total leakages x building typology (F = 3.676 p < 0.01) with adjusted R-squared 0.607. These results prove that interaction between total leakage and other variables give effect on building airtightness.
[image:21.595.66.530.400.627.2]The results of the entire exploratory analysis can be summarised as seen on Table 4. Table 4 Summary of Exploratory Analysis results
Variables Analysis Method p-value* F-test Pearson‘s r R squared
Total leakages (TotalLK) Linear regression .000 .437 .191
Design target (QEPC) Linear regression .272 .064 .004
Floor area (FLOOR) Linear regression .083 -.097 .009
Year of construction (YEAR) One-way ANOVA .000 68.876
Dwelling Type (DT) One-way ANOVA .095 1.817
Roof Type (ROOF) One-way ANOVA .005 1.817
Building Method (BM) One-way ANOVA .000 8.505
Building Typology (BT) One-way ANOVA .001 4.598
Year x TotalLK Two-way ANOVA .000 6.655 .791
Year x DT Two-way ANOVA .768 0.264 .414
Year x ROOF Two-way ANOVA .433 0.617 .410
Year x BM Two-way ANOVA - - .421
Year x BT Two-way ANOVA - - .414
TotalLK x DT Two-way ANOVA 1.000 0.462 .687
TotalLK x ROOF Two-way ANOVA .001 2.128 .753
TotalLK x BM Two-way ANOVA .000 3.135 .771
TotalLK x BT Two-way ANOVA .000 3.676 .770
DT x ROOF Two-way ANOVA .251 1.263 .091
DT x BM Two-way ANOVA .855 0.567 .115
DT x BT Two-way ANOVA .985 0.259 .081
ROOF x BM Two-way ANOVA .701 0.637 .109
ROOF x BT Two-way ANOVA .622 0.735 .098
BM x BT Two-way ANOVA .352 1.048 .085
Note. *significant at 0.05.
D. Regression Analysis
significant variables; while enter method only show one model which shows only selected variables. Either enter, stepwise or forward method has been tested in this research using SPSS 20 and all yield on similar results.
The initial model developed as followed:
w10 = α + βtotalLK . TotalLK + βYEAR . YEAR + βROOF . ROOF + βBM . BM + βBT . BT Equation 5
The parameter βYEAR represents the coefficient for year category when the building was built.
Parameter βTotalLK represents the coefficient of total leakage and variable TotalLK is the total value of
leakage damage level found during measurements. The reason to include total leakage known in the measurements is to predict whether sealing certain point of leakage path can improve building airtightness of the building prior to next measurements. The same applies to ROOF, BM and BT, where β represents the coefficient and the variables are the value that represents the dwelling type, roof type, building method and building typology.
Apparently, the regression analysis has shown that variables ROOF, BM and BT are not significant to be applied in the model. Table 5 provide elaborate coefficient value for constant and predictor variables for the equation. Therefore, regression was run again by removing the not significant variables.
w10 = α + βtotalLK . TotalLK + βYEAR . YEAR Equation 6
As seen on Table 5, Eq. 6 has slightly lower R-square than Eq. 5, meaning that 42.1% of w10 can be
[image:22.595.63.536.410.506.2]explained by the model regression. However, Eq. 6 only accounted significant variables compare to Eq. 5 that still accounted variables ROOF, BM and BT, which have significant influence according to ANOVA but not according to multiple linear regression. The justification this model will be discussed in following section.
Table 5 Coefficient and adjusted R-squared value for both models
Coefficient Regression 1 (Eq. 4) t p-value Regression 2 (Eq. 5) t p-value
α 2.412 ± 0.561 8.485 .000 2.362 ± 0.477 9.764 .000
βYEAR -0.555 ± 0.115 -9.530 .000 -0.553 ± 0.115 -9.534 .000
βTotalLK 0.013 ± 0.004 6.233 .000 0.013 ± 0.004 7.150 .000
βROOF 0.025 ± 0.025 .708 .480
βBM -0.102 ± 0.102 -1.963 .051
βBT 0.051 ± 0.051 1.148 .252
Adjusted R-square
0.425 0.421
F 34.365 .000 83.036 .000
V. DISCUSSION
This study aimed at determining the significant relationship between building characteristics and building airtightness. Correlational analysis and ANOVA tests were carried out to measure these relationships. Furthermore, by incorporating significant variables derived from the ANOVA test, a multi linear regression is run to determine significance factors that influence building airtightness. Many variables were considered from literature and the year of building construction, building method, building typology, roof type and total leakages were found to have significant relationships with specific leakage rate. However regression analysis shows that only building year and total leakage influences specific leakage rate. The results above showed that building characteristics such as dwelling type and floor area cannot explain the building airtightness because the difference in means were not significant. Even though the ANOVA test and the correlation test were run for both target of specific leakage rate at 10 Pa and 50 Pa difference, the results suggest slightly different numbers with similar outcomes.
as building method, material used and building technology are inculcated in the ‗year of construction‘ which is directly related to materials and building practices prevalent at that time. These might not be influenced in current legislation, but might be improved, for example, by retrofitting the leaky buildings.
The analysis shows that total leakage has a strong correlation with specific leakage rate and regression results proved that the amount of leakage happen in the house give influence to the specific leakage rate. This confirms that the more leakages occur in the building, the less airtight the building would be. Empirical data also suggests range of leakage path found in the buildings: window-wall interface, joint between floor and wall, joint between ceiling and wall, were found in roof joint, in plumbing installation, in electrical socket and in vent. This suggests that attention to details improves the quality of workmanship. As the literature shows[16], [23], [24], workmanship is critical to achieve building airtightness. Statistics also showed the same results that leakages occur in the building give significant influence on specific leakage rate, which in this case happen at 10 Pa different. In new houses, leakages can be minimized by paying close attention to details and this is anchored more on the quality of workmanship.
Building method was found not to have an impact on specific leakage rate. This is in contrast to the findings of Kalamees [23], who discovered that prefabricated detached houses are less leakier than houses that were constructed on site and therefore more airtight. However, because some of the cases did not explicitly categorize the building method, which in this study was categorized as ‗unknown‘, it is possible that this could have influenced the outcome. Moreover, the ANOVA test suggests that there is a significant difference in specific leakage rate means between groups. However, the significant difference lies between group ‗unknown‘ and prefabrication building. Even though, the regression analysis suggests no effect whatsoever. Although Montoya et al. [21] and Chan, Joh & Sherman [19] noted building typology to be a predictor of building airtightness, in the case of Dutch residential buildings, this variable was not discovered statistically significant as a predictor of specific leakage rate. Just as in the building method, the ANOVA test suggests there is a significant difference in means of specific leakage rate between groups. However, where the mean difference lies between groups cannot be determined by post-hoc ‗Scheffe‘ test in this study. This could have influenced the outcome that building typology cannot be a predictor.
As the ANOVA test presents, there is relationship between roof type and specific leakage rate; this difference in means of specific leakage rate lies between group ‗unknown‘ and pitched roof. However, results of regression shows no impacts of roof type on specific leakage rate. Nevertheless, just as in building method, because some of the cases did not explicitly categorize the roof type, which in this study was categorized as ‗unknown‘, it is possible that this could have influenced the outcome. Even though year of construction and total leakage both had main effect on specific leakage rate, their influences on specific leakage rate is not simultaneous but interactive. This means that the effect of total leakage is dependent on the age of building and vice versa. Total leakage also has interaction with other significant factors which are: roof type, building method and building typology. However they were statistically insignificant as predictors, therefore, the interaction effect has no consequences on specific leakage rate.
A. Implications
of the building is still a relevant finding because it still could be considered during the construction of new houses. Since total leakage has significant effect on specific leakage rate, more attention should be paid to minimizing air leakage at the early phases of construction and this is dependent on the quality of workmanship. Also other studies have suggested that supervisor and management play important role in achieving high quality workmanship and this could have positive impact on attaining less leakages and subsequently more airtight building. Therefore, a reliable model could not be generated with the findings of this study.
One interesting area of this research was to explore if roof type influences specific leakage rate, because previous studies overlooked it. A remarkable discovery is that roof type is actually related with specific leakage rate although it has no effect on it. Together with variable total leakage, roof type has an interaction effect on specific leakage rate. This might support the facts that leakage path found in the roof joint might contribute significantly to total air leakage and, consequently, affect building airtightness.
B. Limitations
This research, however, has some limitations. Since this study analysed results from many other scientific studies, one of the shortcomings of it is the heterogeneity of the results from the included studies can be affected. And this is because there are inherent differences in the individual studies such as method of obtaining data, analysing them and interpreting them. This research uses the term specific leakage rate to refer building airtightness while other studies use different terms to normalize building airtightness and measurement of such concepts could yield different outcomes. Also since this research uses regression to attempt to develop a model, such model method is only applicable if the new data is in range of a dataset from which the model was derived from. This is also a notable limitation to this study. Another limitation of these studies is that there were some missing data in the cases which are important for reliable findings. Studies could make stronger attempts to obtain and presents updated and comprehensive data which future research could reliably built on.
VI. CONCLUSION AND RECOMMENDATIONS
Many studies have attempted to predict airtightness prior to a blower door test. As Relander [26] concluded that no such model can substantially replace the blower door test. However, predicting airtightness is a fruitful effort to achieve a desired level of building airtightness, especially in the case of Dutch regulations, that require a certain value of qv10 or w10 to calculate the energy performance
coefficient. In this study, while total leakage, year of construction, roof type, building method and building typology have a relationship with airtightness, only year of construction and total leakage influence the building airtightness. This supposes that a reliable model cannot be developed from those variables since the overall effect was still relatively moderate. Other probably factors will explain the variance in airtightness. There might be need to further explore this area of interest to discover the cogent variables that could have effect on building airtightness. However, the findings of this work could be a springboard for future researches on airtightness. Particularly the fact that year of construction influences airtightness, which actually encompasses other building typology such as building material, building technology and practise during that time. This calls for testing other variables that are not included in this empirical study such as ventilation system and insulation type. Such building characteristics might influence building airtightness because ventilation system determines the indoor air quality and insulation type determines the quality of building envelope. Other studies have shown that supervision of workmanship and management context have effect on building airtightness. This could be confirmed within the study scope of The Netherlands, as the empirical data showed where the leakage path is and thus, attention to detail and enhancing the supervision in order to improve the quality of workmanship is essential to maintain achieve more airtight buildings.
can be applied on older buildings by using different material that configure the building envelope to measure the degree of improvement on building airtightness. These could perhaps be the intervention needed to ensure adequate building airtightness in the future and ultimately energy efficiency.
ACKNOWLEDGEMENTS
The author would like to thank The Indonesia Endowment Fund for Education, Ministry of Finance of Republic of Indonesia for providing the Master scholarship and the opportunity to study at the University of Twente. The author would also like to particularly appreciate the efforts of Joop Halman and Bram Entrop, for their guidance and encouragement that refined this study. Lastly, the author is grateful to Acniah Damayanti for the contribution on SPSS and statistical analysis, Adedapo Tunmise Aladegbaiye for giving some significant advice on the writing process and Martin Platenkamp for supporting on Dutch text translations.
REFERENCES
[1] NHBC Foundation, A practical guide to building airtight dwellings. Amersham: IHS BRE Press, 2009.
[2] P. Kuindersma and H. M. Nieman, ―Luchtdicht bouwen, theorie-ontwerp-praktijk,‖ Rotterdam, 2013.
[3] S. B. Sadineni, S. Madala, and R. F. Boehm, ―Passive building energy savings: A review of building envelope components,‖ in Renewable and Sustainable Energy Reviews, vol. 15, no. 8, Elsevier Ltd, 2011, pp. 3617–3631.
[4] H. Krstić, Ţ. Koški, I. I. Otković, and M. Španić, ―Application of neural networks in predicting airtightness of residential units,‖ in Energy and Buildings, vol. 84, 2014, pp. 160–168.
[5] J. M. Logue, M. H. Sherman, I. S. Walker, and B. C. Singer, ―Energy impacts of envelope tightening and mechanical ventilation for the U.S. residential sector,‖ in Energy and Buildings, vol. 65, Elsevier B.V., 2013, pp. 281–291.
[6] S. Nabinger and A. Persily, ―Impacts of airtightening retrofits on ventilation rates and energy consumption in a manufactured home,‖ in Energy and Buildings, vol. 43, no. 11, Elsevier B.V., 2011, pp. 3059–3067.
[7] J. Jokisalo, J. Kurnitski, M. Korpi, T. Kalamees, and J. Vinha, ―Building leakage, infiltration, and energy performance analyses for Finnish detached houses,‖ in Building and Environment, vol. 44, no. 2, 2009, pp. 377–387.
[8] W. Pan, ―Relationships between air-tightness and its influencing factors of post-2006 new-build dwellings in the UK,‖ in Building and Environment, vol. 45, no. 11, Elsevier Ltd, 2010, pp. 2387–2399.
[9] Ü. Alev, L. Eskola, E. Arumägi, J. Jokisalo, A. Donarelli, K. Siren, T. Broström, and T. Kalamees, ―Renovation alternatives to improve energy performance of historic rural houses in the Baltic Sea region,‖ in Energy and Buildings, vol. 77, Elsevier B.V., 2014, pp. 58–66.
[11] H. R. R. Santos and V. M. S. Leal, ―Energy vs. ventilation rate in buildings: A comprehensive scenario-based assessment in the European context,‖ in Energy and Buildings, vol. 54, Elsevier B.V., 2012, pp. 111–121.
[12] D. Mickaël, B. Bruno, C. Valérie, L. Murielle, P. Cécile, R. Jacques, and K. Severine, ―Indoor air quality and comfort in seven newly built, energy-efficient houses in France,‖ in Building and Environment, vol. 72, Elsevier Ltd, 2014, pp. 173–187.
[13] EU, ―Directive 2010/31/EU of the European Parliament and of the Council of 19 May 2010 on the energy performance of buildings,‖ Off. J. Eur. Union, pp. 13–35, 2010.
[14] BRIS Bouwbesluit Online, ―Bouwbesluit 2012.‖ [Online]. Available:
http://www.bouwbesluitonline.nl/Inhoud/docs/wet/bb2012. [Accessed: 25-Feb-2015]. [15] V. Iordache and T. Catalina, ―Acoustic approach for building air permeability estimation,‖ in
Building and Environment, vol. 57, 2012, pp. 18–27.
[16] D. Sinnott and M. Dyer, ―Air-tightness field data for dwellings in Ireland,‖ in Building and Environment, vol. 51, 2012, pp. 269–275.
[17] Centraal Bureau voor de Statistiek, ―Voorraad woningen en niet-woningen; mutaties, gebruiksfunctie, regio,‖ 2014. [Online]. Available:
http://statline.cbs.nl/StatWeb/publication/?VW=T&DM=SLNL&PA=81955NED&D1=7&D2= a&D3=0,103-519&D4=33&HD=140711-1613&HDR=G1,T&STB=G2,G3. [Accessed: 26-Aug-2015].
[18] CEN, EN Standard 13829: Thermal performances of building - determination of air permeability of buildings - fan pressurization method. Brussels: European Committee for Standardization, 2000.
[19] W. R. Chan, J. Joh, and M. H. Sherman, ―Analysis of air leakage measurements of US houses,‖ in Energy and Buildings, vol. 66, Elsevier B.V., 2013, pp. 616–625.
[20] W. R. Chan, W. W. Nazaroff, P. N. Price, M. D. Sohn, and A. J. Gadgil, ―Analyzing a database of residential air leakage in the United States,‖ Atmos. Environ., vol. 39, no. 19, pp. 3445– 3455, 2005.
[21] M. I. Montoya, E. Pastor, F. R. Carrié, G. Guyot, and E. Planas, ―Air leakage in Catalan dwellings: Developing an airtightness model and leakage airflow predictions,‖ in Building and Environment, vol. 45, no. 6, 2010, pp. 1458–1469.
[22] A. Sfakianaki, K. Pavlou, M. Santamouris, I. Livada, M. N. Assimakopoulos, P. Mantas, and a. Christakopoulos, ―Air tightness measurements of residential houses in Athens, Greece,‖ in Building and Environment, vol. 43, no. 4, 2008, pp. 398–405.
[23] T. Kalamees, ―Air tightness and air leakages of new lightweight single-family detached houses in Estonia,‖ in Building and Environment, vol. 42, no. 6, 2007, pp. 2369–2377.
[25] D. F. R. Alfano, M. Dell‘Isola, G. Ficco, and F. Tassini, ―Experimental analysis of air tightness in Mediterranean buildings using the fan pressurization method,‖ in Building and Environment, vol. 53, Elsevier Ltd, 2012, pp. 16–25.
[26] T. O. Relander, S. Holøs, and J. V. Thue, ―Airtightness estimation - A state of the art review and an en route upper limit evaluation principle to increase the chances that wood-frame houses with a vapour- and wind-barrier comply with the airtightness requirements,‖ in Energy and Buildings, vol. 54, Elsevier B.V., 2012, pp. 444–452.
[27] N. Van Den Bossche, W. Huyghe, J. Moens, A. Janssens, and M. Depaepe, ―Airtightness of the window-wall interface in cavity brick walls,‖ in Energy and Buildings, vol. 45, Elsevier B.V., 2012, pp. 32–42.
[28] T. O. Relander, G. Bauwens, S. Roels, J. V. Thue, and S. Uvsløkk, ―The influence of structural floors on the airtightness of wood-frame houses,‖ in Energy and Buildings, vol. 43, no. 2–3, 2011, pp. 639–652.
[29] T. O. Relander, B. Heiskel, and J. S. Tyssedal, ―The influence of the joint between the
basement wall and the wood-frame wall on the airtightness of wood-frame houses,‖ in Energy and Buildings, vol. 43, no. 6, Elsevier B.V., 2011, pp. 1304–1314.
[30] J. Langmans, R. Klein, M. De Paepe, and S. Roels, ―Potential of wind barriers to assure airtightness of wood-frame low energy constructions,‖ in Energy and Buildings, vol. 42, no. 12, Elsevier B.V., 2010, pp. 2376–2385.
RESEARCH PROPOSAL
DEVELOPING A MORE RELIABLE MODEL FOR PREDICTING BUILDING
AIRTIGHTNESS
ANALYSIS OF BUILDING AIRTIGHTNESS MEASUREMENTS IN DUTCH RESIDENTIAL BUILDINGS
Table of Contents
Abstract 31
1. Introduction 31
1.1. Background 31
1.2. Airtightness of Buildings in the Netherlands 32
2. Research Design 35
Scope of study 35
3. Research method 37
3.1. Phase 1: Literature Review 37
3.2. Phase 2: Analysis 37
3.3. Phase 3 Model Testing 38
3.4. Implications and Limitations 38
3.5. Scheduling 39
4. Literature Review 40
4.1. Introduction 40
4.2. Relevant Terms in Building Airtightness 40
Air infiltration 40
Air leakage rate 40
Air permeability 41
4.3. Measuring building airtightness 41
4.4. Estimating Building Airtightness 42
Airtightness Estimation Research 43
Variables 44
4.5. Preliminary Conclusion 46
References 46
Appendix 50
Nomenclature 50
Symbol and Units 50
ABSTRACT
There is an increasing awareness for building airtightness. This is due to the need to save energy, as well as follow dictates of building regulations, which state that contractors and house owners must comply with certain minimum requirements. To determine whether a building meets the minimum requirements or not, they are tested for their air permeability level with a blower door after completion. The uncertainty of meeting these requirements of building airtightness measurements, encouraged stakeholders to attempt to predict results as accurately as possible prior to completion. There have been many researches in the past on measuring building airtightness, but none of them seem to supersede the results of blower door measurements. This research, therefore, aims at improving the existing model to predict building airtightness. This is done by studying the variables of building characteristics, which will be deduced from past studies, that influence the airtightness of building envelope. The plan is to incorporate results in a stronger model that will be derived from linear regression.
1. INTRODUCTION 1.1. Background
The buildings sector incurs a significant portion of energy use in the world. With the issue of sustainability getting more important, several attempts are being made to reduce the energy use of buildings by improving their energy efficiency. Different stakeholders across the world such as governments, scientists and environmentalists recognise the impact of energy efficiency on building. The development and rising demand on zero-energy, energy neutral buildings, high-efficiency buildings and smart buildings have motivated the actors in the construction industry to innovate. The focus is still the same: to reduce the energy needs of buildings. Therefore, innovation in the building technology area has rapidly developed, not only to reduce the energy needs but also to comply with the current regulation.
An energy-efficient building can be achieved either through active or passive strategies. Measures such as improving heating ventilation and air conditioning (HVAC) system, installing a solar panel, etc. are categorized as active strategies, while improving the quality of the building envelope is categorized as passive strategy [3]. Building envelope improvement includes improvement of the wall, window and door penetration, and roofs. An obvious example of passive strategy is the concept of ―passive house‖, which requires certain measures of improving the heat resistance and airtightness of the building envelope(air permeability N50 of 0.6 ACH). Moreover, not every household can afford to
apply active energy efficient strategies because improvement on building envelope element—such as by improving the thermal insulation and building airtightness to reduce heat loss—is suggested and regulated in the building code.
Airtightness is considered important for improving the energy efficiency of buildings, especially if one is following the passive energy efficient strategy. Building airtightness has been included in the regulations in many countries to achieve energy efficient buildings. It is in most cases usually measured in terms of air permeability level. The term ―airtightness‖ pertains to the intensity of the uncontrolled flow of air through the building envelope as a result of pressure differences between interior and exterior air[4]. Building airtightness is closely related to air infiltration or air leakages within the building as the level of airtightness achieved is often measured as air permeability (m3/h.m2) at 50 Pa, that is, the quantity of air (in m3) that leaks into or out of the dwelling per hour, divided by the internal area (in m2) of the building fabric at 50 Pa [1].