The implementation of a cost
price model in an ERP system
Industrial Engineering and Management | University of
Twente
i
Preface and reading guide
All of the data provided in this document is fictional and does therefore not reflect reality.
This thesis is written in order to complete the bachelor Industrial Engineering and Management at the University of Twente. The assignment is performed over the course of ten weeks from the 16th of April to
the 29th of June 2018.
There are a number of people that we would like to thank for their contribution to this research. First of all, we would like to thank Company X. We have been welcomed with arms wide open, which made us feel at ease from the very start. Furthermore, they provided a strong foundation for us to work on. Whenever we were in need of help, we could always swing by and our questions would be appropriately answered. In particular, we would like to thank the first supervisor. We had daily conversations with him on the progress and he managed to guide us in a great manor. Next to the first supervisor, the BI-specialist has played a big part in this research. He was the first person we would go to if we had any questions and he always did his best to provide the answers that we were looking for. Furthermore, our thanks go to the controller, who had the function of second supervisor. We had meetings with the first supervisor, the BI-specialist and the controller on the progress every two weeks. These meetings were very useful as they provided us with more information on the subject each time. Furthermore, we would like to thank the supervisor from the University of Twente Reinoud Joosten for his efforts. Next to that, we thank Berend Roorda for his role as second reader.
ii
Research information
General information
Research title: The implementation of a cost price model in an ERP system. Description: The old system is not able to cope with significant growth
of the company during recent years. A new ERP system has been implemented to solve this issue, but some financial control models can only be implemented in a limited way at this moment. Our research focusses on the cost price model because this is prioritized by the company.
Graduate information
Name: Roman Arend Berkel Date of Birth: 06-04-1997
Study: Industrial Engineering and Management
Supervisor University of Twente
First supervisor: Reinoud Joosten Second supervisor: Berend Roorda
Graduation information
iii
Executive summary
We conducted our research at a company called Company X. Company X used to implement a stand-alone system focussed on production called ERP system X and an accounting package to cope with the constantly changing market and the unique customer needs. There is a problem however. ERP system X has been used since the 00’s and has become too static to cope with the current market, which constantly changes. This has led to the purchase of a multi-location package in 2009. However, Company X was the only major company to which the package was sold. Therefore, the company lost interest in developing this particular package.
Company X started to implement ERP system Y during the last five years. Once the ERP system was finally implemented, ERP system Y was not fully ready to be implemented yet because several functions of ERP system X were not altered significantly enough to be implemented effectively. A part of the unfinished functions consists of the financial control models. Some of these models can only be implemented in a limited way as they are not altered enough to ERP system XY. This especially holds true for the cost price model. Our research therefore focusses on shaping the new cost price model in order to effectively be integrated into ERP system XY. The cost price model has not been updated pro-actively for five years. One could argue that it is quite unusual not to update the cost price model for that amount of time. However, the company was constantly focussing on the implementation of ERP system Y. At first, the deadline of implementation was set at nine months after purchase. The company failed to meet this deadline by a long stretch however. New deadlines were constantly set from then on. Company X was not able to meet any of these deadlines. It was not until five years from purchase that the implementation finally occurred. Therefore, the cost price model was not prioritised and neglected. We define our problem as follows:
The current cost price model does not satisfy Company X’s needs
We intended to solve this problem by doing research on the following topics:
The definition of the cost price.
The method of the cost price.
The insight in the premium services.
The integration between the cost price model and the other financial control models.
The implementation of the cost price model in ERP system XY. These topics resulted in the following deliverables:
The income statement
iv
The results per department
The results per department are crucial in the calculation of the cost price model. We critically assessed this model and made the following changes:
Departments: the update on the departments greatly contributed to the quality of the results per
department. The company has changed so much that the departments did not represent the company anymore. We added new distribution departments, production departments and supporting departments to the model.
Sales departments: in the previous results per department, the revenue was used to determine
the results per department. This has changed because of ERP system XY. Currently, all of the revenue of a location is transferred to an individual sales department. Instead of the revenue, a coverage is used to calculate the results per department. The company does not want to have internal profits or losses within the company. Therefore, the coverage is used to deal with the costs associated with the department as well. Ideally, subtracting the costs from the coverage amounts to zero. In this case, the coverage equals the costs and no internal profit nor loss is made.
Allocation bases: the direct costs are very easy to attribute to the cost centres. This is however
not the case for the indirect costs and therefore, allocation bases have to be used. Allocation bases are usually based on the cost driver of the specific cost centre. We managed to find an allocation base for every cost centre.
The results per location
The step towards the results per location is rather small because the current results per department make use of sales departments. By subtracting the internal gross profit and the cost price of goods sold from the revenue per sales department, we obtained the result per sales department. This was not the final value however. We still needed to deal with the other departments. The results per department were added to the corresponding sales department (for example Cooler Location A is linked to Sales Location A). When all of the results were added, we obtained the results per location.
The functional/technical design of a new production cost price model/distribution cost price model
v
The functional/technical design of the premium service models
The lack of insight into how the premium services that Company X provides translate into costs and benefits was seen as a problem by the company. The common factor of these services is that they provide a varying level of detail, while they do not incur additional costs for the customer. The improved insight and the application of additional costs for premium services were obtained by modelling the premium services of the company. The services that are modelled are the distribution, quality, project management, administration, and ICT services. These costs have to be removed from the cost centres they are currently assigned to. Next, the costs should be added to the service department.
This means that we first had to identify which costs are associated with the different services. This was done by going through all of the cost objects and then assigning it to one of the services if possible. For example, the cost object logistics/transportation of goods was assigned to the service distribution. Once this was established, these cost objects were further analysed to see which costs it consisted of. The main purpose of this analysis, was to identify which costs had to be removed from which cost centres. Next to that, if we were able to notice a cost driver that was significantly higher than all of the other costs, we had an indication of a possible indicator that we could use for the premium service model. The last step was to subtract the costs from the associated cost centres and add these to the services.
The advisory report
We were able to construct the model, but we are not present once the model is implemented. We recommend the following actions to be performed in the future:
Remove the premium service from the cost price model.
Construct more premium service models.
Obtain the missing data needed to calculate the models.
Update the data with which the indirect variable costs are calculated.
Ask for an extra fee for the premium services by applying vendor lock-in/dependency.
Analyse the results as described in our research.
vi
Management samenvatting
Het onderzoek werd gedaan bij een bedrijf genaamd Company X. Company X implementeerde een systeem gefocust op productie genaamd ERP system X en een boekhoud pakket om met de constant veranderende markt en de unieke eisen van de klant om te kunnen gaan. Er is echter een probleem. ERP system X is gebruikt sinds de jaren 00 en is te statisch geworden. Dit heeft geleid tot het kopen van een pakket voor verschillende locaties in 2009. Company X was echter het enige grote bedrijf naar wie het pakket verkocht werd. Daarom verloor het bedrijf interesse in het ontwikkelen van dit specifieke pakket. Company X begon met het implementeren van ERP system Y gedurende de laatste vijf jaar. Toen het systeem eenmaal werd geïmplementeerd, was het systeem was nog niet klaar om volledig geïmplementeerd te worden, omdat sommige functies van ERP system X niet dermate veranderd zijn zodat ze volledig geïmplementeerd kunnen worden. Een deel van de onvolledige functies bestaat uit de financiële beheersingsmodellen. Een aantal van deze modellen kunnen alleen gedeeltelijk geïmplementeerd worden. Dit geldt vooral voor het kostprijs model. Het onderzoek zal zich dan ook focussen op het modelleren van het nieuwe kostprijs model zodat deze effectief geïntegreerd kan worden in het ERP systeem. Het kostprijs model is niet proactief geüpdatet sinds 5 jaar. Zoiets komt niet vaak voor in een groot bedrijf. De reden hiervoor is dat het bedrijf constant aan het focussen was op de implementatie van ERP system Y. De deadline van implementatie was initieel gesteld op negen maanden na de aankoop van het systeem. Het bedrijf was niet in staat om aan de deadlines voldoen. Er werden constant nieuwe deadlines gezet vanaf dat moment. Het bedrijf was echter telkens niet in staat om deze deadlines te halen. Pas na vijf jaar na aankoop werd het systeem dan eindelijk geïmplementeerd. Dit is de reden dat het kostprijs model geen prioriteit had. We definiëren het probleem als volgt:
Het huidige kostprijsmodel voldoet niet aan de eisen van Company X
We wilden dit probleem oplossen door onderzoek te doen naar de volgende onderwerpen:
De definitie van de kostprijs.
De methode van de kostprijs.
Het inzicht in de premium services.
De integratie tussen het kostprijs model en de andere financiële beheermodellen.
De implementatie van het kostprijs model in ERP system XY. Deze onderwerpen resulteerden in de volgende documenten:
De winst-en-verlies rekening
vii
De resultaten per afdeling
De resultaten per afdeling zijn cruciaal in het berekenen van het kostprijs model. We hebben kritisch het model bekeken en hebben de volgende veranderingen doorgevoerd:
Afdelingen: de update van de afdelingen dragen voor een groot deel bij aan de verbetering van
de resultaten per afdeling. Het bedrijf is zo drastisch veranderd dat de afdelingen het bedrijf niet meer vertegenwoordigen. We hebben nieuwe distributieafdelingen, productieafdelingen en ondersteunende afdelingen aan het model toegevoegd.
Verkoopafdelingen: in de vorige resultaten per afdeling, werd de omzet gebruikt om de resultaten
per afdelingen te bepalen. Dit is echter veranderd door ERP system XY. Tegenwoordig wordt alle omzet van een locatie toegewezen aan een individuele verkoopafdeling. In plaats van omzet, wordt er nu een dekking gebruikt om de resultaten per afdeling te bepalen. Het bedrijf wil geen interne winsten of verliezen hebben. Daarom, wordt er een dekking gebruikt om met de kosten van de afdelingen om te kunnen gaan.
Verdeelsleutels: de directe kosten kunnen zeer gemakkelijk gelinkt worden aan de
kostenplaatsen. Dit is echter niet het geval voor de indirecte kosten en daarom worden er verdeelsleutels gebruikt. Deze sleutels zijn meestal gebaseerd op de meest prominente kosten object dat gelinkt is aan de specifieke kostenplaats. We hebben een verdeelsleutel voor elke kostenplaats kunnen vinden.
De resultaten per locatie
Omdat de huidige resultaten per afdeling gebruik maken van verkoopafdelingen is de stap naar de resultaten per locatie erg klein. Door de interne winst en de kosten voor het verkopen van goederen af te trekken van de omzet per verkoopafdeling, verkregen we het resultaat per verkoopafdeling. Dit was echter niet de laatste stap. We moesten nog steeds de andere afdelingen bij de calculatie betrekken. De resultaten per afdeling werden toegevoegd aan de corresponderende verkoopafdelingen. Toen alle resultaten bij elkaar opgeteld werden, verkregen we de resultaten per locatie.
Het functioneel/technisch ontwerp voor het nieuwe productie/distributie kostprijs model
Het bedrijf wilde dat we kritisch keken naar de methode die zij op dat moment gebruikten om het oude kostprijs model mee te berekenen. Dit resulteerde in een keuze en een uitleg waarom deze keuze gemaakt werd. Na een literatuurstudie, waren we in staat om te concluderen dat Company X de kostenplaatsenmethode toe moest passen. Deze methode biedt een gemiddelde accuraatheid, maar dit veranderd worden door meer specifieke kostenplaatsen te gebruiken. Daarnaast is de methode makkelijk om in de praktijk te brengen en past hij bij het type bedrijf.
viii We zijn erin geslaagd om de dekkingen te berekenen en dit resulteerde in een significante verbetering van het productie kostprijs model door de geüpdatet data waarop het gebouwd was. We zijn het niet eens met de huidige calculatie, maar het bedrijf besliste dat we geen onderzoek zouden doen in deze calculatie door een tekort aan tijd.
Het functioneel/technisch ontwerp voor de premium servicemodellen
Het gebrek aan inzicht in hoe de premium service die Company X aanbiedt zich vertalen naar kosten en baten werd gezien als een probleem. Het gemeenschappelijke kenmerk van deze services is dat ze allemaal een verschillend niveau van detail aanbieden, terwijl ze geen extra kosten in rekening brengen. Dit verbeterde inzicht en het in rekening brengen van extra kosten voor deze services kunnen verkregen worden door de services te modelleren. De services die gemodelleerd worden zijn distributie, kwaliteit, projectmanagement, administratie en ICT services. Deze kosten moeten verwijderd worden van de kostenplaatsen waar ze op dit moment aan toegewezen zijn. Daarna moeten deze kosten toegevoegd worden aan de serviceafdelingen.
Dit betekent dat we eerst moesten identificeren welke kosten geassocieerd worden met de verschillende services. Dit is gedaan door alle kost objecten te analyseren en ze toe te wijzen aan een van de services indien mogelijk. Bijvoorbeeld, het kost object logistiek/transport van goederen werd toegewezen naar de service distributie. Toen dit gedaan was, werden deze kost objecten verder geanalyseerd om te zien uit welke kosten ze bestonden. De belangrijkste functie van deze analyse was om erachter te komen welke kosten verwijderd moest worden van welke kostenplaatsen. Als we zagen dat een prominent kost object significant hoger was dan alle andere kosten, dan hadden we een indicatie van een mogelijke indicator die we konden gebruiken in het premium servicemodel. De laatste stap was het verwijderen van de kosten van de kostenplaatsen en deze toe te voegen aan de services.
Het adviesrapport
We zijn in staat gebleken om het model te maken, maar we zijn niet aanwezig wanneer het model geïmplementeerd wordt. We raden de volgende acties aan om in de toekomst uitgevoerd te worden:
Verwijder de premium services van het kostprijs model.
Ontwikkel het distributie premium servicemodel verder en maak de premium servicemodellen. Verkrijg de benodigde data voor het calculeren van de modellen.
Update de data waarmee de indirecte variabele kosten berekend worden.
Eis een extra vergoeding voor het aanbieden van de premium services door vendor lock-in/dependency.
Analyseer de resultaten zoals beschreven in ons onderzoek.
ix
List of figures
Figure Description
Figure 1.1 The timeline of the ERP system development. Figure 1.2 The Problem Cluster.
Figure 1.3 The five different parts of the research.
Figure 1.4 A detailed representation of the different components involved in the research and their relationships.
Figure 1.5 The foundation on which the cost price model is built. Figure 3.1 Examples of premium pricing.
Figure 3.2 The example of delivering products.
Figure 4.1 The steps involved in the primitive mark-up method. Figure 4.2 The steps involved in the sophisticated mark-up method. Figure 4.3 The steps involved in activity-based costing.
Figure 4.4 The steps involved in time-driven activity-based costing. Figure 4.5 The steps involved in the absorption method.
Figure 4.5 A schematic representation of the costing method.
Figure 4.6 The percentage of costs that should be attributed to the other department. Figure 4.7 Allocation by the direct method.
Figure 4.8 Allocation by the step-down/sequential allocation method. Figure 4.9 Allocation by the reciprocal method.
Figure 4.10 A schematic representation of the costing method. Figure 4.11 The characteristics of the costing methods.
Figure 4.12 The characteristics of the allocation methods. Figure 5.1 The calculation of the distribution cost price model.
Figure 5.2 The different modules that play a role in the distribution cost price model and their relationship.
Figure 5.3 The calculation of the production cost price model.
Figure 5.4 The different modules that play a role in the production cost price model and their relationship.
x
List of tables
Table Description
Table 2.1 The definitions of revenue and expenses. Table 2.2 The calculation of the financial metrics. Table 2.3 An example of an income statement. Table 3.1 The data of the example.
Table 3.2 The distance and time between point A and B. Table 4.1 The example of the primitive mark-up method. Table 4.2 The example of the sophisticated mark-up method. Table 4.3 The data of the ABC example.
Table 4.4 The allocation of the costs on the basis of the cost drivers. Table 4.5 The allocation of the activities to the products.
Table 4.6 Adding all of the costs.
Table 4.7 Determining the costs per minute. Table 4.8 Attributing the activities to the products. Table 4.9 Adding all of the costs.
Table 4.10 The calculation of the raw material costs. Table 4.11 The calculation of the variable costs. Table 4.12 The calculation of the cost price.
Table 6.1 The cost centres and their cost driver and allocation base. Table 6.2 The costs that have to be allocated.
Table 6.3 The calculation of the costs per department.
xi
List of concepts
Table/figure Description
Advisory report A report on the recommendations on future research and advice in general.
Cost object Any item for which costs are being separately measured.
ERP system An IT system that helps businesses run important processes, such as financials, materials planning and human resources.
Functional/technical design
A detailed description of the way in which a system satisfies all of the needs and how these needs are implemented in real life.
Income statement A financial statement that reports a company’s financial performance over a specific accounting period.
Integral cost price A cost price that equals all of the costs involved from manufacturing to delivering the product.
Problem cluster A tool that illustrates problems and their relationships to create coherence between the different problems and to identify the core problem.
Production cost price
A cost price that equals all of the costs, which are incurred when the product leaves the company.
xii
Content
Preface and reading guide ... i
Research information ... ii
Executive summary ... iii
Management samenvatting ... vi
List of figures ... ix
List of tables ... x
List of concepts ... xi
1. The research design ... 1
1.1 The problem context ... 1
1.2 The problem identification ... 2
1.3 The research design ... 4
1.4 The deliverables ... 5
1.5 The financial models ... 6
2. The definitions of the general cost price model... 7
2.1 The theory on the income statement ... 7
2.2 The current income statement ... 9
2.3 The recommendations on the income statement ... 9
3. The premium service models ...10
3.1 The problem identification of the premium services ... 10
3.2 The premium services ... 11
3.2.1 Which premium services should be modelled? ... 12
3.2.2 How can the selected premium services be modelled? ... 13
3.3 The relationship between the customer and the premium service models ... 13
3.3.1 The indicators ... 13
3.3.2 The calculation of the value ... 16
4. The costing method ...20
4.1 The theory on the costing method ... 20
4.2 The current costing method ... 29
xiii
5. The implementation in ERP system XY ...31
5.1 The distribution cost price model ... 31
5.1.1 The current implementation in ERP system XY ... 31
5.1.2 The implementation of the new cost price model in ERP system XY ... 32
5.2 The production cost price model ... 32
5.2.1 The current implementation in ERP system XY ... 32
5.2.2 The implementation of the new cost price model in ERP system XY ... 33
6. The deliverables ...34
6.1 The income statement ... 34
6.2 The results per department ... 34
6.3 The results per location ... 40
6.4 The functional/technical design of the new production cost price model ... 40
6.5 The functional/technical design of the distribution cost price model ... 41
6.6 The functional/technical design of the premium service models ... 41
7. The advisory report ...42
8. The conclusion and discussion ...46
9. The references ...48
1
1. The research design
Section 1 can be seen as a brief summary of the project plan. We the problem context, the problem identification, the research design, the research questions, the deliverables and the financial models.
1.1
The problem context
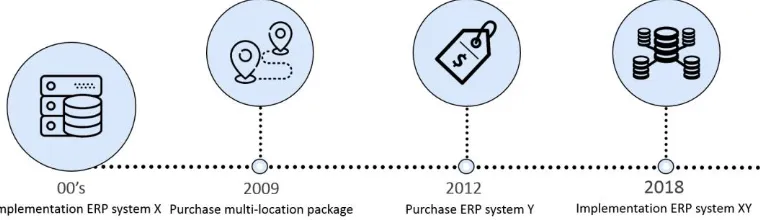
[image:15.612.119.499.276.386.2]Company X used to implement a stand-alone product focussed on production called ERP system X and an accounting package to cope with the constantly changing market and the unique customer needs. There is a problem however. ERP system X has been used since the 00’s and has become too static. This has led to the purchase of a multi-location package in 2009. However, Company X was the only major company to which it was sold. Therefore, the company lost interest in developing this particular package. Figure 1.1 shows the timeline.
Figure 1.1: the timeline of the ERP system development.
Company X started to implement ERP system Y during the last five years. Once implemented, ERP system Y was not fully ready to be implemented yet because several functions of ERP system X were not altered significantly enough to be implemented effectively. Therefore, Company X first applies the system ERP system XY. This means that ERP system Y is implemented, but the production segment of ERP system X is still used. The final version of ERP system Y will be implemented once ERP system XY is running consistently and the unfinished parts have been dealt with appropriately.
2
1.2
The problem identification
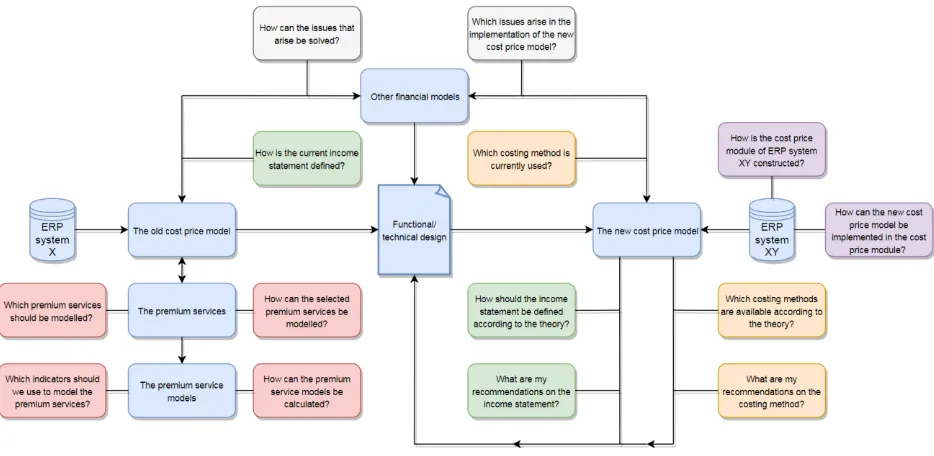
Company X wants to know how the cost price model should take shape in order to be effectively integrated into ERP system XY. This problem is however very vague because it does not state which causes underlie the problem. Therefore, we use a Problem Cluster to identify the core problem. A Problem Cluster illustrates the different problems and their relationships. It is used to create coherence between the different problems and to identify the core problem. It is based on the information provided by Company X. The Problem Cluster is visualized in Figure 1.2.
Figure 1.2: the Problem Cluster.
Company X states that the cost price model does not meet its criteria for implementation in ERP system XY. The Problem Cluster shows that this is caused by six problems:
Poor integration between the cost price model and the other financial models.
Poor integration between the cost price model and ERP system X.
Lack of insight into how the premium services influence the cost price.
The definition of the cost price is outdated.
The definition of the cost price is unclear.
ERP system X is a stand-alone system focussed on production, while ERP system XY is an ERP system.
3
The current cost price model does not satisfy Company X’s needs
The problem statement does not clearly state which needs the model does not comply to. Therefore, indicators are used to gain insight and concretise the variable ‘satisfaction of Company X’s needs’. The Problem Cluster states the problems that have to be dealt with to obtain the new cost price model. The poor integration between the old cost price model and ERP system X will not be dealt with in the implementation of the new cost price model because ERP system XY is used instead of ERP system X. The problems are shortly elaborated upon in order to alter them into insightful indicators:
The definition of the cost price: Company X wants to have a document in which all the aspects of
the cost price are defined in terms of cost objects.
The method of the cost price: the company wants us to have a critical look at the method that is
used to construct the old cost price model and whether a different method should be used when creating the new cost price model. This results in a choice of method and an explanation on why this method is chosen.
The insight in the premium services: Company X wants us to give more insight into how the
premium services affect the company.
The integration between the cost price model and the other financial control models: we will
clearly state how the new cost price model affects the other financial models or vice versa and how possible issues can be solved accordingly.
The implementation of the cost price model in ERP system XY: the company wants the model to
4
1.3
The research design
[image:18.612.120.494.126.324.2]Before the research questions can be defined, the research is divided into the five phases visualized in Figure 1.3.
Figure 1.3: the five different parts of the research.
[image:18.612.72.539.395.623.2]The questions related to the five phases are described in Figure 1.4. The phases and questions can be matched by the corresponding colours.
5
1.4
The deliverables
At the end of the research, we provide the following deliverables:
The income statement: as the income statement is a vital part of the cost price model, we have
to make sure that this model is well defined. We therefore deliver an income statement, which is built up logically and contains clear definitions.
The results per department: these are essential for the cost price model as well. Therefore, we
want to create an updated model. This is possible because of the new way in which the hierarchy in ERP system XY is modelled.
The results per location: the results per location are not necessary for the construction of the cost
price model. However, this is one of the financial models that Company X wants to gain more insight in. Next to that, the step from the results per department to the results per location is quite small.
A functional/technical design of the new distribution cost price model: such a design can be seen
as the blueprint to build a cost price model. We will not actually build the cost price model into ERP system XY, due to time constraints and a lack of skills. Therefore, the design will be implemented by the BI-specialist. This research would probably be too extensive to conduct within the timeframe of ten weeks if we conduct research on all products of Company X. There are three types of products that Company X sells: distribution goods, production goods and exceptions. We choose to not conduct research into the exceptions because these are too arbitrary.
A functional/technical design of the new production cost price model: once the
functional/technical design of the distribution cost price model has been developed, we continue by creating a similar design for the production cost price model.
A functional/technical design of the premium service models: these models should become the
foundation upon which the added value per customer model can be built.
An advisory report: it is unknown if we are able to finish the design because the research could
6
1.5
The financial models
[image:20.612.72.544.312.514.2]The research can be divided into three parts. The first part is Section 1 and is a summary of the project plan, which discusses the research design. The second part consists of Section 2 to 5 in which the current situation, the theory and the recommended actions are discussed. The last part consists of Section 6 to 8, which presents the deliverables, the advisory report, and the conclusion and discussion. Although the financial models are an essential part of the research, there is no individual section dedicated to the financial models. This decision is made because the financial models are discussed during the course of the other sections. The income statement for example is discussed to quite some extent in the section on definitions because the definitions arise from the statement. Furthermore, the results per department are already analysed in the section on the methods because the current method makes use of the results per department.
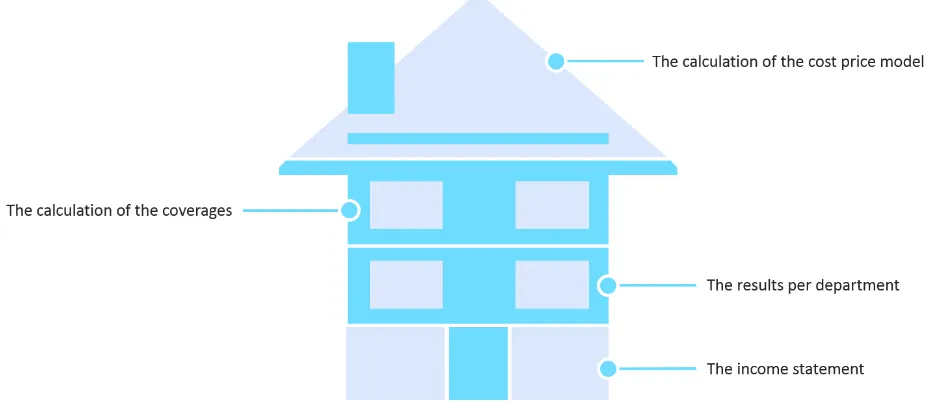
Figure 1.5 shows the different parts involved in the cost price model. It shows that the income statement is the base upon which the whole model is built. This means that if we do not critically assess the definitions, the whole model will come crumbling down.
7
2. The definitions of the general cost price model
In this section, the definitions of the costs of Company X are discussed. All of the costs are stated in the income statement of the company. First, the theory on the income statement is covered. Next, the current income statement is discussed, after which the recommendations are discussed.
2.1
The theory on the income statement
According to Averkamp (2018), there are two ways to compute an income statement. The single-step method uses only one subtraction to come to the net income, while the multiple-step method uses multiple subtractions to obtain the net income. The multiple-step method is generally preferred over the single-step method because the multiple-step method clearly states the gross profit amount, the operating income and the net amount for all the items stated on the income statement.
The income statement reports on making and selling activities of a business over a period of time. The income for the period equals what is sold in the period minus what it costs to make minus selling and general expenses for the period. There is no standard way in which the income statement should be computed. There are a number of cost objects that tend to be implemented in such a statement however. A differentiation between revenue and expenses is made. Table 2.1 shows this differentiation.
Object Definition
Revenue Income that flows into the organization
Operating revenues Only those revenues derived from the provision of sales or services depending on the nature of the organization
Non-operating revenues Revenues that an organization earns outside of selling goods and services
Expenses All of the costs incurred during the period
Operating expenses The costs incurred in order to earn normal operating revenues
Non-operating expenses Costs that are not associated with the primary activities of buying and selling goods or services
Table 2.1: the definitions of revenue and expenses.
8
Object Definition Calculation
Gross margin Gross margin is obtained by subtracting the COGS from the operating revenue
Operating revenues – cost of goods sold Operating income Operating expenses are subtracted from the gross
profit to come to the operating income
Gross profit – operating expenses Non-operating
income
Non-operating income is obtained by subtracting the non-operating expenses from the non-operating revenues
Non-operating revenues – non-operating expenses Net income Adding the operating income to the non-operating
income results in the net income
[image:22.612.71.547.69.212.2]Operating income + non-operating income
Table 2.2: the calculation of the financial metrics.
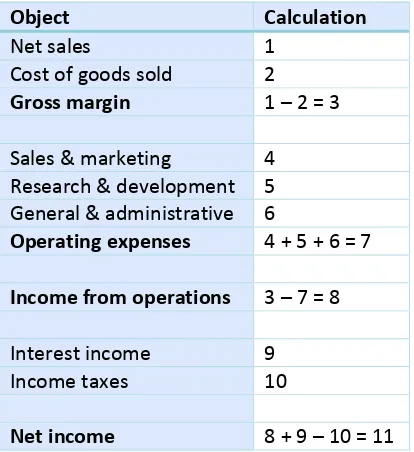
The tables provide a general overview of what the income statement should contain and how the statement is calculated. These terms can however become more accurate when more costs are added to them. This is entirely up to the company as long as all of the costs are covered by the statement. An example of how this can be done is given by Ittelson (2009). Table 2.3 provides this example. It shows that the operating expenses are divided into sales and marketing, research and development and general and administrative, while the non-operating income consists of the interest income and the income taxes.
Object Calculation
Net sales 1 Cost of goods sold 2
Gross margin 1 – 2 = 3
Sales & marketing 4 Research & development 5 General & administrative 6
Operating expenses 4 + 5 + 6 = 7
Income from operations 3 – 7 = 8
Interest income 9 Income taxes 10
Net income 8 + 9 – 10 = 11
[image:22.612.204.411.349.575.2]9
2.2
The current income statement
All of the costs that apply to Company X are stated in ERP system XY. We created an overview of the data in ERP system XY for ourselves. This document divides the costs into different cost objects by using different levels. The income statement is categorized in direct and indirect costs. The direct costs can directly be attributed to a department in a certain period. This is not the case for indirect costs however. These costs have to be attributed to a department by using allocation bases. This division is used because it makes sure that all of the costs are applied when calculating the net result of a department in a certain period of time.
2.3
The recommendations on the income statement
10
3. The premium service models
This section introduces the idea of constructing individual models for the premium services, after which the premium services are provided. Next, indicators of the premium service costs are discussed. The construction of the premium service models is dealt with next.
3.1
The problem identification of the premium services
Company X adheres to a unique mission: the customer is king. It complies to this mission extremely well, in contrast to many other companies who claim to do so. This mission implies that every wish can be fulfilled. The level in which Company X serves its customers is quite astonishing.
On the one hand, this can be seen as the unique selling point of Company X. On the other hand, however, one could wonder whether the company overdoes its mission. Is it profitable to provide this level of detail? Do customers really want to pay a premium for these services? The company is not able to answer these questions at the moment. Why is this the case?
The lack of insight into how the premium services that Company X provides translate into costs and benefits is the main reason as to why the questions cannot be answered. The common factor of these services is that they provide a varying level of detail from extremely basic to very extensive, while they do not incur additional costs for the customer.
One could argue that it is quite unusual for customers to pay the same price for such different services. Company X has no other choice however because of the implementation of an integral cost price. This means that one cost price is used to determine the costs of a product, no matter the level of additional services. The improved insight and the application of additional costs for premium services can be obtained by modelling the premium services that the company provides.
11
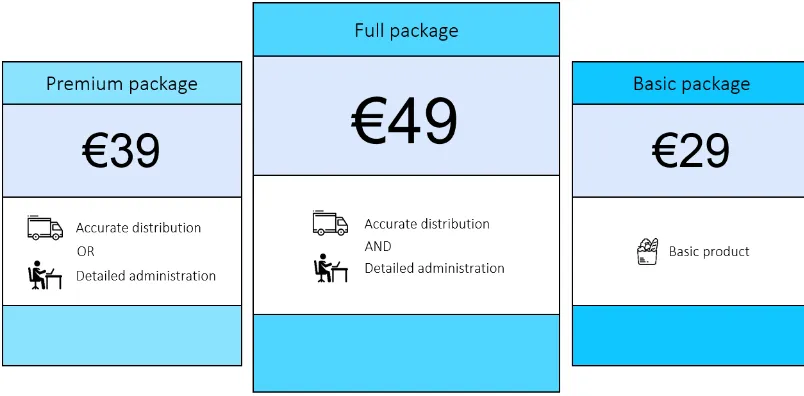
Figure 3.1: examples of premium pricing.
Premium service pricing does not only result in more insight, but perhaps even more beneficial, provides a larger market for the company to operate in. Instead of just appealing to the high segment of the market, the company can compete with companies that focus on the lower segment of the market because of the relatively low price. Furthermore, the company will not lose any of their existing clientele. Instead, the company is able to grow significantly due to the added market segment.
To offer some more insight in as to how this can be applied, let us take a look at another company, which offers premium services next to their product as well. Bol.com offers three options: delivery tonight (additional costs of €3,49), delivery tomorrow and delivery tomorrow night (additional costs of €0,99). The customer is able to customize the order according to its preferences, but might have to pay a premium when an option is chosen that involves additional costs for the company.
The customer is able to wrap the product in wrapping paper as well. Wrapping their product incurs an additional cost of €1,99. If applied correctly, the additional costs account for the process of wrapping the product and hopefully a margin of profit. The examples show that major firms apply the same principle as Company X will be able to apply if the premium services are modelled individually.
3.2
The premium services
12
3.2.1 Which premium services should be modelled?
To determine which premium services should be modelled, two criteria are used. The first criterion is the variability of the service. This shows how much the level of detail differentiates between customers. It is not valuable to model services that do not significantly show differences between customers because this implies that an integral cost price can offer an accurate calculation as well. The second criterion is the contribution to the costs of the company. If a service does not significantly contribute to the total amount of costs, modelling this service adds little value.
It is not up to us to decide which premium services should be modelled because we do not have enough insight into these services. We therefore consult Company X to determine the premium services. On the one hand, Company X does not want to model too many services because this will cause the process to become uncontrollable. On the other hand, the more services are modelled individually, the more insight is obtained. According to the criteria, the following premium services should be modelled:
Project management: the day-to-day operations are concerned with managing the projects. It
involves starting projects, while also maintaining the quality of the projects. This service should be modelled individually because one customer asks for projects specific for that customer, while another customer does not need this special treatment.
Quality: managing quality means constantly pursuing excellence; making sure that what the
company does is fit for purpose, and not only stays that way, but constantly keeps improving. The demanded quality varies significantly between different customers. For example, a certain customer can have such specific wishes that the product range may have to change. Next to that, a customer may want to get more information on product information in comparison to other customers.
Logistics: logistics is concerned with delivering the products to the customer. This entails the
whole process; from moving the products to the truck to delivering the product on the doorstep of the customer. This first reason as to why the logistics should be modelled is because it greatly contributes to the overall costs. It is actually one of the main cost objects of the company. Next to that, the level of distribution varies greatly between customers as aspects like the order quantity, the number of deliveries and the number of delivery points all affect the profitability of the service.
Management information: this term refers to the systems and people that collect, process, store
and disseminate information. Customers demand varying levels of management information. For example, one customer wishes to obtain ten management information reports, while another does not want any report at all.
ICT (information and communications technology) services: the ICT services comprise all of the
13 The descriptions of the premium services confirm that all of them are applied in different levels of detail, while every customer pays the same price for the services. Some services however incur more costs than others. Most notably, the logistics service that Company X provides is a very large part of the total amount of costs.
3.2.2 How can the selected premium services be modelled?
The premium service costs are part of the results per department. The results per department are used in the calculation of the general cost price model. Removing the services from the results per department would result in these costs not being covered in the cost price model. Therefore, a new model has to be made that uses the results per department, but removes the service costs from the departments and adds them to the services. The model is altered by adding mutations for the cost centres that affect the premium services. This mutation will remove the costs of the department and then add them to the services. The total costs will remain the same as the same amount is subtracted as added.
3.3
The relationship between the customer and the premium service models
This section describes how the customers and the premium service models are related. This is done by assigning an indicator to the relationship between the premium service and the customer. Next, the costs per unit of the indicator are determined. In the last part, the calculation of the premium service models is given.
3.3.1 The indicators
An indicator can be used to describe the relationship between the premium services and the customers. We want to achieve a model in which the costs can accurately be assigned to a certain customer. This could lead to a model in which the costs and benefits of each customer are obtained. All of the premium services are now related to an indicator:
Project management: number of hours spent on a project for an individual or some customers.
Quality: number of hours spent on quality.
Logistics: delivery address, delivery points, route and number of times per week.
Management information: number of MI reports.
ICT services: number of hours spent on linking systems on behalf of customer(s).
Because of its extremely high level of costs in comparison to the other services, logistics is the prioritized service by the company. We will conduct an in depth analysis of this service, but we will first shortly elaborate upon the other indicators.
Project management, quality and ICT services
14
Management information
There are nine different management information reports (MIR) that a company can obtain. Building such a report takes time and this differs for each report. Once the report is up and running, filing a new report is just a matter of data conversion. Data is available on how many reports are delivered on a yearly basis. More specifically, data is available on how many reports are sent to specific customers. We also know how much costs delivering these reports incur on a yearly basis. We use the following formulas in this model:
𝐶𝑜𝑠𝑡𝑠 𝑝𝑒𝑟 𝑟𝑒𝑝𝑜𝑟𝑡 = 𝑡𝑜𝑡𝑎𝑙 𝑎𝑚𝑜𝑢𝑛𝑡 𝑜𝑓 𝑐𝑜𝑠𝑡𝑠 𝑡𝑜𝑡𝑎𝑙 𝑎𝑚𝑜𝑢𝑛𝑡 𝑜𝑓 𝑟𝑒𝑝𝑜𝑟𝑡𝑠
𝐶𝑜𝑠𝑡𝑠 𝑜𝑓 𝑚𝑎𝑛𝑎𝑔𝑒𝑚𝑒𝑛𝑡 𝑖𝑛𝑓𝑜𝑟𝑚𝑎𝑡𝑖𝑜𝑛 = 𝑐𝑜𝑠𝑡𝑠 𝑝𝑒𝑟 𝑟𝑒𝑝𝑜𝑟𝑡 ∗ 𝑛𝑢𝑚𝑏𝑒𝑟 𝑜𝑓 𝑟𝑒𝑝𝑜𝑟𝑡𝑠
By dividing the costs by the total number of reports, we achieve the costs involved in one report. When we multiply this value by the number of reports sent to a specific customer, we achieve the costs of management information concerning that customer. As mentioned, the costs per report differ. This is caused by the level of detail of the report. If more time has to be spent on building a report, more costs are incurred. Unfortunately, no data are available on how much time is spent on a certain kind of report. If we want to gain more insight into the costs, we should measure how long it takes someone to build a report on average. We can then attribute a factor to the calculation of the costs. If a specific report takes 15 minutes to build for example, while the average time equals 10 minutes, then the costs should be multiplied by a factor of 1,5.
Preferably, these costs are compared to the revenue that the service creates. This service cannot be described in terms of revenue because the company does not apply a premium for the service. One could argue that some customers choose the company because of how far-reaching this service is applied. We agree, but we are not able to attribute a part of the revenue to the service because we are not sure whether this is the case. The company could however choose to budget on the basis of the costs.
Logistics
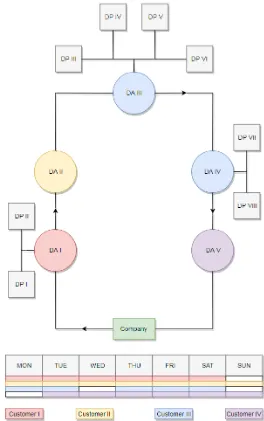
15 There are two options in the way in which the
products are delivered. The first option is to have the products transported to the delivery address. The second option is to have the products transported to the delivery address, after which Company X transports the products to one or more delivery points. A delivery point is a more detailed form of the delivery address. To illustrate this, let us take a look at DA (delivery address) I, which contains two houses. If the order is delivered to the front desk of DA I, then the customer just uses the delivery address. If the delivery is sent to the individual houses of DA I (DP (delivery point) I and DP II), then the customer makes use of several delivery points. The costs incurred with distributing to several delivery points is higher in comparison to the costs incurred in transportation to the delivery address. Furthermore, the route that the truck has to drive affects the costs as well. More costs are incurred when the delivery has to cover more distance because of an increase in fuel and wage costs. If DA I would be removed from this route for example, then the delivery would take less time because the direct route towards DA II could be taken. This would result in a decrease in costs. Next to that,
[image:29.612.276.540.71.492.2]the customers differ in how many times per week products are delivered. More costs per week are of course incurred if a customer needs delivery every day instead of five times per week. The costs of DA II would decrease if 6 deliveries instead of 7 deliveries per week were made. To summarize, the deliveries differ in terms of addresses, points, route and the number of deliveries per week.
16
3.3.2 The calculation of the value
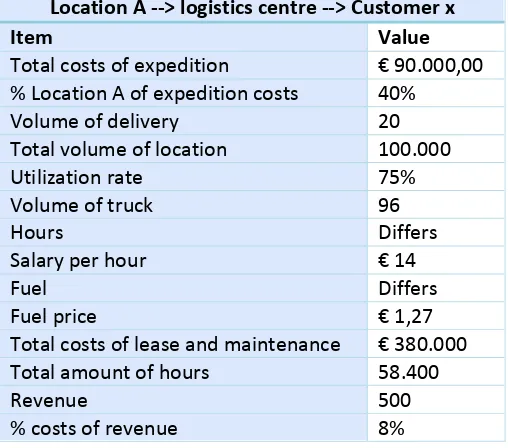
We strive to construct a model in which all of the factors are taken into account. The calculation consists of three parts: location logistics, customer logistics and lease/maintenance. We use an example accompanied by a general explanation to show how we calculate the added value per customer. The data in Table 3.1 is known regarding our example.
Location A --> logistics centre --> Customer x
Item Value
Total costs of expedition € 90.000,00 % Location A of expedition costs 40%
Volume of delivery 20 Total volume of location 100.000 Utilization rate 75% Volume of truck 96
Hours Differs
Salary per hour € 14
Fuel Differs
Fuel price € 1,27 Total costs of lease and maintenance € 380.000 Total amount of hours 58.400
Revenue 500
[image:30.612.180.434.162.386.2]% costs of revenue 8%
Table 3.1: the data of the example.
Every time a delivery leaves a location, the following formula is applied:
𝑆𝑢𝑏 𝑟𝑜𝑢𝑡𝑒 𝑐𝑜𝑠𝑡 = 𝑥 (𝑙𝑜𝑐𝑎𝑡𝑖𝑜𝑛 𝑒𝑥𝑝𝑒𝑑𝑖𝑡𝑖𝑜𝑛 𝑐𝑜𝑠𝑡𝑠 + 𝑙𝑜𝑐𝑎𝑡𝑖𝑜𝑛 𝑙𝑜𝑔𝑖𝑠𝑡𝑠𝑖𝑐𝑠 𝑐𝑜𝑠𝑡𝑠)
+ 𝑦 (𝑐𝑢𝑠𝑡𝑜𝑚𝑒𝑟 𝑒𝑥𝑝𝑒𝑑𝑖𝑡𝑖𝑜𝑛 𝑐𝑜𝑠𝑡𝑠 + 𝑑𝑖𝑟𝑒𝑐𝑡 𝑙𝑜𝑔𝑖𝑠𝑡𝑖𝑐𝑠 𝑐𝑜𝑠𝑡𝑠 + 𝑖𝑛𝑑𝑖𝑟𝑒𝑐𝑡 𝑙𝑜𝑔𝑖𝑠𝑡𝑖𝑐𝑠 𝑐𝑜𝑠𝑡𝑠 + 𝑙𝑒𝑎𝑠𝑒 𝑎𝑛𝑑 𝑚𝑎𝑖𝑛𝑡𝑒𝑛𝑎𝑛𝑐𝑒 𝑐𝑜𝑠𝑡𝑠)
𝐹𝑜𝑟 𝑥 = 0 ∨ 𝑥 = 1 𝑦 = 0 ∨ 𝑦 = 1 𝑥 + 𝑦 = 1
17
Location logistics costs
These calculations only apply if the goods are delivered to another location. There are 7 locations to which goods can be transported: Location A, Location B, Location C, Location D, Location D, Location E and the logistics centre. It is possible to ride to every location from a certain location. There are 42 routes because there are 21 possibilities to ride from one location to the other, but it is also possible to go the other way around. We are able to calculate the costs for each route. This exists of two calculations.
The first calculation provides the expedition costs. In our example, the delivery is transported from Location A to the logistics centre. When delivering goods from Location A to the logistics centre, the expedition costs are calculated over Location A because this is the location where the expedition takes place. These costs are calculated by the following formula:
𝐸𝑥𝑝𝑒𝑑𝑖𝑡𝑖𝑜𝑛 𝑐𝑜𝑠𝑡𝑠 =
(% 𝑜𝑓 𝑒𝑥𝑝𝑒𝑑𝑖𝑡𝑖𝑜𝑛 𝑐𝑜𝑠𝑡𝑠 ∗ 𝑡𝑜𝑡𝑎𝑙 𝑐𝑜𝑠𝑡𝑠 𝑜𝑓 𝑒𝑥𝑝𝑒𝑑𝑖𝑡𝑖𝑜𝑛) ∗ 𝑣𝑜𝑙𝑢𝑚𝑒 𝑜𝑓 𝑑𝑒𝑙𝑖𝑣𝑒𝑟𝑦 𝑡𝑜𝑡𝑎𝑙 𝑣𝑜𝑙𝑢𝑚𝑒 𝑜𝑓 𝑙𝑜𝑐𝑎𝑡𝑖𝑜𝑛
𝐸𝑥𝑝𝑒𝑑𝑖𝑡𝑖𝑜𝑛 𝑐𝑜𝑠𝑡𝑠 = (0,40 ∗ €90.000) ∗ 20
100.000= €7,20
By multiplying the percentage of costs that should be attributed to the location at hand by the total costs of expedition, we know how many costs are part of that location. We can assign the costs to the delivery by using the ratio between the volume of delivery and the total volume of the location. The second part exists of the logistics costs. We use the following formula to calculate these costs:
𝐿𝑜𝑔𝑖𝑠𝑡𝑖𝑐𝑠 𝑐𝑜𝑠𝑡𝑠 = 𝑣𝑜𝑙𝑢𝑚𝑒 𝑜𝑓 𝑑𝑒𝑙𝑖𝑣𝑒𝑟𝑦
𝑢𝑡𝑖𝑙𝑖𝑧𝑎𝑡𝑖𝑜𝑛 𝑟𝑎𝑡𝑒 ∗ 𝑣𝑜𝑙𝑢𝑚𝑒 𝑜𝑓 𝑡𝑟𝑢𝑐𝑘∗ (ℎ𝑜𝑢𝑟𝑠 ∗ 𝑠𝑎𝑙𝑎𝑟𝑦 𝑝𝑒𝑟 ℎ𝑜𝑢𝑟 + 𝑓𝑢𝑒𝑙 ∗ 𝑓𝑢𝑒𝑙 𝑝𝑟𝑖𝑐𝑒)
𝐿𝑜𝑔𝑖𝑠𝑡𝑖𝑐𝑠 𝑐𝑜𝑠𝑡𝑠 = 20
0,75 ∗ 96 ∗ (0,30 ∗ €14 + 5 ∗ €1,27) = €2,93
The logistics costs of a truck are calculated by multiplying the hours by the salary per hour and adding this to the multiplication of the fuel and the fuel price. We however do not need the costs of the whole truck, but we wish to obtain the costs assigned to the delivery itself. Therefore, the ratio is used. When we add these costs, we obtain the total location costs.
Customer logistics costs
18 The calculation of the costs of the route to the customer consists of three parts. The first part equals the formula that was used for the calculation of the expedition costs:
𝐸𝑥𝑝𝑒𝑑𝑖𝑡𝑖𝑜𝑛 𝑐𝑜𝑠𝑡𝑠 = (0,20 ∗ €90.000) ∗ 20
60.000= €6,00
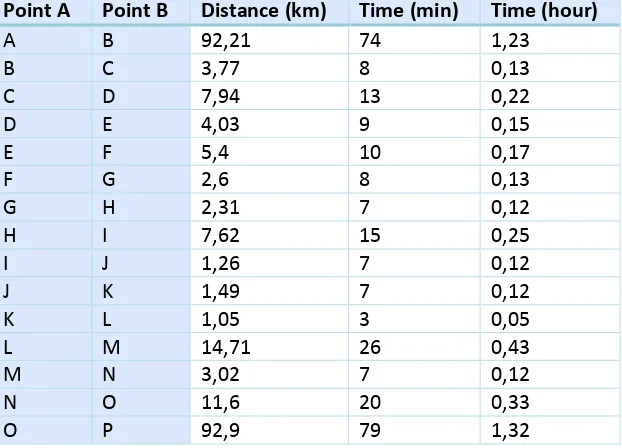
The second part is the same for each customer that is on the route. We have to use several assumptions to be able to calculate the costs, because there are so many factors that affect the process. Table 3.2 shows the distance and time that it takes to drive from point A to point B.
Point A Point B Distance (km) Time (min) Time (hour)
A B 92,21 74 1,23
B C 3,77 8 0,13
C D 7,94 13 0,22 D E 4,03 9 0,15 E F 5,4 10 0,17 F G 2,6 8 0,13
G H 2,31 7 0,12
H I 7,62 15 0,25 I J 1,26 7 0,12
J K 1,49 7 0,12
K L 1,05 3 0,05
L M 14,71 26 0,43
M N 3,02 7 0,12
[image:32.612.153.464.207.431.2]N O 11,6 20 0,33 O P 92,9 79 1,32
Table 3.2: the distance and time between point A and point B.
The table shows that the distance between customers is relatively small compared to the distance between the location and the first and last customer. If we would use the distance between arrivals, this would not reflect reality because the first and last customer will have much more costs. Because of the relatively small distance between customers, we choose to equally distribute the distance and therefore fuel over all of the customers. The costs are calculated by the same formula as the calculation of the logistics costs. If we fill this in for our example, we obtain the following:
𝐷𝑖𝑟𝑒𝑐𝑡 𝑙𝑜𝑔𝑖𝑠𝑡𝑖𝑐𝑠 𝑐𝑜𝑠𝑡𝑠 = 20
0,75 ∗ 50∗ (0,35 ∗ €14 + 3,92 ∗ €1,27) = €9,85
The third part is specific for each customer because this depends on the time that is used at the delivery address. When we subtract the time of arrival from the time of departure, we obtain the time that the chauffeur to deliver the order at the address itself. The longer he is at the address; the more costs should be incurred as he receives wage during this period of time. We calculate the costs by the following formula:
19 This formula is very straightforward and should not need any more explanation. All of the costs that are directly related to the delivery are now identified. The costs of lease and maintenance should however be included as well. The following formula is used to calculate this:
𝐶𝑜𝑠𝑡𝑠 𝑜𝑓 𝑙𝑒𝑎𝑠𝑒 𝑎𝑛𝑑 𝑚𝑎𝑖𝑛𝑡𝑎𝑛𝑐𝑒 =𝑇𝑜𝑡𝑎𝑙 𝑐𝑜𝑠𝑡𝑠 𝑜𝑓 𝑙𝑒𝑎𝑠𝑒 𝑎𝑛𝑑 𝑚𝑎𝑖𝑛𝑡𝑎𝑛𝑐𝑒
𝑇𝑜𝑡𝑎𝑙 𝑎𝑚𝑜𝑢𝑛𝑡 𝑜𝑓 ℎ𝑜𝑢𝑟𝑠 ∗ 𝑛𝑢𝑚𝑏𝑒𝑟 𝑜𝑓 ℎ𝑜𝑢𝑟𝑠
𝐶𝑜𝑠𝑡𝑠 𝑜𝑓 𝑙𝑒𝑎𝑠𝑒 𝑎𝑛𝑑 𝑚𝑎𝑖𝑛𝑡𝑎𝑛𝑐𝑒 =€380.000
58.400 ∗ 1,23 = €8,01
We calculate the amount of costs per hour by dividing the costs of lease and maintenance by the total amount of hours. If we multiply this value by the number of hours that the truck is utilized during the delivery, then we obtain the costs of lease and maintenance. The total amount of costs is calculated by the following formula:
𝑇𝑜𝑡𝑎𝑙 𝑐𝑜𝑠𝑡𝑠 = 𝑒𝑥𝑝𝑒𝑑𝑖𝑡𝑖𝑜𝑛 𝑐𝑜𝑠𝑡𝑠 + 𝑙𝑜𝑔𝑖𝑠𝑡𝑖𝑐𝑠 𝑐𝑜𝑠𝑡𝑠 + 𝑒𝑥𝑝𝑒𝑑𝑖𝑡𝑖𝑜𝑛 𝑐𝑜𝑠𝑡𝑠 + 𝑑𝑖𝑟𝑒𝑐𝑡 𝑙𝑜𝑔𝑖𝑠𝑡𝑖𝑐𝑠 𝑐𝑜𝑠𝑡𝑠 + 𝑖𝑛𝑑𝑖𝑟𝑒𝑐𝑡 𝑙𝑜𝑔𝑖𝑠𝑡𝑖𝑐𝑠 𝑐𝑜𝑠𝑡𝑠 + 𝑐𝑜𝑠𝑡𝑠 𝑜𝑓 𝑙𝑒𝑎𝑠𝑒 𝑎𝑛𝑑 𝑚𝑎𝑖𝑛𝑡𝑎𝑛𝑐𝑒
𝑇𝑜𝑡𝑎𝑙 𝑐𝑜𝑠𝑡𝑠 = €7,20 + €2,93 + €6,00 + €9,85 + €12,37 + €8,01 = €46,36
The costs have to be compared to the revenue. The company always uses 8% of the revenue as the logistics costs. Historical data shows that this percentage reflects reality very well and remains steady over time. The maximum amount of costs can be calculated by the following formula:
𝑀𝑎𝑥𝑖𝑚𝑢𝑚 𝑎𝑚𝑜𝑢𝑛𝑡 𝑜𝑓 𝑐𝑜𝑠𝑡𝑠 = 𝑟𝑒𝑣𝑒𝑛𝑢𝑒 ∗ 0,08 𝑀𝑎𝑥𝑖𝑚𝑢𝑚 𝑎𝑚𝑜𝑢𝑛𝑡 𝑜𝑓 𝑐𝑜𝑠𝑡𝑠 = €500 ∗ 0,08 = €40,00
The calculated costs exceed the maximum amount of costs, which means that it is not profitable to deliver the goods to this customer in the current construction.
20
4. The costing method
In this section, the costing method is described. The available methods according to the theory are described first, after which the current situation is described. Next, the recommendations are discussed.
4.1
The theory on the costing method
There are many different ways in which the cost price model can be constructed. We can however not discuss every method because this would take too much time. Therefore, we identified the main methods by a small literature study. These methods are now discussed in depth.
The mark-up method
When using the mark-up method, the indirect costs are attributed to the products to the extent in which they cause direct costs. This method assumes that the amount of indirect costs is proportional to the direct costs that cause the indirect costs. There are two methods that can be used when calculating the cost price by using the mark-up method: the primitive mark-up method and the sophisticated mark-up method. By applying the primitive mark-up method, the cost price is calculated by adding a percentage to the direct costs of a product. MKB (2015) states the steps in Figure 4.1.
Figure 4.1: the steps involved in the primitive mark-up method.
The steps described in Figure 4.1 are implemented in an example in Table 4.1.
The mark-up is calculated by the following formula:
𝑀𝑎𝑟𝑘 − 𝑢𝑝 =𝑇𝑜𝑡𝑎𝑙 𝑖𝑛𝑑𝑖𝑟𝑒𝑐𝑡 𝑐𝑜𝑠𝑡𝑠 𝑇𝑜𝑡𝑎𝑙 𝑑𝑖𝑟𝑒𝑐𝑡 𝑐𝑜𝑠𝑡𝑠
Primitive mark-up method Amount Mark-up Direct costs Indirect costs Total costs
Amount of products 10.000
Raw material 4.000 0,40
Direct wages 2.000 0,20
Total direct costs 6.000
Total indirect costs 1.500
Total costs 25% 0,60 0,15 0,75
21 Applying this formula to our example results in a mark-up of 25%. The direct costs per product are calculated by dividing the costs by the amount of products. When multiplying the mark-up with the direct costs per product, we obtain the indirect costs per product. The total costs simply equal the direct costs added by the indirect costs.
According to Nevi (n.d.), the primitive mark-up method has its flaws. The calculation heavily relies on the basis on which the mark-up is based. Therefore, the cost price can vary strongly if a different basis is used. Furthermore, the mark-up is based on the ratio of data of the whole company.
Therefore, some products may use a percentage that is not representative. Instead of determining one mark-up for the whole company, the sophisticated mark-up method determines a percentage for each individual group of costs. Therefore, this method is more detailed and more accurate than the primitive mark-up method. Figure 4.2 describes the steps used in the sophisticated mark-up method.
Figure 4.2: the steps involved in the sophisticated mark-up method.
We once again use an example to elaborate on the method. Table 4.2 illustrates this example.
Sophisticated mark-up method Amount Mark-up Direct costs Indirect costs Total costs
Amount of products 10.000
Raw material 4.000 30% 0,40 0,12 Direct wages 2.000 50% 0,20 0,10 Total direct costs 6.000 20% 0,12 0,60 Total indirect costs 1.500 0,34
Total costs 0,94
Table 4.2: the example of the sophisticated mark-up method.
In contrast to the primitive mark-up method, the ratio is not calculated by a formula. Instead, the percentages are given already. A different percentage is used for each individual cost item. Multiplying the percentages by the cost item it is attributed to results in the indirect costs. The difference in result in our examples between the primitive (€0,75) and sophisticated mark-up method (€0,94) shows that the two methods differ significantly.
22
Activity-based costing (ABC)
In contrast to the mark-up method and the absorption method, activity-based costing (ABC) is a refined costing system. Bhimani et al. (2008) explains that such a system reduces the use of broad averages for assigning the cost of resources to cost objects and provides better measurement of the costs of indirect resources used by different cost objects. ABC costing focusses on individual activities as the fundamental cost objects. ABC systems calculate the costs of individual activities and assign costs to cost objects such as products and services on the basis of the activities undertaken to produce each product or service. Walther and Skousen (2009) state that the method consists of the steps provided in Figure 4.3.
Figure 4.3: the steps involved in activity-based costing.
The following example stated in Table 4.3 shows that the method is harder to implement, but the results are more accurate.
Item Product A Product B Cost driver Total costs Amount of products 5.000 10.000
Cost of sales 6.000 7.000 13.000
Staff FTE 1.750
Building M2 2.830
Table 4.3: the data of the ABC example.
The amount of products and cost of sales provide information on the product itself. We want to allocate the indirect costs to the products. These costs exist of staff and building costs, which are linked to FTE and M2 respectively, and their respective costs. Table 4.4 allocates the costs on the basis of the cost drivers.
Activity FTE Staff costs M2 Building costs Total costs Make sales calls 2 500 8 400 900 Ship the order 3 750 33 1650 2.400 Make credit control calls 2 500 15,6 780 1.280 Total 7 1.750 57 2.830 4.580
Table 4.4: the allocation of the costs on the basis of the cost drivers.
23 Activity Activity driver Product A Product B Total Product A Product B Total Make sales calls # sales calls 18 12 30 540 360 900 Shipping the order # orders 10 50 60 400 2.000 2400 Make credit
control calls
# credit control calls
0 12 12 0 1.280 1280 Total 28 74 102 940 3.640 4.580
Table 4.5: the allocation of the activities to the products.
The activities are linked to the products in Table 4.5. Because of this link and the costs being allocated to the activities, we are able to allocate the costs to the two products. This results in the indirect costs being attributed to the different products. The last step is shown in Table 4.6.
Item Product A Product B Total Amount of products 5.000,00 10.000,00
Cost of sales 6.000 7.000 13.000 Overhead costs 940 3.640 4.580 Total costs 6.940 10.640 17.580 Total costs per product 1,388 1,064
Table 4.6: adding all of the costs.
This table adds the direct costs to the indirect costs to obtain the total costs. When dividing this by the amount of products, we obtain the total costs per product.
According to Turney (2010), the logic of ABC systems is that more finely structured activity-cost objects with activity-specific cost allocation bases, which are cost drivers for the cost objects, are considered to lead to more accurate costing of activities. Furthermore, ABC systems can create process oriented metrics that are not available with traditional costing methods, can be used as a means of linking sustainability initiatives with cost and finance information, provides costs of employees performing activities, and improves resource planning and allocation.
24
Time-driven activity-based costing
Time-driven activity-based costing is a variant of the ABC method and consists of the steps as described in Figure 4.4.
Figure 4.4: the steps involved in time-driven activity-based costing.
This is the most complicated method and therefore, we will explain it in more detail than the other methods. This method differentiates between transactional and effort cost drivers. Transactional cost drivers count the number of times an activity is performed. The heterogeneity of the transactions is an issue that should be solved. The first way to cope with this heterogeneity is to expand the number of activities in for example a simple order, an average order and a complex order. The resource costs have to be assigned to the three types of order-handling activities, and a transaction cost driver should be defined for each activity. The second possibility is to use duration cost drivers, which estimate the time required to perform the task. Duration cost drivers are generally more accurate than transaction cost drivers, but they are also more expensive to measure. The method only requires estimates of two parameters: the unit cost of supplying capacity and the time required to perform a transaction or an activity. The unit cost of supplying capacity is determined by dividing the cost of capacity supplied by the practical capacity of resources supplied. The cost of capacity supplied is determined by identifying the various groups of resources that perform activities. The practical capacity is estimated by determining how much time an employee or machine is working effectively.
The next aspect is the unit time estimate. The method uses an estimate of the time required each time the activity is performed. The time estimates can be obtained either by direct observation or by interviews. Rough accuracy is sufficient as precision is not critical. By multiplying the unit time with the number of times that the action is performed, a total number of minutes is acquired. Multiplying this number by the activity cost driver rate results in the total costs.
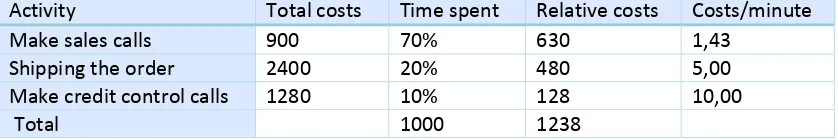
25 Activity Total costs Time spent Relative costs Costs/minute
Make sales calls 900 70% 630 1,43 Shipping the order 2400 20% 480 5,00 Make credit control calls 1280 10% 128 10,00
[image:39.612.98.517.73.143.2]Total 1000 1238
Table 4.7: determining the costs per minute.
By multiplying the total costs by the time spent, we obtain the costs that should be attributed to that activity. When dividing the total costs by the relative costs, we achieve the costs per minute. Table 4.8 shows how we attribute the activities to the products.
Activity Costs/minute Product A Product B Total Product A Product B Total Make sales calls 1,43 460 170 630 657 243 900 Shipping the
order
5,00 150 330 480 750 1.650 2.400 Make credit
control calls
[image:39.612.68.549.231.330.2]10,00 58 70 128 580 700 1.280 Total 668 570 1238 1.987 2.593 4.580
Table 4.8: attributing the activities to the products.
Data is available on how many minutes of a certain activity are spent on either product A or product B. By multiplying these minutes by the costs per minute, we obtain the costs per activity. Table 4.9 shows the last step of this method.
Item Product A Product B Total Amount of products 5.000,00 10.000,00
Cost of sales 6.000 7.000 13.000 Overhead costs 1.987 2.593 4.580 Total costs 7.987 9.593 17.580 Total costs per product 1,5974 0,9593
Table 4.9: adding all of the costs.
[image:39.612.160.454.416.503.2]