Original citation:
Brommer, Peter, de Boissieu, Marc, Euchner, Holger, Francoual, Sonia, Gähler, Franz, Johnson, Mark R., Parlinski, Krzysztof and Schmalzl, Karin. (2009) Vibrational properties of MgZn2. Zeitschrift für Kristallographie, 224 (1-2). pp. 97-100.
Permanent WRAP url:
http://wrap.warwick.ac.uk/63909
Copyright and reuse:
The Warwick Research Archive Portal (WRAP) makes this work by researchers of the University of Warwick available open access under the following conditions. Copyright © and all moral rights to the version of the paper presented here belong to the individual author(s) and/or other copyright owners. To the extent reasonable and practicable the material made available in WRAP has been checked for eligibility before being made available.
Copies of full items can be used for personal research or study, educational, or not-for-profit purposes without prior permission or charge. Provided that the authors, title and full bibliographic details are credited, a hyperlink and/or URL is given for the original metadata page and the content is not changed in any way.
Publisher statement:
Published version: http://dx.doi.org/10.1524/zkri.2009.1085
A note on versions:
The version presented in WRAP is the published version or, version of record, and may be cited as it appears here.For more information, please contact the WRAP Team at:
Vibrational properties of MgZn
2
Peter Brommer*;I, Marc de BoissieuII, Holger EuchnerI, Sonia FrancoualIII, Franz Ga¨hlerI, Mark JohnsonIV, Krzysztof ParlinskiV and Karin SchmalzlVI
I Institut fu¨r Theoretische und Angewandte Physik, Universita¨t Stuttgart, Pfaffenwaldring 57, 70550 Stuttgart, Germany
II Science et Inge´nierie des Mate´riaux et Proce´de´s, INP Grenoble CNRS UJF, Rue de la piscine 1130, 38402 St. Martin-d’He`res, France IIILos Alamos National Laboratory, National High Magnetic Field Laboratory, Los Alamos, NM 87545, USA
IVInstitut Laue-Langevin, BP 156, 38042 Grenoble, France
V Institute of Technology, Pedagogical University, ul. Podchorazych 2, 30-084 Cracow, Poland VIInstitut fu¨r Festko¨rperforschung, Forschungszentrum Ju¨lich, 52425 Ju¨lich, Germany
Received June 13, 2008; accepted August 12, 2008
Complex metallic alloys / Molecular dynamics / Neutron scattering / Dynamical structure factor
Abstract. We present here simulation results on the
dy-namical structure factor of the C14 Laves Phase of MgZn2, the simplest of the Mg–(Al,Zn) Frank-Kasper alloy phases. The dynamical structure factor was deter-mined in two ways. Firstly, the dynamical matrix was ob-tained in harmonic approximation from ab-initio forces. The dynamical structure factor can then be computed from the eigenvalues of the dynamical matrix. Alternatively, Molecular Dynamics simulations of a larger sample were used to measure the correlation function corresponding to the dynamical structure factor. Both results are compared to data from neutron scattering experiments. This compar-ison also includes the intensity distribution, which is a very sensitive test. We find that the dynamical structure factor determined with either method agrees reasonably well with the experiment. In particular, the intensity trans-fer from acoustic to optic phonon modes can be repro-duced correctly. This shows that simulation studies can complement phonon dispersion measurements.
1. Introduction
Magnesium and zinc form alloys in different degrees of complexity up to the decagonal and icosahedral quasicrys-tals in the Mg–(Al,Zn) Frank-Kasper alloy system. This system is therefore ideal to study the influence of increas-ing complexity on the vibrational properties of an alloy. As a first step in such a study, we start here with the rela-tively simple Laves phase MgZn2.
The lattice dynamics of the MgZn2 phase has been pre-viously studied by inelastic neutron scattering on a single grain crystal (see [1] for experimental conditions). Both the dispersion relation and the normalized intensity [1] have been reported. Two very different behaviors have
been observed for the transverse acoustic (TA) mode. For TA modes propagating along the TT0 direction, polarised
along the c axis, there is a strong bending of the disper-sion curve with a maximum energy of 1.7 THz. At the same time there is a strong coupling of the TA mode with a higher energy optical mode, with an intensity transfer from the TA to the optic mode. For TA modes propagat-ing along the D direction, polarised in the hexagonal plane, the dispersion relation reaches a much higher en-ergy equal to 2.6 THz, and the normalized intensity re-mains almost constant.
We compare these experimental observations with two different methods to compute both the dispersion relation and the intensity distribution, which is a much tougher test than the dispersion relation alone. In the first method, the dynamical structure factor can be obtained from the eigenvalues of the dynamical matrix determined in harmo-nic approximation (Section 2). In principle, this method can be used also with classical interaction potentials, but in our case we determine the dynamical matrix from ab-initio forces, which should result in the best possible accu-racy.
In a second method, the dynamical structure factor is interpreted as a certain correlation function, which can be measured in a molecular dynamics (MD) simulation (Sec-tion 3). This requires much larger samples, prohibiting the direct use of ab-initio methods. Classical interaction poten-tials are therefore necessary. For the best possible reliabil-ity, these potentials are fitted to reproduce ab-initio data, however. The possibility of using larger samples has also the advantage, that structural or occupational disorder can be taken into account, which may prove useful for the more complex structures in the Zn–Mg system.
2. Ab-initio calculations
The Laves phase of MgZn2 has 12 atoms in the primitive unit cell, so that ab-initio calculations can be performed relatively easily, using the VASP code [2, 3] with the PAW method [4]. The relaxed unit cell is promoted to an
# by Oldenbourg Wissenschaftsverlag, Mu¨nchen
* Correspondence author
orthorhombic supercell with 48 atoms and relaxed again. The dynamical matrix in harmonic approximation is then determined by displacing one atom at a time (by!0.05!A), and computing the resulting forces on all other atoms. This has to be repeated for 12 independent displacements and is most conveniently done by using the PHONON package [5], which generates the configurations for VASP with the required displacements, and computes and diagonalizes the dynamical matrix from the VASP forces. The coherent part of the dynamical structure factor is then given by
Scðq;wÞ/P
s FsðQ;qÞ
1
wðnðw;TÞ þ1Þ
%dðQ&QB&qÞdðw&wsðqÞÞ; ð1Þ
where Q¼kf &ki is the total momentum transfer, QB the
Bragg peak corresponding to elastic scattering, qthe pho-non wave vector, and "hws¼Ef&Ei the energy transfer.
nðw;TÞ þ1 is a thermal occupation factor, andFsðQQ~; ~qqÞ is
the coherent form factor, which is also determined within PHONON. The sum runs over all 3N vibrational modes.
In order to account for the instrumental resolution,
Scðq;wÞ has been convoluted with a Gaussian, whose
width was chosen so as to obtain the best fit with experi-ment. The final comparison is shown for the two direc-tions x;x;6 and 2;2;x in reciprocal space (Fig. 1 and Fig. 2). This means that the scans inQ-space are started at the Bragg peaks QB ¼0;0;6 and QB¼2;2;0, and
pro-ceed along the directions q¼x;x;0 and q¼0;0;x, re-spectively. The graphs show the results for selected values of x; the corresponding magnitudes of q are indicated in the upper right corner of each subgraph. To obtain this comparison, a constant background was added to the cal-culated intensities, which were also uniformly rescaled for
98 P. Brommer, M. de Boissieu, H. Euchneret al.
0 1000 2000 3000 Counts/(mn=30000) 0 500 1000 1500 Counts/(mn=30000) 0 500 1000 1500 Counts/(mn=60000)*
1 1.5 2 2.5 3 3.5
E(THz) 0 500 1000 1500 Counts/(mn=120000)*
1 1.5 2 2.5 3 3.5
[image:3.666.309.556.270.725.2]E(THz) q=0.37ů¹ q=0.56ů¹ q=0.73ů¹ q=0.88ů¹ q=0.51ů¹ q=0.66ů¹ q=0.83ů¹ q=0.94ů¹
Fig. 1. Measured (circles) and calculated (solid line) intensities for directionx;x;6 (TT0) for eight differentqvalues. The errorbars in the
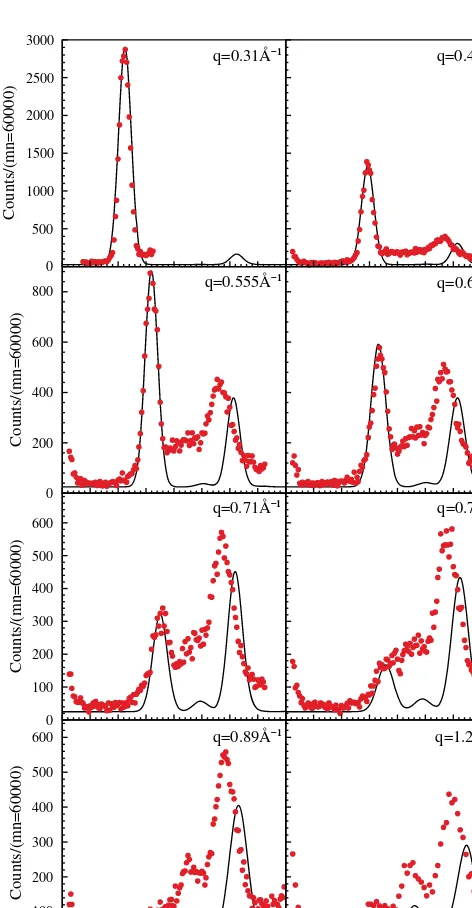
measurement are smaller than the symbol size. 0 500 1000 1500 2000 2500 3000 Counts/(mn=60000) 0 200 400 600 800 Counts/(mn=60000) 0 100 200 300 400 500 600 Counts/(mn=60000)
0 0.5 1 1.5 2 2.5 3 3.5
E(THz) 0 100 200 300 400 500 600 Counts/(mn=60000)
0 0.5 1 1.5 2 2.5 3 3.5
[image:3.666.53.289.291.745.2]E(THZ) q=0.31ů¹ q=0.555ů¹ q=0.71ů¹ q=0.89ů¹ q=0.48ů¹ q=0.63ů¹ q=0.79ů¹ q=1.21ů¹
Fig. 2. Measured (circles) and calculated (solid line) intensities for direction 2;2;x (D) for eight differentqvalues. The errorbars in the measurement are smaller than the symbol size. An asterisk at the y-label of a graph means that the left graph was rescaled to the indi-cated monitor.
each direction. Furthermore, for both directions the energies (frequencies) had to be rescaled by a constant factor of 1.14 and 1.08, respectively. This seems to indicate that the sound velocities are not accurately reproduced by the ab-initio cal-culations. Apart from this, the agreement is extremely good, not only for the overall dispersion but also for the intensity distribution. In particular, the bending of the dispersion and the intensity transfer from the acoustic to the optic mode is well reproduced for the TT0direction. The much more
line-ar dispersion and higher energy reached for the Delta direc-tion is also well accounted for. Looking more into detail, there are some discrepancies, however: The energy differ-ence between acoustic and optical mode along the TT0
di-rection is larger in the simulation than experimentally ob-served, and the intensity of the optical mode is somewhat smaller in the simulation. Although the resolution function (which is different for dispersive and non dispersive modes) was not completely accounted for, this certainly points to the limitation of the ab-initio simulation.
3. Molecular dynamics
In the preceeding section, the dynamical structure factor was computed using the eigenvalues of the dynamical matrix. This is not the only method, however. The coherent dynami-cal structure factorScðq;wÞas measured in an inelastic
neu-tron scattering experiment is actually a correlation function, which can be measured in an MD simulation. More precisely,
Scðq;wÞis the Fourier transform of the autocorrelation of the
coherent intermediate scattering function, given by
Fcðq;tÞ ¼ 1 N
P
a;b bc
abcbhexpð&iq(Rað0ÞÞexpðiq(RbðtÞÞi
¼ N1 hfðq;0Þfðq;tÞi¼ 1
N hfðq;t0Þfðq;tþt0Þit0 fðq;tÞ ¼P
a
bcaexpð&iq(RaðtÞÞ; ð2Þ
where bca is the coherent scattering length of atom a. There exist postprocessing tools [6] which can determine
Sðq;wÞ directly from an MD trajectory. However, for suf-ficient resolution in q-space and frequency space a rather large sample and a long trajectory are required, so that the resulting amount of data for the full trajectory cannot be handled. A better way is to compute the spatial Fourier transform already during the simulation, but only for a few hundred q-vectors located on a suitable path in the Brillouin zone. For each of these q-vectors qi, a time
ser-ies fðqi;tÞ (2) is determined, whose autocorrelation and
Fourier transform is then determined in a postprocessing step, using the FFT method [6].
As the linear dimension of the sample is inversely pro-portional to the resolution in q-space (note that periodic boundary conditions have to be used), rather large samples have to be simulated. Our sample had a size of 167.6!A%145:2A!%134:1!A; containing about 200 000 atoms, and was simulated over 160 ps, with a timestep of 2 fs. Such simulations, which were performed with our code IMD [7], are feasible only with classical interaction potentials. For our simulations, potentials of EAM type were used, which had been fitted to reproduce forces, en-ergies and stresses computed ab-initio. This so-called force matching method [8], which is implemented in our poten-tial fitting code potfit [9], ensures that even classical po-tentials make best possible use of quantum mechanical in-formation.
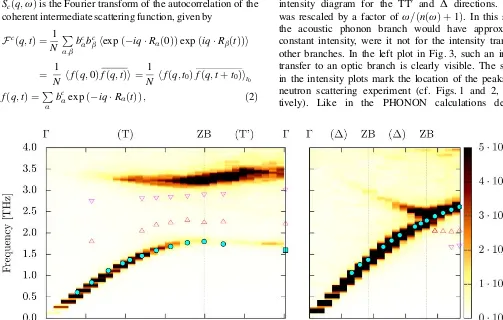
In Fig. 3, the dynamical structure factor is shown in an intensity diagram for the TT0 and D directions. Sðq;wÞ
[image:4.666.40.543.431.751.2]was rescaled by a factor of w=ðnðwÞ þ1Þ. In this scaling, the acoustic phonon branch would have approximately constant intensity, were it not for the intensity transfer to other branches. In the left plot in Fig. 3, such an intensity transfer to an optic branch is clearly visible. The symbols in the intensity plots mark the location of the peaks in the neutron scattering experiment (cf. Figs. 1 and 2, respec-tively). Like in the PHONON calculations described
Fig. 3. The scaled dynamical structure factor Sðq;wÞ (w=ðnðwÞ þ1Þ determined from MD simulation is shown for the TT0 (left) and the D (right) direction as a color map. The peaks of the neutron intensities (cf. Figs. 1 and 2) are marked as filled circles and open triangles (acoustic and optic branches respectively). The energy axes of the MD results were rescaled by factors of 1.11 (TT0) and 1.21 (D), see also text.
above, the energy (frequency) scale of the MD structure factor had to be rescaled by factors of 1.11 and 1.21, re-spectively – as the potentials were fitted to results from ab-initio calculations, they suffer from the same deficien-cies. The factors were chosen to yield an optimal agree-ment for the acoustic branch. In the TT0 direction, the
lower weak optical branch visible in Fig. 1 cannot be seen in the MD intensity plot. The frequency of the upper branch is overestimated slightly, but the intensity transfer to that branch is reproduced reasonably well. In the D
direction, experiment and MD simulation agree on the al-most linear acoustic phonon dispersion relation.
4. Discussion and conclusion
In this paper, we have calculated the dynamical structure factor of MgZn2 with two methods, which both have their advantages and disadvantages. The ab-initio results in har-monic approximation are the most accurate, and show ex-cellent agreement with experiment. Another advantage of that method is the possibility of calculating the eigenvec-tors, and thus studying in detail the vibrational modes and their relation with the atomic structure of CMA. However, the method disregards all anharmonic effects, and is lim-ited to unit cells of moderate size, so that any effects of disorder cannot be accounted for. The molecular dynamics method, on the other hand, requires classical interaction potentials, and therefore is less accurate a priori. Still, the qualitative agreement with experiment is very good, even if quantitatively the deviations from experiment are some-what larger than with the ab-initio methods. However, the potential we have used is a preliminary one, and likely can further be improved. The biggest advantage of the MD method is, that it can be used also with very large
unit cells, and that it takes anharmonic and disorder ef-fects into account. This will become more important for systems with increasing complexity. We should also stress that the dynamical structure factor, including the intensi-ties, is also a very tough test for any classical potential, which can likely lead to improvements of the potential.
Acknowledgment.We gratefully acknowledge support from the Euro-pean Commission Network of Excellence on Complex Metallic Al-loys (NMP3-CT-2005–500140).
References
[1] Francoual, S.; de Boissieu, M.; Currat, R.; Shibata, K.; Sidis, Y.; Hennion, B.; Tsai, A. P.: Experimental study of the dynamics of Zn2Mg Laves phase. J. Non-Cryst. Solids353(2007) 3182–3187. [2] Kresse, G.; Hafner, J.: Ab initio molecular dynamics for liquid
metals. Phys. Rev. B47(1993) 558–561.
[3] Kresse, G.; Furthmu¨ller, J.: Efficient iterative schemes for ab in-itiototal-energy calculations using a plane wave basis set. Phys. Rev. B54(1996) 11169–11186.
[4] Kresse, G.; Joubert, D.: From ultrasoft pseudopotentials to the projector augmented-wave method. Phys. Rev. B 59 (1999) 1758–1775.
[5] Parlinski, K.: Software phonon, version 4.28 (2005).
http://wolf.ifj.edu.pl/phonon/Public/phrefer.html.
[6] Ro´g, T.; Murzyn, K.; Hinsen, K.; Kneller, G. R.:nMoldyn: A pro-gram package for a neutron scattering oriented analysis of molecu-lar dynamics simulations. J. Comput. Chem.24(2003) 657–667.
http://dirac.cnrs-orleans.fr/nMOLDYN/index.html.
[7] Stadler, J.; Mikulla, R.; Trebin, H.-R.: IMD: a software package for molecular dynamics studies on parallel computers. Int. J. Mod. Phys. C8(1997) 1131–1140.
http://www.itap.physik.uni-stuttgart.de/~imd/.
[8] Ercolessi, F.; Adams, J. B.: Interatomic potentials from first-prin-ciples calculations: the force-matching method. Europhys. Lett. 26(1994) 583–588.
[9] Brommer, P.; Ga¨hler, F.: Potfit: effective potentials from ab-initio data. Modelling Simul. Mater. Sci. Eng. 15 (2007) 295–304.
http://www.itap.physik.uni-stuttgart.de/~imd/potfit/.
100 P. Brommer, M. de Boissieu, H. Euchneret al.