University of Warwick institutional repository: http://go.warwick.ac.uk/wrap
This paper is made available online in accordance with
publisher policies. Please scroll down to view the document
itself. Please refer to the repository record for this item and our
policy information available from the repository home page for
further information.
To see the final version of this paper please visit the publisher’s website.
Access to the published version may require a subscription.
Author(s): X. Yin, D.A. Hutchins, G.G. Diamond, P. Purnell
Article Title: Non-destructive evaluation of concrete using a capacitive
imaging technique: Preliminary modelling and experiments
Year of publication: 2010
Link to published article:
http://dx.doi.org/10.1016/j.cemconres.2010.08.015
Publisher statement: “NOTICE: this is the author’s version of a work
that was accepted for publication in Cement and Concrete Research.
Changes resulting from the publishing process, such as peer review,
editing, corrections, structural formatting, and other quality control
mechanisms may not be reflected in this document. Changes may
have been made to this work since it was submitted for publication. A
definitive version was subsequently published in Cement and Concrete
Research,VOL: 40, ISSUE: 12, December 2010 DOI:
Formatted: Right: 0.63 cm
Non-destructive evaluation of concrete using a
capacitive imaging technique
: preliminary model
l
ing
and experiments.
X. Yin, D.A. Hutchins and G.G. Diamond
School of Engineering, University of Warwick, Coventry CV4 7AL, UK
P. Purnell
School of Civil Engineering, University of Leeds, Leeds LS2 9JT, UK
Abstract
This paper describes the application of capacitive imaging to the inspection of concrete. A two-dimensional finite-element method is employed to model the electric field distribution from capacitive imaging probe, and how it interacts with concrete samples. The results indicate that the capacitive imaging technique could be used to detect micro-cracks on the surface of concrete samples, as well as sub-surface air voids and steel reinforcement bars.
Formatted: Right: 0.63 cm
1. Introduction
Reinforced concrete is one of the most important construction materials because it is economical, durable and has the ability to be cast into any shape. In most cases, reinforced concrete is reliable and strong throughout its service life. However, factors
such as poor design, bad workmanship and a harsh environment can combine to cause
deterioration within a concrete structure. This may decrease the strength of the
concrete and induce failure of the structure by causing visually unacceptable surface
cracking or spalling of the layer of concrete ‘cover’ that protects the steel reinforcement. This may in turn pose a safety risk to passing pedestrian or motor traffic owing to falling debris, and ultimately lead to further corrosion and structural
failure. Unfortunately, more often than not, this deterioration may not become
apparent at the surface until major damage has already occurred. Similarly, in assessing heritage concrete structures, poor record keeping may prevent an accurate knowledge of the quantity and architecture of the internal steel reinforcement being
known in advance. Thus non-destructive evaluation (NDE) techniques are very useful
for condition assessment of concrete structures, so as to provide information concerning structural changes conditions within the material. These include:
micro-cracks caused by shrinkage of concrete or repetitive freeze-thaw
cycles
corrosion of reinforcing steel caused by an ingress of chloride ions saline
environment (e.g. from sea water or de-icing salt) and/or loss of steel
passivity owing to neutralization, by reaction with atmospheric carbon dioxide, of the normal alkaline environment provided by the concrete cover problems with concrete mixweak areas of concrete and/or discrete defects
caused by poor quality control in the mixing and placing of concrete (e.g.
poor curing, incorrect mix design, air voids etc)
the presence of air voids etc), the condition size, depth and distribution of
steel reinforcement bars (rebars) and their condition with respect to corrosion etc.
There is a range of techniques used conventionally to inspect concrete structures. They are all designed to detect a only single type of artifact (e.g. rebar, void,
corrosion etc), and perhaps Perhaps the most common is the covermeter [1]. This
operates by creating eddy currents within the rebars, and hence measuring the
resultant magnetic field at the concrete surface to gain diagnostic information. This
approach is used to estimate cover depth and to give some idea of rebar condition and
position, but is difficult to use beyond a certain cover depth,or in areas of congested
reinforcement and does not easily provide an imaging capability [2]. Ultrasonic
techniques are commonly used to estimate concrete strengths but have also been used to image concrete structures, using various transducer technologies and frequencies,
including relatively simple, low-frequency piezoelectric systems such as the
Formatted: Bulleted + Level: 1 + Aligned at: 0.85 cm + Indent at: 1.48 cm
Formatted: Font: Italic
Formatted: Right: 0.63 cm
PUNDITTM at low frequencies[2,3], other more advanced piezoelectric transducer designs [4-6] and the use of air-coupling [7, 8]. However, this approach has yet to receive widespread use for rebar and void characterization because of complications
causeduncertainties introduced by the significant ultrasonic scattering by aggregate
[9,10], which is a manifestation of the mismatch in acoustic impedance between aggregates, cement paste matrix and non-critical small air voids being of similar
magnitude to that between concrete and voids or rebars.. In many cases, surface
preparation is also required.
Other techniques are also useful. For example, the half-cell potential meter can be
used to infer the probability of corrosion of the steel rebar from the surface of the concrete[11,12] by measuring the electrochemical potential between the rebars and a reference ‘half-cell’ electrode at the surface. Areas of high potential gradient are more
likely to be undergoing corrosion. This approach often has difficulty in making
reliable measurements, and must be combined with other techniques (e.g. resistivity
surveys) in order to obtain quantitative results. It sometimes also requires a
complicated statistical analysis to retrieve useful data [13] or to predict service life
[14]. It also requires that an electrical connection be made to the rebar, which
normally entails breaking or cutting out a section of cover concrete. Ground
Penetrating Radar (GPR) has also been proposed for the inspection of concrete structures [15,16]. The resolution of GPR system is limited to 100mm for commercial systems due owing to the wavelength used [17,18] which is not really suitable for the
majority of artifacts of interest in structural assessment. Other electromagnetic
techniques, such as electrical resistance measurement [19], impedance spectroscopy [20] and electrical resistance tomography[21] are reported to be used for inspection and evaluation of concrete structures, but they all require a perfect electrical contact between the electrode and the target surface.
The capacitive imaging approach to be described in this paper aims to get
roundovercome some of the limitations experienced imposed by existing NDE
techniques for on the inspection of concrete structures. Thus, for example, the technique should be able to recognize both rebars and air voids within a concrete structure. Since our first demonstration of ‘proof of concept’ for capacitive NDE with
concrete[22], other work has described capacitive approaches to measure cover depth
and water content, in conjunction with GPR [23] and there have been papers
describing such a technique has also been used for detecting water intrusion in
composite structures [24], and for inspecting laminated composite plates [25].
Here, the technique is investigated in some depth for its application to concrete
structures. This paper outlines describes the results from both finite element modeling
and physical experiments to investigate the usefulness of the capacitive technique for
concrete inspection and imaging. It follows on from previous papers [26, 27], where preliminary experiments on a wide range of materialswere described, including some
used for construction. Here the technique is investigated in some depth for its
Field Code Changed Field Code Changed
Field Code Changed
Field Code Changed
Formatted: Default Paragraph Font, Font: (Default) Times New Roman, 12 pt, Not Bold, Font color: Auto
Formatted: Default Paragraph Font, Font: (Default) Times New Roman, 12 pt, Font color: Auto
Field Code Changed
Field Code Changed Field Code Changed
Formatted: Right: 0.63 cm application to concrete structures.
2. Apparatus
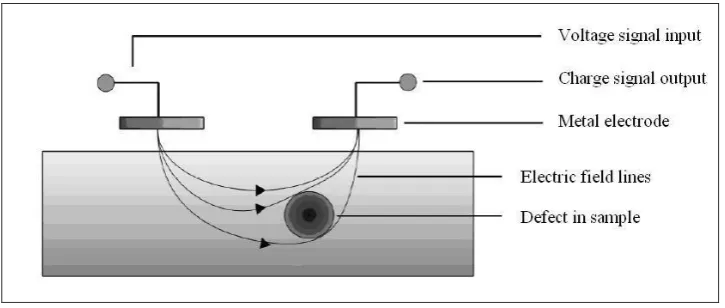
The general approach to be adopted in this paper during this work was to use a co-planar capacitive electrode to detect changes in the local electrical characteristics within a concrete sample. Figure 1 shows schematically how the electric field shapes
would vary as the two electrodes of a capacitor change from a parallel-plate capacitor
geometry to being co-planar, so that a fringing field is produced. It is this fringing field that will extend into the concrete sample for imaging purposes, with the concrete
effectively acting as the dielectric within the capacitor. Scanning such an electrode
pair across a surface and measuring the resultant change in stored charge for a given
voltage would then create a map of changes in electrical properties within the
concrete.
Figure1: Schematic diagram of the electric field distribution as electrodes change from being in a conventional parallel-plate capacitor geometry (left) to become co-planar (right)
A schematic diagram of the capacitive imaging approach is shown in Figure 2. The co-planar probe, which contains two or more metal electrodes, generates an electric field distribution within the test material when an AC voltage is applied between the positive and negative electrodes. The presence of the sample under test will affect the resultant electric field pattern, and furthermore, any property change in the sample (such as the presence of a defect) within the volume covered by the electric field distribution will also have an effect, as shown in Figure 2. The resultant electric field distortion will then result in a change in the charge induced at the sensing electrode, and this change in signal can be detected and used for imaging purposes. Since concrete, steel rebar and air voids/cracks all have very different electric properties, the electric field distribution is affected differently by these areas within the sample, giving a basis for imaging.
Formatted: Right: 0.63 cm Figure 2: Schematic diagram of the capacitive imaging approach
A typical capacitive imaging probe is shown in Figure 3. The co-planar triangular imaging electrodes, plus the grounded guard electrodes (used for shielding the two electrodes electrically from each other) are fabricated by etching a printed circuit board (PCB) substrate. The PCB was also coated in copper on its rear surface and mounted in a metal box to shield the electrodes from electrical noise interference, and to enhance the radiated electric field magnitude in the direction of the sample surface. For an accurate evaluation of concrete, the electrode geometry must be designed with some care. Sensors of various geometries have been investigated in previous work
[27], and the results have indicated that it is important to optimise the electrode geometry for each application. Generally, a wider electrode assembly will provide a deeper depth of penetration into the sample, but this will be traded off against a reduced spatial resolution at the surface. In this work, experimental results were obtained using triangular electrodes such as those shown in Figure 3, but with different sizes to suit each application.
Figure 3: Photograph of a pair of triangular electrodes, mounted in a shielded metallic container. The triangular electrodes in this example were each 20 mm wide in the horizontal
direction.
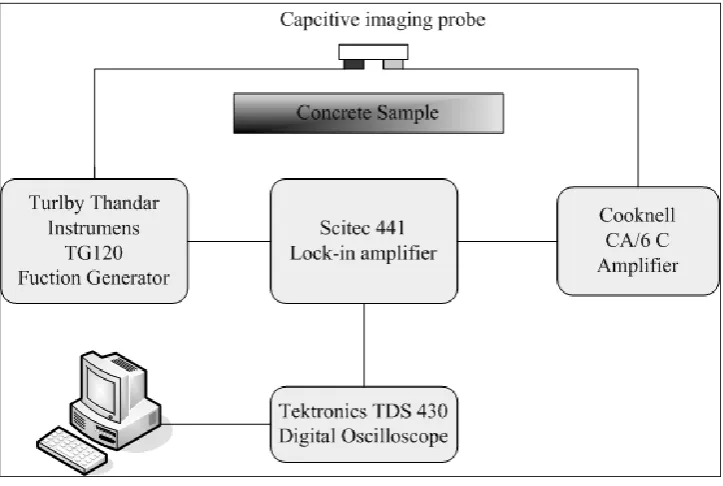
The probe was part of an instrumentation system that could be used for imaging, and a
schematic diagram of the basic instrumentation is shown in Figure 4. To measure the
signal at any particular location, a single frequency AC signal was applied as the
driving voltage to one of the electrodes. The frequency of operation could be adjusted
Formatted: Right: 0.63 cm
from 10 kHz to 1 MHz., nNoteing that all the images present in this paper were
obtained at a frequency of 1 MHz, unless stated otherwise. The drive voltage
waveform was obtained from a Turlby Thandar Instruments TG120 signal generator.
The capacitance across the electrodes was not measured directly, as this would not be
sufficiently sensitive. Instead, a Cooknell CA/6 charge amplifier was used to convert
the charge signal on the sensing electrode to an AC voltage signal, which could then
be recorded if desired. However, greater sensitivity was obtained by using a Scitec
441 lock-in amplifier, which converts the AC voltage signal into a DC voltage
proportional to the amplitude of the received AC signal. The lock-in amplifier is an
example of phase-sensitive detection, and allows a high degree of noise suppression
in small signal measurements such as these. The DC output was then recorded using a
Tektronics TDS 430 oscilloscope, and transferred to the PC for storage. The PC also
controlled an X-Y scanning stage, which could be used to translate the capacitive
imaging electrodes across the sample surface, and the signal recorded in specified
[image:7.595.78.440.376.619.2]locations so as to build up an image.
Figure 4: System block diagram of Capacitive imaging system
3. Two-dimensional Finite Element (FE) modeling
Formatted: Right: 0.63 cm
was felt important to model the expected behaviour. Techniques such as conformal mapping [28] can be used to calculate the capacitance of a planar capacitor electrode assembly, but in the present work we are more interested in the distribution of the electric field and how changes within the sample might affect the capacitance. Finite
Element (FE) modeling[27, 29] has thus is been employed to predict the fields from
capacitive electrodes and to predict the changes in signal that were likely to be produced under experimental conditions.
Fundamentally, the electromagnetic phenomena are governed by the Maxwell’s equations. In a general case of materials exhibiting both dielectric and conductive properties, such as concrete, the Maxwell-Ampere equation is considered.
t
D
H J (1) where H is the magnetic field intensity, J is the free current density and D is the electric flux density. To eliminate the magnetic field intensityH, the divergence of both sides of Eq. (1) is taken, as:
( ) 0
t
D
J (2) The frequencies used in capacitive imaging probes are generally in the region
between 10kHz and 1MHz. At such frequencies, inductive phenomena can be
neglected and the electromagnetic field can be considered as a quasi-static electric field. It can then be assumed that the time-derivative of the magnetic flux density (B) is negligible, and based on Faraday’s Lawand that the electric field (E) is curl free, so that:,
0
t
B
E = - (3)
Based on Eq. (3), the electric field (E) can be described by an electric scalar potential distribution φ(x, y, z), Tso the electric potential distribution φ(x, y, z) can be introduced as
( , , )x y z
E (4) and using the constitutive relationships
( , , )x y z
J E (5)
( , , )x y z
D E (6) Eq. (2) can take the form
( , , )x y z ( , , )x y z ( , , )x y z ( , , )x y z 0
t (7)
Here, σ(x,y,z) is the conductivity distribution and ε(x,y,z) is the permittivity distribution. If the conductivity and permittivity distributions within the area of
Formatted: English (U.K.)
Field Code Changed
Field Code Changed
Formatted: Default Paragraph Font, Font: (Default) Times New Roman, 12 pt, Font color: Auto
Comment [c1]: You might need a
paragraph explaining why E needs to introduced i.e. what is the relationship
between eqs. 2 and 3 – none of the readers
are likely to have the faintest idea what all
this electrical derivation means if we
publish in a concrete journal so it needs to
be spelled out in very simple terms
(imagine you were trying to explain it to a
particularly dense undergraduate) - PP.
Formatted: Right: 0.63 cm
interest covered by the electric field are known, the electric potential distribution
φ(x,y,z) can be obtained by solving Eq.(7). But in practice, due to the time-derivative coupling between the dielectric and conductive properties, solving Eq.(7) is computationally prohibitive[29][17]. The practical way of solving this problem is to treat the system as either “predominantly dielectric” or “predominantly conductive”
[29][17]. In the former case, Eq. (7) can be simplified to be:
( , , )x y z ( , , )x y z 0 (8)
This equation is valid, for example, for Electrical Capacitance Tomography (ECT) applications[30, 31] and dielectrometry sensors [25]. In the latter case, the equation becomes
( , , )x y z ( , , )x y z 0 (9)
which is valid for Electrical Resistance Tomography (ERT) applications [21,32,33]
and potential drop methods [34, 35].
Using the quasi-static assumption mentioned above, it is possible to use a Finite Element (FE) technique to solve the above equations, and to predict the potential distribution φ(x, y, z) produced by the capacitive electrodes in a particular medium and geometry. In addition, Gauss’s Law in a numerical integral form can be applied on the surface enclosing the sensing electrode to calculate the induced charge on that electrode that would result from that electric potential distribution if desired. Gauss’s Law can be written as:
( , , )
( , , )
s
q
x y z
x y z d
s
(10)where s is the surface enclosing the sensing electrode.
It can be shown by an analysis of Eqns. (7)-(10) that, for a given driving signal, the amount of charge on the sensing electrode is solely determined by the electrical properties of the materials within the field (via the permittivity and conductivity distributions ε(x, y, z) and σ(x, y, z) respectively). Thus, changes of structure or material within a concrete structure which change the permittivity and conductivity distributions will change the total charge on the sensing electrode, which can then be represented as a variation in the final image. It will be shown later in this paper that the capacitive technique is capable of imaging both micro-cracks on the surface and sub-surface air voids, whilst also simultaneously being able to locate rebar within concrete specimens.
Theoretical simulation models were constructed using the COMSOLTM Multiphysics
FE package (version 3.3), which can be used to model the predictions of such equations for different geometries. To simplify the models, simulations were restricted to two dimensions. The quasi-static model was used within COMSOL, in which it is assumed that the electric field is not propagating along the electrodes, and that there is
Field Code Changed
Field Code Changed
Field Code Changed Field Code Changed
Formatted: Right: 0.63 cm
no coupling between the electric and magnetic fields. In this model, the driving electrode is considered to be connected to a DC voltage, while the sensing electrode is left empty. Based on this, an electric field distribution will be formed in a local part in the testing concrete sample under the electrode pair and the air gap between the sample and probe. This seems to be a reasonable approximation to the situations to be met in capacitive imaging for concrete inspection. The concrete considered in this model is assumed to be a non-magnetic material. As such, the magnetic permeability of concrete is deemed equal to that of free space. In terms of the electrical properties,
in practice the permittivity and conductivity will depend on the frequency used to drive the electrodes, the water moisture content and the thickness of the concrete material, as well as other factors such as the mix used etc. As the main purpose of the FE modeling here is to demonstrate the possibility of imaging surface and sub-surface features, hidden defects and steel rebars – i.e., we are only interested in demonstrating that the contrast in electrical properties between the various materials (concrete, steel,
air/water voids) gives rise to measurable signals - , simplifications can be made. Thus,
it has been assumed that the permittivity and conductivity of concrete samples can be assumed to have a nominal value, apart from defects or other features that can deviate from this. In addition, these values are assumed to be frequency independent. In the theoretical model, the relative permittivity was set to a value of 6, and the conductivity to 0.02s/ m-1, a value used in other published work [36].
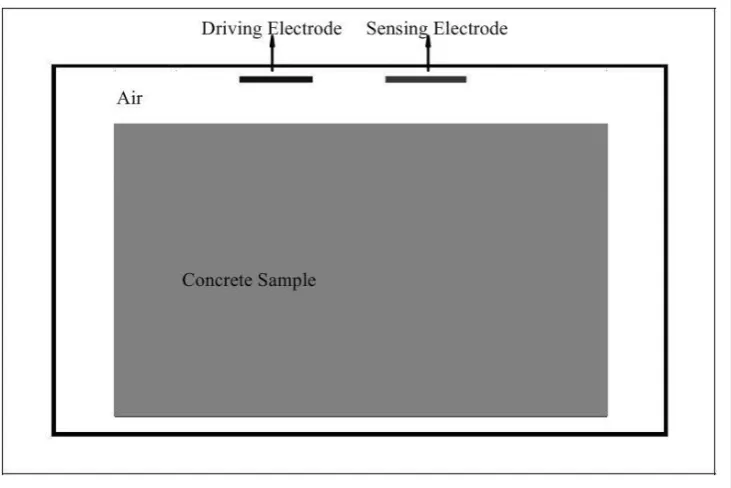
The model geometry is shown in Figure 3. This represents a slab of concrete containing regions of discontinuity in electric properties. The electrodes were modelled at the relative sizes shown in the figure. Note that the field distribution predicted by these models is determined primarily by these geometric factors in the quasi-static model.
Formatted: Right: 0.63 cm Figure 3: Model used for FE simulation of CI for concrete sample
Formatted: Right: 0.63 cm Figure 4: Simulations of the electric field distribution for a concrete sample. Results are shown
for (a) a uniform sample (b) a sample with a narrow crack on the surface, (c) a simulated void under the surface and (d) a steel rebar in the location shown.
4. Experimental results
The concrete samples used in this work were fabricated from a C40 mix (with relative
proportions by mass 2.55:1.7:1:0.6 of 20 mm limestone aggregate:sand:CEM1 cement:
water) unless otherwise specified. After 28 days of moist curing, the samples were
Formatted: Right: 0.63 cm
be considered to be stable in terms of their electrical properties. The apparatus shown in Figure 4 was used to scan a capacitive electrode pair over the surface of various concrete samples, which had been prepared so as to contain certain features of interest. These included surface cracking, changes in thickness and the presence of rebars.
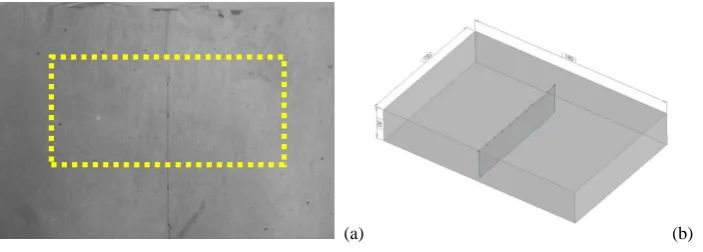
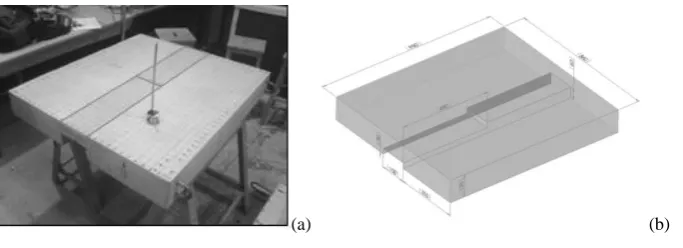
The first sample that was investigated was a concrete block with dimensions 180 (length) x 120mm (width) x 30 mm (depth), and in this case, no coarse aggregate was included in the mix. A micro-surface crack caused initiated by impact was present on the upper surface, as shown in the photograph of Figure 5(a). This has been cleaned to show the presence of the crack; in many practical situations, the crack would not be visible to the naked eye.
[image:13.595.85.437.289.415.2](a) (b)
Figure 5: Concrete specimen with a micro- crack on the surface. (a) Photograph of top surface containing the crack, and (b) schematic diagram of the crack geometry.
The electrode assembly shown earlier in Figure 3 was scanned over a 100mm x 50
mm area, as highlighted by the dotted line in Figure 5(a), with a 1mm step size and
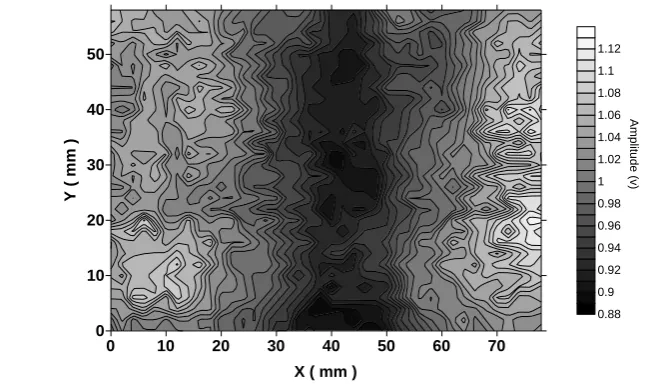
1mm stand-off distance (the gap between the probe and the sample surface). The excitation frequency is was 1 MHz. The image resulting from this scan is shown in Figure 6, where the amplitude of the signal output from the sensing electrode has been plotted against position across the sample surface. It can be seen that there is was an obvious discontinuity in the image caused by the presence of the surface crack.
Formatted: Font: Times New Roman
Formatted: Plain Text, Justified
Formatted: Font: Times New Roman, 12 pt
Formatted: Right: 0.63 cm
A
m
p
lit
u
d
e
(
v
[image:14.595.70.438.112.306.2])
Figure 6 capacitive imaging results for concrete sample with a crack on the surface
A second concrete specimen with dimensions 980 mm (length) x 860 mm (width) x 125 mm (depth) was also fabricated, containing a stepped air-filled channel running through the centre to simulate a local change in thickness. This is also an approximation to the presence of a void, as seen from the flat top surface. The channel had two depth values, 30mm and 60mm, so that the cover thickness over the void had values of 125mm (full sample thickness), 95 mm and 65 mm respectively, as shown in figure 7(b).
(a) (b)
Figure 7: (a) Photograph and (b) schematic diagram of a concrete sample with a hidden channel of two different depths (30 mm and 60 mm).
The thickness of this sample and the width of the channels meant that a larger pair of electrodes than the 20 mm wide design used in the above measurements and shown earlier in Figure 3. In this case, the triangular electrodes were each 150 mm wide in
the horizontal direction. A scan at a frequency of 1MHz was performed, over a 540
mm x 600 mm area, with a 30 mm step size and 1mm stand-off distance. The result is
[image:14.595.85.427.444.568.2]Formatted: Right: 0.63 cm
of the channel. It can also be seen that the shallower channel (with the greater cover depth of 95 mm) produced a lower output than that region containing the smaller cover depth of 65 mm. Hence, it seems that some depth information is available from such scans.
0 100 200 300 400 500
X ( mm ) 0
100 200 300 400 500 600
Y
(
m
m
)
-0.88 -0.86 -0.84 -0.82 -0.8 -0.78 -0.76 -0.74 -0.72 -0.7 -0.68 -0.66 -0.64 -0.62 -0.6 -0.58 -0.56
A
m
p
lit
u
d
e
(
v
[image:15.595.71.429.191.448.2])
Figure 8: Capacitive imaging results for concrete sample with hidden stepped channel
A further set of experiments was now performed, to indicate the presence of rebars. The first test sample, shown in Figure 9, contained a single 10 mm diameter rebar located at a cover depth of 10 mm. The concrete sample itself was of dimensions
300mm (length) x 150 mm (width) x 30 mm (depth) and in this case, no coarse10mm
aggregate was included in the mix. The rebar was equidistant from the top and bottom
surfaces and parallel to them. The rebar and the scanned area are highlighted on the surface of the photograph shown in Figure 9(a).
Formatted: Right: 0.63 cm (b)
Figure 9: Concrete sample with a single rebar of 10 mm diameter placed symmetrically within the thickness of a 30 mm thick concrete sample. (a) Photograph of sample, and (b) schematic
diagram.
An 80mm x 40 60 mm area was scanned using the probe shown in Figure 3 with a 1
mm step size and a 1mm stand-off distance, using a 1MHz driving signal. During the
scan, the rebar was grounded. The resulting image is show in Figure 10. The rebar can be seen clearly as the darker vertical strip in the centre of the image, which indicates that the capacitive imaging technique was sensitive to the hidden rebar and had detected it successfully.
A
m
p
lit
u
d
e
(
v
)
0 10 20 30 40 50 60 70
X ( mm ) 0
10 20 30 40 50
Y
(
m
m
)
0.88 0.9 0.92 0.94 0.96 0.98 1 1.02 1.04 1.06 1.08 1.1 1.12
Figure 10: Capacitive imaging results for the concrete sample of Figure 9, containing a single rebar
[image:16.595.79.410.406.598.2]Formatted: Right: 0.63 cm
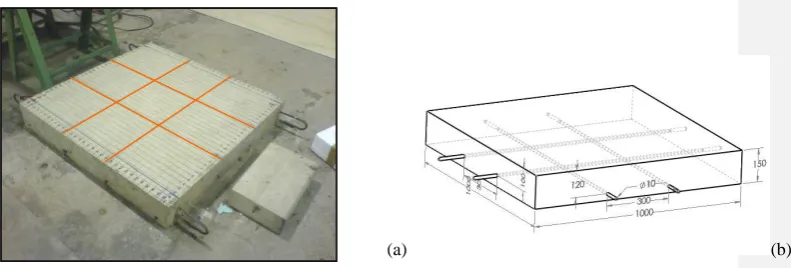
centres, and the second set (also two parallel rebars with a 300mm spacing between the centres), were oriented perpendicular to the first set were buried at a depth of 120 mm from the top surface to their centres. This sample provided a more complex scanning environment, such as that likely to be met in practice, with sets of rebars at different depths and orientation.
[image:17.595.73.469.216.350.2]
(a) (b)
Figure 11: concrete sample with rebars (a) Photograph of sample, and (b) schematic diagram.
Formatted: Right: 0.63 cm A m p lit u d e ( v )
0 100 200 300 400 500 600
[image:18.595.77.400.122.385.2]X ( mm ) 0 100 200 300 400 500 600 700 Y ( m m ) 0.78 0.8 0.82 0.84 0.86 0.88 0.9 0.92 0.94 0.96 0.98 1 1.02 1.04 1.06 1.08 1.1 1.12
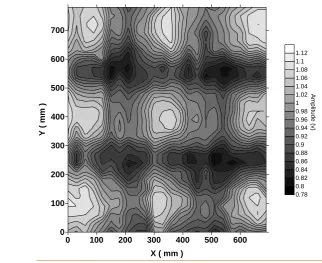
Figure 12: Capacitive imaging results for the concrete sample shown in Figure 11.
5 Discussion and Conclusions
Previous work [27]has confirmed that the probe size and geometry are the key factors for penetration depth and image resolution in concrete for the capacitive imaging technique. This is true provided the frequency is kept within a reasonable range (e.g. 10 kHz – 1 MHz), so that the quasi-static approximation mentioned in earlier sections is appropriate. This is in contrast to other electromagnetic NDE methods, such as eddy currents and AC potential drop approaches, where the penetration depth and image resolution are heavily dependent on the frequency of the driving signal. Thus, with frequency not being a major factor, the choice of electrode shape and size
becomes important. Work reported elsewhere [27] has demonstrated the influence of
probe geometry, and has identified the triangular electrodes used here as a good general-purpose design. However, as a general rule, the use of smaller electrodes will allow a better resolution of near-surface defects, whereas greater penetration comes from larger electrodes for a given electrode geometry. Accordingly, to image the
micro-crack on the surface and shallowly buried rebar, a 20 mm wide triangular electrode probe was used in this paper, whereas for imaging deeper features, a 150 mm wide triangular electrode probe was used. The penetration depth can thus be easily modified by using different sizes of either the electrodes and/or the spacing between them. By using a probe array, it should be possible in future work to obtain
Field Code Changed
Formatted: Right: 0.63 cm
an image in real time, without the need for mechanical scanning.
The predictions of FE modelling and the results of preliminary experiments both indicate that the capacitive imaging system has the potential to simultaneously detect surface features, changes in thickness to an air void and cover depth and position to of
rebars in concrete samples. Thus, the technique has the potential to be developed into
a single compact device to detect many different features within concrete samples,
replacing the plethora of current devices required to perform a comprehensive NDE
survey of a concrete structure. Note that, unlike ultrasound and some other techniques,
there is no need for specific surface preparation, and no couplant is required. The technique works in a non-contact and a non-invasive manner, and only requires single-side access to the sample. In addition, the difference in electric properties between details of interest (crack, void and rebar) and concrete is much larger than that between cement paste and aggregate and so that the scattering effect encountered in ultrasonic imaging is absent. The transducers are very simple and cheap – effectively, just copper plates – in contrast to complex and expensive piezoelectric or electromagnetic transducers, which means that a wide range of probe geometries and thus assessment applications could be available to practioners at little added cost. Further development of signal processing algorithms and transducer geometries will lead to improved resolution and potentially extra diagnostic information, such as concrete strength/porosity, bar size, corrosion detection and tracking of moisture content, since all these phenomena will also have an effect on the dielectric properties of the concrete under study.
Acknowledgements
Formatted: Right: 0.63 cm
References
[1] S. Rostam, "High performance concrete cover--why it is needed, and how to achieve it in practice," Construction and Building Materials, vol. 10, pp. 407-421, 1996.
[2] X. Derobert, C. Aubagnac, and O. Abraham, "Comparison of NDT techniques on a post-tensioned beam before its autopsy," NDT and E International, vol. 35, pp. 541-548, 2002. [3] "Ultrasonic tester for concrete," Ultrasonics, vol. 9, pp. 71-71, 1971.
[4] K. Warnemuende and H.-C. Wu, "Actively modulated acoustic nondestructive evaluation of concrete," Cement and Concrete Research, vol. 34, pp. 563-570, 2004.
[5] P. Antonaci, C. L. E. Bruno, P. G. Bocca, M. Scalerandi, and A. S. Gliozzi, "Nonlinear ultrasonic evaluation of load effects on discontinuities in concrete," Cement and Concrete Research, vol. 40, pp. 340-346, 2009.
[6] M. Saafi and T. Sayyah, "Health monitoring of concrete structures strengthened with advanced composite materials using piezoelectric transducers," Composites Part B: Engineering, vol. 32, pp. 333-342, 2001.
[7] J. R. Berriman, D. A. Hutchins, A. Neild, T. H. Gan, and P. Purnell, "The application of time-frequency analysis to the air-coupled ultrasonic testing of concrete," Ultrasonics, Ferroelectrics and Frequency Control, IEEE Transactions on, vol. 53, pp. 768-776, 2006. [8] P. Purnell, T. H. Gan, D. A. Hutchins, and J. Berriman, "Noncontact ultrasonic diagnostics in
concrete: A preliminary investigation," Cement and Concrete Research, vol. 34, pp. 1185-1188, 2004.
[9] M. Schickert, "Ultrasonic NDE of concrete," in Ultrasonics Symposium, 2002. Proceedings. 2002 IEEE, 2002, pp. 739-748 vol.1.
[10] S. A. Abo-Qudais, "Effect of concrete mixing parameters on propagation of ultrasonic waves,"
Construction and Building Materials, vol. 19, pp. 257-263, 2005.
[11] R. K. Dhir, M. R. Jones, and M. J. McCarthy, "Quantifying chloride-induced corrosion from half-cell potential," Cement and Concrete Research, vol. 23, pp. 1443-1454, 1993.
[12] V. Leelalerkiet, J.-W. Kyung, M. Ohtsu, and M. Yokota, "Analysis of half-cell potential measurement for corrosion of reinforced concrete," Construction and Building Materials, vol. 18, pp. 155-162, 2004.
[13] M. Ohtsu and T. Yamamoto, "Compensation procedure for half-cell potential measurement,"
Construction and Building Materials, vol. 11, pp. 395-402, 1997.
[14] S. Ahmad, "Reinforcement corrosion in concrete structures, its monitoring and service life prediction--a review," Cement and Concrete Composites, vol. 25, pp. 459-471, 2003.
[15] G. Klysz and J. P. Balayssac, "Determination of volumetric water content of concrete using ground-penetrating radar," Cement and Concrete Research, vol. 37, pp. 1164-1171, 2007. [16] W. L. Lai, S. C. Kou, W. F. Tsang, and C. S. Poon, "Characterization of concrete properties
from dielectric properties using ground penetrating radar," Cement and Concrete Research,
vol. 39, pp. 687-695, 2009.
[17] V. Barrile and R. Pucinotti, "Application of radar technology to reinforced concrete structures: a case study," NDT & E International, vol. 38, pp. 596-604, 2005.
[18] J. H. Bungey, "Sub-surface radar testing of concrete: a review," Construction and Building
Formatted: Font: 10 pt, Do not check spelling or grammar
Formatted: Font: 10 pt, Italic, Do not check spelling or grammar
Formatted: Font: 10 pt, Do not check spelling or grammar
Formatted: Font: 10 pt, Italic, Do not check spelling or grammar
Formatted: Font: 10 pt, Do not check spelling or grammar
Formatted: Font: 10 pt, Italic, Do not check spelling or grammar
Formatted: Font: 10 pt, Do not check spelling or grammar
Formatted: Font: 10 pt, Italic, Do not check spelling or grammar
Formatted: Font: 10 pt, Do not check spelling or grammar
Formatted: Font: 10 pt, Italic, Do not check spelling or grammar
Formatted: Font: 10 pt, Do not check spelling or grammar
Formatted: Font: 10 pt, Italic, Do not check spelling or grammar
Formatted: Font: 10 pt, Do not check spelling or grammar
Formatted: Font: 10 pt, Italic, Do not check spelling or grammar
Formatted: Right: 0.63 cm
Materials, vol. 18, pp. 1-8, 2004.
[19] D.-M. Bontea, D. D. L. Chung, and G. C. Lee, "Damage in carbon fiber-reinforced concrete, monitored by electrical resistance measurement," Cement and Concrete Research, vol. 30, pp. 651-659, 2000.
[20] N. Ozyurt, T. O. Mason, and S. P. Shah, "Non-destructive monitoring of fiber orientation using AC-IS: An industrial-scale application," Cement and Concrete Research, vol. 36, pp. 1653-1660, 2006.
[21] K. Karhunen, A. Seppanen, A. Lehikoinen, P. J. M. Monteiro, and J. P. Kaipio, "Electrical Resistance Tomography imaging of concrete," Cement and Concrete Research, vol. 40, pp. 137-145, 2009.
[22] P. Purnell, G. G. Diamond, D. A. Hutchins, T. H. Gan, and K. K. Leong, "Capacitive internal imaging technique for concrete," Abstracts: Cement and Concrete Science, pp. 41-44, 15-16th September 2005.
[23] X. Derobert, J. Iaquinta, G. Klysz, and J.-P. Balayssac, "Use of capacitive and GPR techniques for the non-destructive evaluation of cover concrete," NDT & E International, vol. 41, pp. 44-52, 2008.
[24] A. A. Nassr, W. H. Ahmed, and W. W. El-Dakhakhni, "Coplanar capacitance sensors for detecting water intrusion in composite structures," Measurement Science and Technology, vol. 19, p. 075702, 2008.
[25] A. A. Nassr and W. W. El-Dakhakhni, "Non-destructive evaluation of laminated composite plates using dielectrometry sensors," Smart Materials and Structures, vol. 18, p. 055014, 2009.
[26] G. G. Diamond, D. A. Hutchins, T. H. Gan, P. Purnell, and K. K. Leong, "Single-sided capacitive imaging for NDT," BINDT Insigh, vol. 48, pp. 724-730, 2006.
[27] X. Yin, G. G. Diamond, and D. A. Hutchins, "Further invesitigations into capacitive imaging for NDE," BINDT insight, vol. 51, pp. 484-490, 2009.
[28] O. Vendik, S. Zubko, and M. Nikol’skii, "Modeling and calculation of the capacitance of a planar capacitor containing a ferroelectric thin film," Technical Physics, vol. 44, pp. 349-355, 1999.
[29] G. Meng, A. J. Jaworski, and J. C. S. Kimber, "A multi-electrode capacitance probe for phase detection in oil-water separation processes: design, modelling and validation," Measurement Science and Technology, vol. 17, pp. 881-894, 2006.
[30] A. J. Jaworski and G. T. Bolton, "The design of an electrical capacitance tomography sensor for use with media of high dielectric permittivity," Measurement Science and Technology, vol. 11, pp. 743-757, 2000.
[31] F. Jiang, S. Liu, J. Liu, and X. Wang, "Measurement of ice movement in water using electrical capacitance tomography," Journal of Thermal Science, vol. 18, pp. 8-12, 2009.
[32] R. Nimmer, J. Osiensky, A. Binley, K. Sprenke, and B. Williams, "Electrical resistivity imaging of conductive plume dilution in fractured rock," Hydrogeology Journal, vol. 15, pp. 877-890, 2007.
[33] G. M. Maillet, E. Rizzo, A. Revil, and C. Vella, "High Resolution Electrical Resistivity Tomography (ERT) in a Transition Zone Environment: Application for Detailed Internal Architecture and Infilling Processes Study of a Rhône River Paleo-channel," Marine Geophysical Researches, vol. 26, pp. 317-328, 2005.
Formatted: Font: 10 pt, Do not check spelling or grammar
Formatted: Font: 10 pt, Italic, Do not check spelling or grammar
Formatted: Font: 10 pt, Do not check spelling or grammar
Formatted: Font: 10 pt, Italic, Do not check spelling or grammar
Formatted: Font: 10 pt, Do not check spelling or grammar
Formatted: Font: 10 pt, Italic, Do not check spelling or grammar
Formatted: Font: 10 pt, Do not check spelling or grammar
Formatted: Font: 10 pt, Italic, Do not check spelling or grammar
Formatted: Font: 10 pt, Do not check spelling or grammar
Formatted: Font: 10 pt, Italic, Do not check spelling or grammar
Formatted: Font: 10 pt, Do not check spelling or grammar
Formatted: Font: 10 pt, Italic, Do not check spelling or grammar
Formatted: Font: 10 pt, Do not check spelling or grammar
Formatted: Font: 10 pt, Italic, Do not check spelling or grammar
Formatted: Font: 10 pt, Do not check spelling or grammar
Formatted: Font: 10 pt, Italic, Do not check spelling or grammar
Formatted: Font: 10 pt, Do not check spelling or grammar
Formatted: Font: 10 pt, Italic, Do not check spelling or grammar
Formatted: Font: 10 pt, Do not check spelling or grammar
Formatted: Font: 10 pt, Italic, Do not check spelling or grammar
Formatted: Font: 10 pt, Do not check spelling or grammar
Formatted: Font: 10 pt, Italic, Do not check spelling or grammar
Formatted: Right: 0.63 cm
[34] V. Spitas and P. Michelis, "The Potential Drop Technique for Measuring Crack Growth in Shear," in Fracture of Nano and Engineering Materials and Structures, 2006, pp. 463-464. [35] M. Saka, M. Nakayama, T. Kaneko, and H. Abé, "Measurement of stress-intensity factor by
means of a-c potential drop technique," Experimental Mechanics, vol. 31, pp. 209-212, 1991. [36] J. Davis, Y. Huang, S. G. Millard, and J. H. Bungey, "Determination of dielectric properties of
insitu concrete at radar frequencies," in International Symposium Berlin, Germany: DGZfP, 2003.
Formatted: Font: 10 pt, Italic, Do not check spelling or grammar
Formatted: Font: 10 pt, Do not check spelling or grammar
Formatted: Font: 10 pt, Italic, Do not check spelling or grammar
Formatted: Font: 10 pt, Do not check spelling or grammar
Formatted: Font: 10 pt, Italic, Do not check spelling or grammar
Formatted: Font: 10 pt, Do not check spelling or grammar
Formatted: Indent: Left: 0 cm, Hanging: 1.27 cm