Original citation:
Scharf , Kimberley and Smith, Sarah (2010) The price elasticity of charitable giving : does the form of tax relief matter? Working Paper. Coventry: Department of Economics, University of Warwick. (CAGE Online Working Paper Series, Vol.2010).
Permanent WRAP url:
http://wrap.warwick.ac.uk/53972/
Copyright and reuse:
The Warwick Research Archive Portal (WRAP) makes the work of researchers of the University of Warwick available open access under the following conditions. Copyright © and all moral rights to the version of the paper presented here belong to the individual author(s) and/or other copyright owners. To the extent reasonable and practicable the material made available in WRAP has been checked for eligibility before being made available.
Copies of full items can be used for personal research or study, educational, or not-for-profit purposes without prior permission or charge. Provided that the authors, title and full bibliographic details are credited, a hyperlink and/or URL is given for the original metadata page and the content is not changed in any way.
A note on versions:
The version presented here is a working paper or pre-print that may be later published elsewhere. If a published version is known of, the above WRAP url will contain details on finding it.
WORKING PAPER SERIES
Centre for Competitive Advantage in the Global Economy
Department of Economics
March 2010 No.3
The Price Elasticity of Charitable Giving:
Does the Form of Tax Relief Matter?
The Price Elasticity of Charitable Giving:
Does the Form of Tax Relief Matter?
∗Kimberley Scharf (University of Warwick and CEPR)
Sarah Smith (University of Bristol and IFS)✧
This version: March 2010
Abstract
This paper uses a survey-based approach to test alternative methods of channeling tax relief to donors – as a tax rebate for the donor or as a matched payment to the receiving charity. On accounting grounds these two are equivalent but, in line with earlier experimental studies, we find that gross donations are significantly more responsive to a match change than to a rebate change. We show that the difference can largely be explained by the fact that a majority of donors do not adjust their nominal donations in response to a change in subsidy. This evidence adds to the growing empirical literature suggesting that consumers may not react to tax changes. In the case of tax subsidies for donations, this has implications for policy design – for the UK a match-based system is likely to be more effective at increasing money going to charities.
KEY WORDS: charitable giving, tax subsidies, private provision of public goods JEL CLASSIFICATION: C99, D12, D64, H24, H31, H41
*We would like to thank Charities Aid Foundation and Justgiving who allowed us to survey their donors. We received helpful comments on the survey from James Andreoni, Abigail Payne, Rob Sauer, and economists at Her Majesty’s Revenue and Customs, as well as from seminar participants at the Institute for Fiscal Studies and Oxford University. All remaining errors are our own.
1
Introduction
The majority of developed countries offer government support to charities in the form of tax relief for private donations. Most offer a tax rebate – either deductions from taxable income or tax credits granted at the marginal rate of income tax; some countries, including the UK, also offer a match element, i.e. charities can claim tax relief on donations at an income-tax equivalent rate.
One of the aims of offering tax relief – whether through a rebate or a match – is to encourage donations by lowering the “price” of giving to charity. Empirical evidence on the responsiveness of giving to changes in the tax-price is, however, mixed: early studies suggested the price elasticity was negative and greater than unity in absolute value (see Clotfelter, 1985, Steinberg, 1990, and Triest, 1998), but more recent studies found that, after correcting for short-term price effects, tax-price elasticities were significantly smaller than this in absolute terms.1
Recent experimental evidence has cast doubt on the idea that there is a single price elasticity, pointing to a possible effect of the form in which tax relief is offered. Specifically, lab and field experiments have shown that offering donors a match has a bigger effect on the total amount of money going to the charity than offering a rebate of equivalent value (Eckel and Grossman, 2003 and 2008). Eckel and Grossman suggest, but do not test, one possible explanation that a match may create a warmer glow for consumers since it is associated with a co-operative frame (Bénabou and Tirole, 2006) as opposed to the reward frame of the rebate.
For policy-makers, this finding is potentially important since it suggests that directing tax relief through a match rather than a rebate may be more efficient in terms of increasing donations – but this conclusion is tempered by the fact that the experiments were not carried out in relation to fiscal incentives, but to incentives offered by
individual charities. Understanding exactly why donations respond more to a match than to a rebate is also important for policy design.
1
Most studies are US based and exploit changes in rebate rates for itemizers. Randolph (1995) uses panel data to find a long-run price elasticity of giving of -.51. Using a longer but similar panel to that used by Randolph but a different estimation technique, Auten, Sieg and Clotfelter (2002), arrive at the
The first contribution of this paper is explicitly to test the responsiveness of donations to changes in match and rebate incentives offered through the tax system. The UK makes an ideal case study because the main scheme through which individuals get tax relief on their donations – known as Gift Aid – has both a match and rebate element for higher-rate taxpayers.2 Looking at the responsiveness of donations in relation to fiscal incentives is important since consumers may respond differently to changes in tax incentives than to changes in giving incentives for a single charity – the focus of recent field experiments (see Karlan and List, 2007, Eckel and Grossman, 2008, Huck and Rasul, 2009). There are many reasons why the response to tax incentives may be different, including possible substitution effects associated with single charity
incentives, since the relative prices of giving to different charities change; consumers may also interpret the offer of a match or rebate as a quality signal for a particular charity.
Our results show that, for tax incentives, the match elasticity is significantly greater than the rebate elasticity. This finding is in line with the earlier experimental studies. We also show that this difference holds for a number of sub-groups, including those who reclaim the rebate, those with a higher level of understanding of tax incentives for giving and those who give substantial amounts to charity (more than £40,000 a year).
We do, however, find some differences with the results of the single-charity
experimental studies. We find that both gross donations (how much the charity gets, including the value of tax relief) and nominal donations (how much the donor gives out of net-of-tax income) respond to changes in the match rate. This is in contrast to Karlan and List (2007) and Huck and Rasul (2009) who find that nominal donations respond to the presence of a match but not to the size of the match.
The second contribution of the paper is to shed light on the underlying reason for why donations respond more to the match than to the rebate. We show that the difference can be largely attributed to the fact that the majority of donors do not adjust their nominal donations (i.e. their donations out of net-of-tax income) in response to either a change in the match or a change in the rebate. Total donations received by charities (i.e. gross of tax relief) therefore adjust more to a change in the match than they do to a change in the
rebate.3 Among those who do adjust their nominal donations, we cannot reject that the match and rebate elasticities are the same.
Our finding that most donors do not adjust their nominal donations in response to a change in tax is consistent with other recent evidence that many consumers do not fully optimize with respect to tax-inclusive prices (Chetty et al., 2009; Finkelstein, 2009). In that literature, individuals respond or do not respond to a tax, rather than a subsidy as in our case, and observed choices are made in terms of quantity demanded, rather than expenditures as in our case. Nevertheless our findings are broadly in line with those studies in that a large proportion of donors appear not to process the change in subsidy even when all the relevant information is available to them.
For policy-makers the finding that gross donations are more responsive to a match than to a rebate suggests that, for a given total amount of public funding available to support private donations, shifting tax relief away from a rebate system and towards a match system would result in a higher volume of total donations going to charity – at least in the short run. We conclude the paper by showing for the UK that it would be possible to introduce a cost-neutral change in the system of tax relief that increases the total amount of funding for charities.
The rest of the paper is structured as follows. Section 2 describes the relevant features of the UK system of tax relief on donations. Section 3 presents our survey design and section 4 presents the main findings. Section 5 explores heterogeneity of responses across donors. Section 6 discusses the implications of our results for policy.
2
Gift Aid in the UK
Unlike the US, where tax subsidies for donations are in the form of a deduction, the main scheme for providing tax relief on donations in the UK offers a match subsidy on donations made by all taxpayers through the scheme, combined with an additional rebate subsidy for higher rate taxpayers.
The scheme, known as Gift Aid, works in the following way: individuals donate to charity out of their net-of-tax income.4 The charity can reclaim tax relief on donations
made by taxpayers at the basic rate of tax, currently 20 per cent,5 which means that for every £1 donated to charity, the charity can reclaim 25 pence.6 This can be thought of as a match on donations made by taxpayers. In addition, higher-rate taxpayers can reclaim a rebate equal to the difference between the higher rate of tax at 40 per cent and the basic rate of tax at 20 per cent on the “gross” equivalent donation, i.e. the amount before basic rate tax was deducted. This means that for every £1 donated out of net income, a higher-rate taxpayer can get an additional rebate of 25 pence.
[image:7.595.74.500.398.486.2]This two-part system is slightly more complicated than the US system of deductions but is designed for a tax system where the majority of taxpayers do not file tax returns. Note that in order for higher-rate taxpayers to receive the additional higher rate rebate, they need to make a claim through a self-assessment tax return (completed by approximately a third of all UK taxpayers) or ask for a change in their tax code via a simpler tax review form. Either way, there is an additional administrative cost for donors on the rebate element compared to the match element.
Table 1: Tax relief on charitable donations in the UK
Gross donations Cost of tax relief
Gift Aid £4,305 million £1,217 million(1)
Payroll Giving £104 million £30 million(2)
Tax relief on shares or property £266 million(3) £70 million(3)
Legacies £1,932 million £290 million(3)
Notes to table:
(1) The cost of Gift Aid tax relief comprises Gift Aid repayments to charities, including transitional relief payments, and the estimated cost of higher-rate relief.
(2) Estimated
(3) The most recent statistics are for 2007-08 Source: HM Revenue and Customs
4 When it was originally established, tax relief was only given for donations exceeding a minimum threshold. This threshold was initially set at £600, reduced to £400 from May 1992 and to £250 from March 1993 and abolished altogether in 2000.
5 Note that individuals must have paid the amount of tax that the charity is going to reclaim, i.e. the relief is a non-refundable tax credit.
Gift Aid is not the only scheme offering tax incentives for UK donors. There is also a payroll-giving scheme that allows donors to give to charity out of their gross earnings; gifts of shares and property also attract tax relief and charitable bequests are exempt from inheritance tax. However, as shown in Table 1, Gift Aid accounts for the majority of tax-free donations – more than £4 billion in 2008-09 out of estimated total donations of around £10 billion.7 Given the presence of both a match and a rebate element for higher-rate taxpayers, Gift Aid provides the ideal opportunity to test the effect of match and rebate subsidies in a fiscal policy setting.
The effect of offering tax relief through Gift Aid is to lower the “price” of giving to charity. The price of giving £1 of funding to the charity is equal to (1 – r)
/
(1 + m) where r is the rebate rate and m is the match rate. In the UK, the effective match and rebate rates are .25, but only higher-rate taxpayers are eligible for the rebate. Both basic-rate taxpayers and basic-rate taxpayers get relief at their marginal tax basic-rates – for higher-rate taxpayers, the price of giving £1 of funding to a charity through Gift Aid istherefore £.60, while for basic-rate taxpayers it is £.80.
Assuming that consumers care about how much money charities receive,8 this reduction
in price brought about by the tax relief would be expected to result in an increase in total funding going to charities (i.e. gross donations) but not necessarily an increase in
individuals’ net donations. Donors may take advantage of the fact that the government has increased the value of the subsidy to charity to reduce the value of their cash
donation, an effect referred to as “crowd out” (see Andreoni, 2006, for a discussion).9 If the price elasticity of gross donations is less than unity in absolute value – as suggested by recent estimates (e.g. Randolph, 1995, and Bajika and Heim, 2008) – then the effect
7 The figure for total donations is an estimate. However, it suggests that a large proportion of all donations do not attract tax relief. This includes many donations made into collecting tins, as well as donations made by non-taxpayers.
8 People may also wish to give to charity to signal their wealth and/or generosity. In this case gross donations would be expected to respond more to changes in the rebate – which change the price of the signal – than to changes in the match – which do not. Since this is inconsistent with the empirical findings, here we do not consider this possible motivation for giving.
of tax relief will be to increase gross donations received by charity, but individuals’ net donations will fall.
However, the experimental findings of Eckel and Grossman (2003) suggest that there may not be a single price elasticity, with gross donations responding differently to changes in the match than to changes in the rebate. In light of those results, it is
important to account not only for how tax relief affects the price of giving, but also for the actual form tax relief takes.
3
Sample and survey design
Eckel and Grossman (2003) tested responses to match and rebate in a laboratory experiment that involved 181 undergraduate students each given twelve allocation problems varying in the initial endowment and match and rebate rates. In the
experiment, match rates resulted in gross donations that were 1.2 to 2 times greater than the equivalent-value rebate. The estimated match elasticity was -1.14 compared a rebate elasticity of -.36. Similar results were obtained from a field experiment (Eckel and Grossman, 2008). Based on approximately 7,000 responses to a mail-out on behalf of Minnesota Public Radio, offering match rates resulted in a higher level of gross
donations than equivalent-value rebates. The estimated elasticity of gross donations was -1.05 in the case of the match rate and -.11 in the case of the rebate rate.
The aim of this study is explicitly to test whether the match and rebate elasticities differ with respect to tax-price changes. The overall design of our study was broadly consistent with the field experiment described above.10 Survey respondents were randomly
allocated across “treatments” offering different levels of match and/or rebate subsidy in order to test how donations respond. However, for practical reasons, the treatments in our study were purely hypothetical; we do not have any information on how donors actually respond, instead individuals were asked to say how they would respond to hypothetical policy scenarios.
There is an obvious potential concern that our results may be affected by hypothetical or strategic bias (see Harrison and Rutström, 2009). We attempted to reduce this problem from the start by informing the respondents that the survey was carried out on behalf of the UK Treasury and emphasizing the need to answer questions carefully and honestly
to “ensure that any changes in the tax treatment of donations are designed to help both donors and charities.”11 We also asked respondents to consider how the alternative tax treatments would affect a specific donation that they were likely to make in the next six months in order to make it more concrete.
Finally, the survey itself contains a number of consistency checks. In particular we can exploit the fact that each individual was asked to respond to two scenarios to check for consistency. For example, we deliberately included the same treatment twice but in a different order to test for so-called “embedding effects” (the phenomenon that the responses depend on the way, and the order, in which questions are presented, see Diamond and Hausman, 1994). As shown below, we find no evidence that such embedding effects were important in practice.
3.1 The sample
Invitations to take part in an on-line survey were e-mailed to 40,000 donors, split equally between people with a Charities Aid Foundation (CAF) Charity Account and people who had donated online through Justgiving during the previous six months.
CAF is a charity that, among a range of services for individuals and charities, provides a charity account to donors to facilitate tax-efficient giving. Individuals pay into an
account and use the funds to make donations to any registered charity (currently more than 80,000) through a variety of different means (direct debit, online, by phone or using a CAF card or cheque book). For the survey, the relevant population consisted of 32,339 CAF account-holders with an e-mail address. E-mail invites were sent to a randomly selected sample of 20,000 individuals within this population.
Justgiving is an online giving portal that processes donations from individuals direct to charity and individual sponsorships of charity fundraisers. Justgiving reclaims tax relief at the basic rate of tax (assuming the donor is a taxpayer) and passes on the donations and the tax relief to member charities. Since it started in 1994, it has processed donations for more than 8,000 charities. For the survey, a random sample of 20,000 donors were sent an e-mail invite out of a total population of 2.56 million who had donated via Justgiving in the past six months.
The response rates were 9.86% among the CAF sample and 9.19% among the Justgiving sample. After some data cleaning, our analysis sample comprises 3,146 donors – 1,442 higher-rate taxpayers and 1,704 basic-rate taxpayers.12 Descriptive statistics on this sample are summarised in Appendix 1. Due to both sampling and response bias, our responses are unlikely to be fully representative of the UK population of Gift Aid donors. In Appendix 1 we also present some evidence that we over-sample larger
donors; respondents may also be better informed about in tax incentives than the average Gift Aid donor. Section 5 analyses responses among various sub-groups, which gives an indication of how this is likely to affect our results.
3.2 Survey design
Respondents who were higher-rate taxpayers were randomly allocated to one of five “treatments” each of which contained two hypothetical scenarios reflecting different combinations of match and rebate. Basic rate taxpayers were randomly allocated to one of two “treatments”, also each with two scenarios. All the scenarios are summarized in Table 2. The design and description of the scenarios in the survey reflect the way Gift Aid is currently portrayed to donors – i.e. the charity receives X pence for every £1 given out of net-of-tax income and the individual can reclaim X pence for every £1 given out of net-of-tax income.
For each scenario, respondents were asked how the change in tax treatment would affect their giving in relation to a specific “initial donation”, an amount they reported that they were likely to give in the next six months. 13 Figure A1 (Appendix 2) shows how the hypothetical scenarios appeared in the on-line survey. Note that the specific terms, “match” and “rebate” were not used in the survey because they are not used to describe the scheme in practice. Respondents were first asked whether the change in tax
treatment would mean they would give the same, give more or give less. A follow-up question then asked how much they would give if they reported that their donation would change.
12 A small-scale pilot was used to test the questionnaire and observe response rates. In the pilot, individuals were randomly offered a small financial inducement to take part but this had no significant effect on response rates and was not offered in the main survey.
Table 2: Alternative tax treatments
Match/rebate per £1 nominal
donation
Price Match/rebate per
£1 nominal donation
Price Mean GA
donations N
(a) Higher rate taxpayers – changes in either match or rebate (current system: m = .25, r = .25)
A1 m = .30, r = .25 .577 A2 m = .25, r = .30 .560 £2,211 290
B1 m = .20, r = .25 .625 B2 m = .25, r = .20 .640 £2,818 293
(b) Higher rate taxpayers – changes in both match and rebate (current system: m = .25, r = .25)
C1 m = .50, r = 0 .667 C2 m = .30, r = 0 .769 £2,043 289
D1 m = .30, r = 0 .769 D2 m = .37, r = 0 .730 £1,905 288
E1 m = .66, r = 0 .600 E2 m = .50, r = 0 .667 £2,934 282
(c) Basic rate taxpayers – changes in match (current system: m = .25, r = 0)
F1 m = .30, r = 0 .769 F2 m = .37, r = 0 .730 £821 856
G1 m = .37, r = 0 .730 G2 m = .30, r = 0 .769 £859 848
For each scenario, respondents were asked how the change in tax treatment would affect their giving in relation to a specific “initial donation”, an amount they reported that they were likely to give in the next six months. 14 Figure A1 (Appendix 2) shows how the hypothetical scenarios appeared in the on-line survey. Note that the specific terms, “match” and “rebate” were not used in the survey because they are not used to describe the scheme in practice. Respondents were first asked whether the change in tax
treatment would mean they would give the same, give more or give less. A follow-up question then asked how much they would give if they reported that their donation would change.
For higher-rate taxpayers, two treatments – set A and set B in panel (a) – tested responses to changes in either the match or the rebate (but not both). Note that the changes in match and rebate were symmetrical in terms of pence change for each £1
donated but, as shown in column (III), not price changes.15 This is in contrast to Eckel and Grossman (2003, 2008) who defined match and rebate pairs that were equivalent in value but had different rates – for example, a 25% match and a 20% rebate. However, experimental evidence shows that individuals respond differently to alternatives that produce exactly the same outcome but that are presented to them through different “frames of reference” (Kahneman and Tversky, 1979). In this case, there is a potential concern that donors may respond more to what they perceive is a “larger” match.
In our survey, the changes in the match and rebate are expressed in terms of equal pence changes but are not equivalent in terms of price. For example, in Set A, individuals are faced with two scenarios:
1) A match of 30 pence and a rebate of 25 pence (price of giving = .577);
2) A match of 25 pence and a rebate of 30 pence (price of giving = .560).
If the match and rebate elasticities are the same, there should be a larger percentage change in gross donations under (2) because the price change is greater. If the donor perceives the changes under (1) and (2) to be equivalent, gross donations should respond in the same way under both. If we find that gross donations respond less to (2), this is a strong indication that donations are less responsive to changes in the rebate than to changes in the match.
The other treatments for higher-rate taxpayers – sets C, D and E in panel (b) – were designed to explore responses to specific, possible policy options. They involved scenarios that eliminated the rebate altogether and made the match subsidy more generous. In set E, scenario 1 the match is 66 pence, changing the form of the tax subsidy but not the price. The other scenarios in sets C, D and E, while increasing the generosity of the match subsidy, involve increases in the price of giving compared to the current system. The same scenarios were included twice (C1 & E2 and C2 & D1) to test for embedding effects.
The current system only offers basic rate taxpayers a match and the scenarios, shown in panel (c), tested changes in the match rate. Basic rate taxpayers were randomly assigned to two treatments that offered the same scenarios, but in a different order.
Table 2 also summarizes the number of people faced with each scenario and the average amount donated by these individuals through Gift Aid over the previous 12 months. While there is some variation in donations across scenarios, none of the differences is statistically significant, indicating that the random allocation was effective.
4
Estimating responses to match and rebate
We estimate the following random effects model16 separately for basic rate and higher-rate taxpayers to obtain the percentage change in donations associated with each of the scenarios:
ln gis = αi + βs + uis , (1)
where gis is the gross donation of individual i under scenario s – defined as the nominal
donation the individual makes out of net-of-tax income grossed-up by the value of the match if present (i.e. the total donation received by the charity);17
αi is a fixed individual
specific term that captures the effects of observed and unobserved characteristics on donations; βs captures the response to each of the counterfactual scenarios (with β0 = 0); uis is a zero-mean, random error term associated with each level of donation for each
individual that can be thought of as capturing rounding or reporting error for each scenario.
In the first instance, we include indicators for all ten scenarios for higher-rate taxpayers and four scenarios for basic-rate taxpayers to test for embedding effects. Tests for significant differences across the scenarios, reported in Appendix A2, showed there were significant differences in gross donations across distinct scenario pairs and not across same scenario pairs. This acts a check on the reliability of our results, and is consistent with there being no embedding effects.
Of course, some of the variation in gross donations comes from the match rate itself. However, looking at the results from running the same regressions on nominal donations (Appendix A2), there were many instances of significant differences across distinct
16 This is efficient and unbiased if the rebate and match terms are unrelated to individuals’ characteristics. Since the rebate and match terms are randomly allocated to individuals this should be true by assumption. Very similar results were obtained from a fixed effects model.
scenario pairs. This is in contrast to the findings from recent field experiments run by Karlan and List (2007) and Huck and Rasul (2009), which found that nominal donations were insensitive to changes in the match rate (although not to the presence of a match rate).
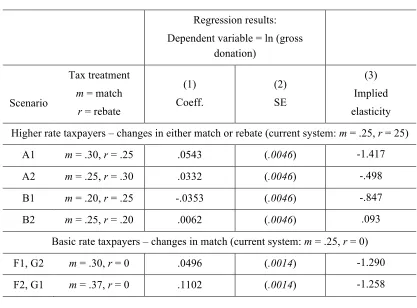
With no significant difference in gross donations across same-scenario pairs, we choose to focus the rest of the analysis on the smaller set of distinct scenarios. Table 3
summarises the results for the scenarios that change either the match or rebate, which are comparable with previous studies. Among higher-rate taxpayers, the results show a significantly larger change in gross donations for a change in the match than for the same pence change in the rebate.
Table 3 also shows the implied elasticity of gross donations for each scenario (column (3)) – based on the estimated percentage change in donations and the associated percentage price change.18 The difference in elasticities between the match and rebate changes is even greater than the difference in percentage changes in gross donations because the change in the rebate is associated with a smaller percentage change in price. Looking at column (3), panel (a), the match elasticity for higher-rate taxpayers is -1.417 for an increase in the match and -0.847 for a decrease in the match. For changes in the rebate, the estimates are -0.498 and 0.093 respectively. For basic-rate taxpayers, the implied match elasticities are -1.290 and -1.258.
In line with the earlier experimental studies, we therefore find that the match elasticity is greater than the rebate elasticity. In the previous studies, the estimated match elasticities were in the range -1.14 to -1.05 and the rebate elasticities were in the range -.36 to -.11. Of course, our estimates may not be directly comparable because of differences in sample composition across the studies.19 As we show in the next section, there is some
variation in elasticities across the population, according to characteristics such size of donation.
18 We use a base price of 0.6 although, as we show later, many higher-rate taxpayers do not reclaim the rebate and so face and effective price of 0.8.
Table 3: Main results
Regression results: Dependent variable = ln (gross
donation)
Scenario
Tax treatment
m = match
r = rebate
(1) Coeff.
(2) SE
(3) Implied elasticity
Higher rate taxpayers – changes in either match or rebate (current system: m = .25, r = 25)
A1 m = .30, r = .25 .0543 (.0046) -1.417
A2 m = .25, r = .30 .0332 (.0046) -.498
B1 m = .20, r = .25 -.0353 (.0046) -.847
B2 m = .25, r = .20 .0062 (.0046) .093
Basic rate taxpayers – changes in match (current system: m = .25, r = 0)
F1, G2 m = .30, r = 0 .0496 (.0014) -1.290
F2, G1 m = .37, r = 0 .1102 (.0014) -1.258
5
Heterogeneity of responses
[image:16.595.80.497.89.397.2]In this section we explore the responsiveness of donations to changes in the match and rebate among a number of sub-groups. The aim is both to illustrate differences across groups and to explore possible explanations for the observed difference in match and rebate elasticity.
Table 4 reports estimates of elasticities for different sub-groups. We focus on higher-rate taxpayers and on responses to changes in either the match or the rebate (i.e. the set of four scenarios in panel (a) in Table 2). Because of the smaller number of observations in each group we pool across the four scenarios and run regressions of the form:20
ln gis = αi + βr ln (1 −rs) −βm ln (1 + ms) + uis , (2)
where βm and βr capture the elasticity of gross donations with respect to the match and
rebate, respectively.
20 This assumes that gross donations depend on the price in the following way g
i = θi qβr , where q = (1 −r) / (1 + m)βm/βr, and β
5.1 Reclaimers and non-reclaimers
One possible explanation for why donations are more responsive to the match than to the rebate may be because of the additional cost for the donor associated with reclaiming the rebate, involving filling in a tax form. In practice, many higher-rate taxpayers do not get the rebate and their donations are therefore only likely to respond to changes in the match rate and not to changes in the rebate (although changes in the rebate may affect the probability of reclaiming). We explore this by comparing responses among
reclaimers and non-reclaimers.21
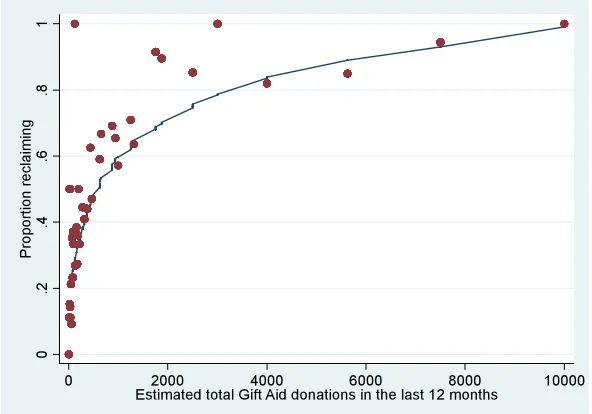
In our sample, 44% of higher-rate taxpayers were non-reclaimers. As might be expected if the decision to reclaim were based on costs and benefits,22 the probability of
reclaiming is closely linked to the amount donated – from fewer than 20% of those who give a few pounds a year through Gift Aid to around 75% of those who give more than £2,000 a year (Figure 123).
However, the presence of many non-reclaimers cannot fully account for the higher
match elasticity. As shown in Table 4 the estimated rebate elasticity among reclaimers is higher than among non-reclaimers, as would be expected (-.415 compared to .032).24
However, among reclaimers, the estimated match elasticity is -1.277 and is significantly higher than the rebate elasticity.
21 We did not directly ask whether changes in the rebate affected the decision to reclaim; we therefore split the sample by whether people currently reclaim or not.
22 More than half of reclaimers said they were not aware they could. But nearly one third of non-reclaimers cited the time and effort it would take, while a further 19% said that it was too complicated. One-quarter said that they did not reclaim because they would only get a small amount of money back. (Respondents could tick more than one answer.)
23 Those who give more than £10,000 are not shown in this Figure; 97% of this group said that they reclaimed.
Figure 1: Proportion of donors who reclaim, by size of donations
Note: Shows the proportion of reclaimers, according to total donations, together with a smoothed, non-parametric estimator of the relationship between donation size and probability of reclaiming.
Table 4: Estimated elasticities for sub-groups
Estimated match elasticity Estimated rebate elasticity P-value
All higher-rate taxpayers
-1.127 (.067) -.212 (.041) .0000
Whether or not individual reclaims higher-rate rebate
Reclaimers -1.277 (.096) -.415 (.091) .0000
Non-reclaimers -.946 (.091) .032 (.054) .0000
Level of understanding (higher-rate reclaimers)
“Good” -1.368 (.116) -.440 (.070) .0000
“Poor” -1.095 (.170) -.366 (.102) .0000
Size of donations (higher-rate reclaimers)
Quartile 1: £334 -1.177 (.220) -.473 (.132) .0002
Quartile 2: £1,056 -1.220 (.170) -.277 (.119) .0000
Quartile 3: £2,951 -1.154 (.180) -.366 (.110) .0000
Quartile 4: £20,193 -1.496 (.202) -.559 (.123) .0000
Top decile: £39,127 -1.207 (.334) -.486 (.199) .0170
Whether or not donor adjusts nominal donations (higher rate reclaimers)
Adjusters -1.929 (.297) -1.431 (.179) .0581
5.2 Level of understanding
Another factor that is likely to affect how people respond to the hypothetical scenario is whether or not they understand the implications of the proposed change in tax treatment for the price of giving. The effect of the proposed tax change on price is not explained in the description of the scenario (see Figure A2) – deliberately so since donors should ideally respond to the scenario as they would to a change in the tax treatment, based on their perception of how the tax change might affect the price of giving and their current level of understanding.
However, it is possible that at least some people do not fully understand the effect of the proposed tax changes on the price of giving; they might also find it easier to understand the implications of one of the two types of relief (match or rebate). In practice, therefore, the response might vary according to whether people understand the implications of the proposed tax change or not.
To explore this, we analyse the responses separately for donors according to their likely level of understanding of tax incentives. This is assessed on the basis of their response to a question about how much the match is worth to charities. Respondents are told that the charity can reclaim basic-rate tax and asked to say how much the charity gets for each £1 donated out of net-of-tax income (choosing one out of a set of possible responses). If they respond correctly, we define them as having a good level of understanding. If they do not choose the correct answer, we define them as having a poor level of
understanding. We find some difference between those with “good” and “poor” understanding” – those with a good understanding are more responsive to changes in both match and rebate. Nevertheless, we find that the match elasticity is significantly higher than the rebate elasticity for both groups.
5.3 Size of donations
5.4 Adjusters/non-adjusters
A unique feature of our survey approach, compared to existing field experiments, is that it has a pseudo-panel element allowing us to see exactly how individuals respond to the proposed tax changes. In practice, we find that a large number of people do not respond to the proposed tax change by adjusting their nominal donations (i.e. out of net-of-tax income). The high levels of non-adjustment – the majority of donors for each scenario – are shown in Table 5, which summarises the proportion who adjust their donations, separating higher-rate reclaimers and non-reclaimers.
The very high level of non-adjustment is a striking finding from our survey. A potential concern is that it may be an artefact of the hypothetical nature of the survey; there is no benefit to respondents if they respond truthfully and calculating the optimal level of donation associated with the new tax price may have a small computational cost. It may simply be easier for donors to say that they would not adjust their nominal donations. However, counter to this, Table 5 shows that the proportion adjusting varies
Table 5: Estimated elasticities for sub-groups
Match/rebate per £1 nominal donation
Proportion adjusting Match/rebate per £1
nominal donation
Proportion adjusting
Higher-rate reclaimers
m = .30, r = .25 .149 m = .66, r = 0 .239
m = .25, r = .30 .377 m = .50, r = 0 .225
m = .20, r = .25 .086 m = .37, r = 0 .266
m = .25, r = .20 .126 m = .30, r = 0 .222
Higher-rate non-reclaimers
m = .30, r = .25 .060 m = .66, r = 0 .129
m = .25, r = .30 .090 m = .50, r = 0 .146
m = .20, r = .25 .024 m = .37, r = 0 .125
m = .25, r = .20 .012 m = .30, r = 0 .067
Basic-rate
significantly across the scenarios – among higher-rate reclaimers, the proportion adjusting to changes in the rebate is typically greater than the proportion adjusting to changes in the match while among higher-rate reclaimers typically more people adjust to a larger change in the match rate. In many cases, these differences across scenarios arise because the same individual reports that they will adjust in the case of one of the
scenarios and not the other. Also, as already noted, our finding on the match and rebate elasticities is in line with those from previous experimental studies, again suggesting that the responses are plausible.
Non-adjustment can potentially explain the difference between the observed match and rebate elasticities because of the way in which the match and rebate differentially impact on gross donations among non-adjusters – the elasticities of gross donations with respect to match and rebate among non-adjusters are -1 and zero respectively. Assuming that there is a single underlying elasticity, ε, with respect to changes in the match or rebate, but that, for whatever reason, only a proportion of donors πm ( πr ) adjust to the match (rebate) then the observed match ( ) and rebate ( ) elasticities are given by:
, (3)
(4)
The observed match elasticity will be greater than the observed rebate elasticity if
(5)
If the probabilities of adjusting to the match and rebate are the same (and less than one), the observed match elasticity will always be greater than the observed rebate elasticity. In practice, we find that more people adjust to a change in the rebate than to a change in the match (see Table 5). However, based on the observed proportions adjusting (and focusing on responses to an increase in match/rebate), the observed match elasticity for higher-rate reclaimers would still be greater than the observed rebate elasticity so long as the elasticity among adjusters is less than 3.70.
Table 4 shows estimates of match and rebate elasticities separately for adjusters (i.e. donors who adjust to at least one of the two scenarios). Within this group, gross
similar, and that much of the explanation for the large observed difference between match and rebate elasticities both here and in the earlier experimental studies lies in the fact that many donors do not adjust their nominal donations in response to a tax change, and the differential implications of changes in the match and rebate for gross donations among non-adjusters.
What then explains why so many donors do not adjust their nominal donations in line with tax changes? Table 6 gives some insights, summarising donors’ responses when they were asked why they were not going to change their donations. The most
commonly given reason is that donors decide on their level of nominal donations before taking account of the tax relief. Within the literature on why people give to charity, there are a number of possible explanations for why individuals may care about their level of nominal donations (rather than the amount of money going to the charity), including a desire to signal either their wealth or generosity.25 However, in these cases, the level of donations would be expected to respond more to a change in the rebate, which would change the price of the signal, than to a change in the match, which is not consistent with the empirical findings.26 Instead, in line with other studies on consumer behaviour
Table 6: Main reason for not adjusting nominal donations
Non-reclaimers Reclaimers
I make my decision about how much to give before considering the tax relief
55.8% 49.2%
The tax relief has no effect on my decision about how much to give
20.1% 19.2%
I have a regular commitment to giving money that I don’t want to change
11.2% 20.0%
I prefer to give a rounded amount and not make small adjustments
5.5% 5.7%
The change in tax is so small, it is not worth
bothering about 4.6% 3.6%
Other/ don’t know 2.9% 2.5%
Number of observations 583 647
25 See Andreoni (2006) for a discussion of the literature that addresses motives for giving.
in response to taxes (Chetty et al., 2009, Finkelstein, 2009), we interpret these responses as an indication that tax incentives are not “salient” for individuals’ decisions about how much to give. The other responses indicate that there may be costs associated with processing the change in instrument and adjusting the level of donation.27
6
Implications for policy design
The role of private provision alongside public provision of collective goods has been the source of much debate in the economics literature and in the policy debate, and
continues to be so.28 Even abstracting from this broader question, there is still the narrower question of why government would want to support private charities by offering tax incentives to private donors rather by direct government grants to charities.
How responsive donations are to changes in the price of giving is crucial in this respect. A value of the price elasticity of giving equal to unity in absolute value implies that net donations are insensitive to tax incentives, and that gross funding for charities increases simply by the amount of the tax relief – as it would if government support was delivered through a direct grant. Thus, only if the elasticity is greater than unity in absolute value, there is a prima facie argument for tax incentives. Nevertheless, a well-known argument due to Roberts (1987) shows that even if net donations do not increase when tax relief is provided, delivering government support via tax relief can still dominate direct
government grants to charities if the latter would have the effect of crowding out private donations – an effect for which there is convincing evidence (Andreoni and Payne, 2001).
Taking the objective of promoting private provision and the choice of doing so through incentives as given, the observed difference between the match and rebate elasticities – with the former being greater than the latter – suggests that it would be more efficient to offer tax subsidies in the form of a match rather than a rebate, in terms of securing more money for charities.
To explore this conjecture further, our hypothetical scenarios included a number of options that removed the rebate altogether and instead channelled all tax relief to
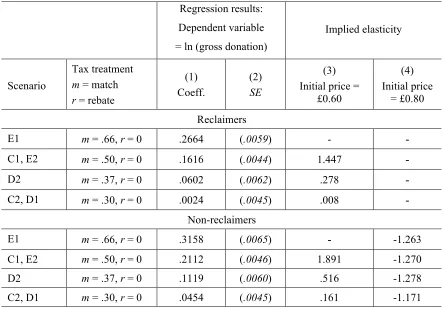
charities as a higher match rate (Table 2, panel (c)). Table 6 shows the estimated average change in gross donations – and implied elasticities – associated with each of these options, focusing on higher-rate taxpayers. We run separate regressions for reclaimers and non-reclaimers.
The average effect on gross donations is positive in all cases, although insignificant in the case of offering a 30 pence match to reclaimers. In Scenario E1, the price of giving is unchanged compared to the current system; the other scenarios involve a reduction in the price of giving and the implied price elasticities shown in column 3 therefore have the “wrong” sign when compared to the current price of £0.60 that incorporates the effect of both match and rebate element. In fact, for non-reclaimers, the changes make the system of tax relief more generous; the implied elasticities when the initial price is taken to be £0.80 (i.e. including just the match) are shown in column 4.
Table 6: Estimated elasticities for alternative policy options
Regression results: Dependent variable = ln (gross donation)
Implied elasticity
Scenario
Tax treatment
m = match
r = rebate
(1) Coeff.
(2)
SE
(3) Initial price =
£0.60
(4) Initial price
= £0.80
Reclaimers
E1 m = .66, r = 0 .2664 (.0059) - -
C1, E2 m = .50, r = 0 .1616 (.0044) 1.447 -
D2 m = .37, r = 0 .0602 (.0062) .278 -
C2, D1 m = .30, r = 0 .0024 (.0045) .008 -
Non-reclaimers
E1 m = .66, r = 0 .3158 (.0065) - -1.263
C1, E2 m = .50, r = 0 .2112 (.0046) 1.891 -1.270
D2 m = .37, r = 0 .1119 (.0060) .516 -1.278
[image:24.595.76.520.414.724.2]These regression results give an indication of the average change in gross donations for reclaimers and non-reclaimers. The overall effect on gross donations, however, needs to take into account the relative proportions of these two groups in the population of Gift Aid donors; and also the fact that bigger donors are typically more responsive than smaller. We therefore estimate the likely overall effect on gross donations, as the following:
(6)
where w is a weight given to each high-rate taxpayer group (N, non-reclaimers, and R, reclaimers) to re-weight the sample proportions to those in the population29; G0 is initial
gross donations. We do the same for the likely effect on the cost of tax relief to the government.30
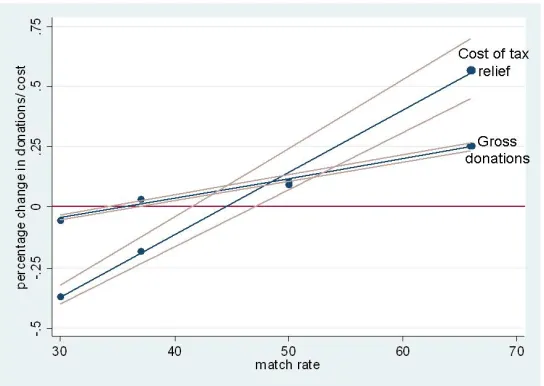
The results are shown in Figure 2. We show both the estimated percentage change in gross donations and the estimated percentage change in the cost of tax relief for each of the four distinct match rates in the scenarios – £0.30, £0.37, £0.50 and £0.66 – together with smoothed, linear predictions. The central estimates, shown by the bold lines, assume that 35% of higher-rate taxpayers reclaim; we also carry out sensitivity analysis, varying the proportion of higher-rate taxpayers who reclaim in the population by ten percentage points above and below the central assumption (shown by the paler lines).
The aims is to show the possibility of increasing gross donations, without increasing the cost of tax relief compared to the current system. The results suggest that this would be possible by withdrawing the rebate and replacing it with a match in the range £0.42 to £0.47, depending on the proportion of higher-rate reclaimers. Alternatively, there is a possible policy change that maintains the current level of gross donations but with a cost saving (a match rate of £0.35).
Of course, in practice, if the reform were systematic and permanent, then the long-run elasticities may differ from those suggested by our survey responses. Also, the
29 Government statistics on the value of tax relief claimed suggest that 35% higher-rate taxpayers reclaim and we adjust the sample proportion in line with this. See Appendix A1 for further information.
projections do not take into account potential differences in welfare effects arising from donors’ inconsistent responses across the two instruments. As Chetty et al. (2009) point out, changes in tax instruments that induce no adjustments can also generate welfare costs due to imperfect optimization on the part of economic agents – i.e. the welfare costs of the associated mistakes made.
[image:26.595.166.438.467.660.2]In the case of private contributions to collective goods, under the presumption that overall volume of collective provision is below-optimal,31 subsidies to private giving that are fully salient to individuals’ choices would not generate allocative distortions but rather they would be a second-best instrument for offsetting pre-existing allocative distortions. Even in the case where donors fail to respond to subsidy changes, we cannot conclude that lack of full optimization on the part of individuals must translate into lower individual welfare – in a non-cooperative contribution game, less-than-full optimization on the part of individuals can raise their ex-ante welfare if it supports a collectively more efficient outcome. Thus (abstracting from distributional effects), there is a presumption in this case that any policy change that raises the subsidy-inclusive volume of donations would be efficiency improving.
Figure 2: Estimated change in gross donations and cost of tax relief associated with match-only options
Note to figure: The central, bold line indicates the percentage changes in gross donations and the cost of tax relief compared to the current system based on an assumption that 35% of higher-rate taxpayers reclaim the rebate. The paler lines show the same, assuming that 25% and 45% reclaim.
References
Andreoni, J., 2006. “Philanthropy.” In the Handbook of Giving, Reciprocity and
Altruism, S-C. Kolm and J. Mercier Ythier, eds., Amsterdam: North Holland:
1201–1269.
Andreoni, J. and A. Payne, 2001. “Do Government Grants to Private Charities Crowd out Giving or Fundraising?” American Economic Review 93: 792–812.
Auten, G., H. Sieg, and C. Clotfelter, 2002. “Charitable Giving, Income, and Taxes: an Analysis of Panel Data.” American Economic Review 92: 371–382.
Bakija, J. and B. Heim, 2008. “How does Charitable Giving Respond to Incentives and Income? Dynamic Panel Estimates Accounting for Predictable Changes in Taxation.” NBER Working Paper #W14237.
Bénabou, R., and J. Tirole, 2006. “Incentives and Pro-Social Behavior,” American
Economic Review 96, 1652-1678.
Chetty, R., A. Looney, and K. Kroft, 2009. “Salience and Taxation: Theory and Evidence.” American Economic Review 99: 1145–1177.
Clotfelter, C., 1985. Federal Tax Policy and Charitable Giving, University of Chicago Press: Chicago.
Cummings, R. and Taylor, L. 1999. “Unbiased Value Estimates for Environmental Goods: a Cheap Talk Design for the Contingent Valuation Method.” American
Economic Review 89: 649–665.
Diamond, P. and Hausman, J. (1994) “Contingent Valuation: Is some number better than no number?” Journal of Economic Perspectives, 8(4): 45 – 64
Eckel, C. and P. Grossman, 2003. “Rebate Versus Matching – Does how We Subsidize Charitable Contributions Matter?” Journal of Public Economic 87: 681–701.
Eckel, C. and P. Grossman, 2008. “Subsidizing Charitable Contributions: a Natural Field Experiment Comparing Matching and Rebate Subsidies.” Experimental
Economics 11: 234–252.
Feldstein, M. and C. Clotfelter, 1976. “Tax Incentives and Charitable Contributions in the United States: A Microeconometric Analysis.” Journal of Public Economics
Finkelstein, A., 2009. “E-Z Tax: Tax Salience and Tax Rates.” Quarterly Journal of
Economics 124: 969–1010.
Harrison, G., and E. Rutsröm, 2006. “Hypothetical Bias Over Uncertain Outcomes,'' in List, J. (ed.) Using Experimental Methods in Environmental and Resource Economics, Elgar: Northampton, MA.
Huck, S., and I. Rasul, 2009. “Comparing Charitable Fundraising Schemes: Evidence from a Natural Field Experiment.” Mimeo, University College London.
Kahneman, D. and A. Tversky, 1979. “Prospect Theory: an Analysis of Decision Under Risk.” Econometrica 57: 263–291.
Karlan, D., and J. List, 2007. “Does Price Matter in Charitable Giving? Evidence From a Large-Scale Natural Field Experiment.” American Economic Review 97: 1774– 1793.
Randolph, W., 1995. “Dynamic Income, Progressive Taxes, and the Timing of Charitable Contributions.” Journal of Political Economy 103: 709–38.
Roberts, R., 1987. “Financing Public Goods.” Journal of Political Economy 95: 420– 437.
Scharf, K., 2000. “Why are Tax Expenditures for Giving Embodied in Fiscal Constitutions?” Journal of Public Economics 75: 365–387.
Steinberg, R., 1990. “Taxes and Giving: New Findings,” Voluntas 1: 61–79.
Triest, R., 1998. “Econometric Issues in Estimating the Behavioural Response to Taxation: a Nontechnical Introduction.” National Tax Journal 51: 761–72.
Warr, P., 1982. “Pareto Optimal Redistribution and Private Charity.” Journal of Public
Appendix 1
Summary Statistics Basic-rate taxpayers Higher-rate taxpayers: Non-reclaimers Higher-rate taxpayers: ReclaimersTotal donations – last 12 months £990 £1037 £5121
Donations through Gift Aid – last 12 months £840 £514 £3842
Female 0.54 0.38 0.20
Aged < 35 0.25 0.28 0.07
Aged 35-44 0.16 0.31 0.17
Aged 45-54 0.18 0.26 0.34
Aged 55-64 0.25 0.12 0.24
Aged 65-74 0.11 0.02 0.12
Aged 75+ 0.06 0.00 0.06
Individual income < £30K 0.59 0.00 0.00
Individual income £30K - £40K 0.27 0.00 0.00
Individual income £40K - £75K 0.06 0.62 0.42
Individual income £75K - £100K 0.00 0.13 0.14
Individual income £100K - £200K 0.00 0.13 0.23
Individual income > £200K 0.00 0.04 0.09
Employed full-time 0.49 0.87 0.60
Employed part-time 0.11 0.02 0.05
Self-employed 0.09 0.07 0.13
Retired 0.25 0.03 0.19
Other non-working 0.06 0.01 0.02
Highest qualification – degree 0.43 0.45 0.40
Highest qualification – higher degree 0.23 0.35 0.42
Married 0.55 0.60 0.80
Cohabiting 0.13 0.15 0.05
Single 0.21 0.18 0.09
Widowed 0.04 0.02 0.02
Divorced 0.04 0.04 0.03
Separated 0.01 0.01 0.01
Ever had children 0.56 0.54 0.77
Understands tax incentives 0.55 0.46 0.64
Regular giver 0.56 0.40 0.35
Ever worked as a volunteer 0.69 0.62 0.66
Ever worked for a charity 0.19 0.10 0.10
Type of charity supported
Medical 0.62 0.64 0.60
Education 0.12 0.11 0.24
Religious 0.33 0.17 0.46
Community 0.11 0.10 0.14
Arts 0.17 0.14 0.30
Sports 0.04 0.07 0.05
Hospices 0.50 0.48 0.48
Rights 0.19 0.15 0.19
Environment 0.21 0.17 0.26
Housing 0.05 0.05 0.09
Overseas aid 0.52 0.43 0.65
Welfare 0.54 0.52 0.58
Animals 0.22 0.18 0.17
Homeless 0.28 0.25 0.37
Disaster 0.45 0.39 0.53
Rescue 0.18 0.14 0.17
Sampling
Our sample would ideally be representative of the population of Gift Aid donors but this is unlikely because of both sampling and response bias. In practice, there is no population
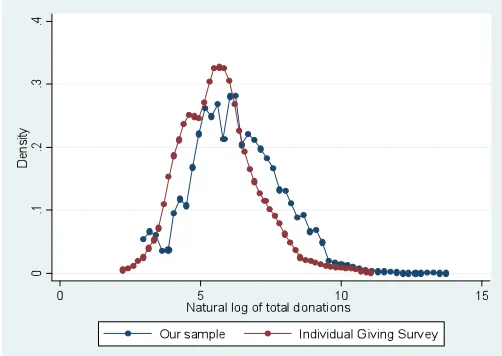
[image:30.595.166.417.290.468.2]information on Gift Aid donors to allow us to investigate the extent of bias. The best benchmark is the Individual Giving Survey (IGS), a population-based survey that collects information on giving, including the use of Gift Aid. However, as shown in the figure below, the IGS is also likely to suffer from bias particularly in not capturing higher-value donors – the largest donation was £46,000 in the last year in the IGS, compared to more than 100 donors who gave more than £100,000 in the CAF/Justgiving sample.
Figure A1: Distribution of total donations over the last 12 months
To analyse the effect of possible policy options, we re-weight the taxpayer groups in the CAF/Justgiving sample to reflect estimated population shares, assuming that 80 per cent of Gift Aid donors are basic rate taxpayers and assuming that 35 per cent of higher-rate taxpayers reclaim (based on HMRC statistics). This re-weighting reduces the mean annual donation in the sample from £2,272 to £1,345. This is still larger than the mean annual donation in the IGS sample as shown in the table below. But at least some of this is explained by the larger tail in the CAF/Justgiving sample. Excluding donations of £50,000 or more (of which there are none in the IGS sample), the mean annual donation in the CAF/Justgiving sample falls to £1,137.
Mean annual donation
CAF/ Justgiving IGS
Unweighted £2,273 £854
Weighted £1,345 £854
Appendix 2
Appendix 3
P-values: test for significant differences across scenarios – H0: βs = βz , s ≠ z
Higher-rate taxpayers
Dependent variable = ln (gross donations)
M25R30 M20R25 M25R20 M50R0 M30R0 M30R0 M37R0 M66R0 M50R0
M30R25 .000 .000 .000 .000 .000 .000 .000 .000 .000
M25R30 .000 .000 .000 .000 .020 .449 .000 .000
M20R25 .000 .000 .000 .000 .000 .000 .000
M25R20 .000 .000 .096 .001 .000 .000
M50R0 .000 .000 .000 .000 .842
M30R0 .124 .000 .000 .000
M30R0 .000 .000 .000
M37R0 .000 .000
M66R0 .000
Dependent variable = ln (nominal donations)
M25R30 M20R25 M25R20 M50R0 M30R0 M30R0 M37R0 M66R0 M50R0
M30R25 .000 .219 .273 .026 .000 .000 .007 .024 .017
M25R30 .000 .000 .000 .000 .000 .000 .000 .000
M20R25 .850 .317 .000 .008 .139 .297 .234
M25R20 .257 .000 .005 .107 .240 .187
M50R0 .000 .102 .632 .958 .842
M30R0 .124 .007 .002 .003
M30R0 .103 .118 .156
M37R0 .674 .783
M66R0 .838
Basic-rate taxpayers
Dependent variable = ln (gross donations)
M37R0 M37R0 M30R0
M30R0 .000 .000 .812
M37R0 .115 .000
M37R0 .000
Dependent variable = ln (nominal donations)
M37R0 M37R0 M30R0
M30R0 .000 .000 .812
M37R0 .115 .009
M37R0 .000