http://wrap.warwick.ac.uk
Original citation:Cooper, D. E., Gibbons, Gregory John, Stanford, M. and Kibble, K. A. (2009) E-Manufacturing for product improvement at Red Bull technology. In: 7th International Conference on Manufacturing Research (ICMR' 09), University of Warwick, UK, 8-10 Sep 2009
Permanent WRAP url:
http://wrap.warwick.ac.uk/72630
Copyright and reuse:
The Warwick Research Archive Portal (WRAP) makes this work by researchers of the University of Warwick available open access under the following conditions. Copyright © and all moral rights to the version of the paper presented here belong to the individual author(s) and/or other copyright owners. To the extent reasonable and practicable the material made available in WRAP has been checked for eligibility before being made available.
Copies of full items can be used for personal research or study, educational, or not-for profit purposes without prior permission or charge. Provided that the authors, title and full bibliographic details are credited, a hyperlink and/or URL is given for the original metadata page and the content is not changed in any way.
A note on versions:
The 7th International Conference on Manufacturing Research (ICMR09) University of Warwick, UK, September 8-10, 2009
Abstract— In Formula 1 racing, there is a strong motive for reducing component weight and thereby improving efficiency. This paper demonstrates the advantages e-Manufacturing brings to the production of hydraulic components. The DMLS production technique would enable weight reductions to be attained by its geometric design freedom coupled with this material’s attributes. The use of EOS Titanium Ti64 material for hydraulic components has been assessed by a hydraulic soak test at 25 MPa and no significant losses or failure occurred. The benefits to the efficiency of hydraulic flow have been measured using Particle Image Velocimetry (PIV) and the use of DMLS designed geometry has improved flow characteristics by 250% over that of the currently used techniques of manufacturing channels and bores.
I. INTRODUCTION
HE process of DMLS e-Manufacturing is one of a number of Additive Layer Manufacturing (ALM) processes in which 3D components or parts are constructed by the layer-additive addition of material directly from CAD data. ALM removes the shackles of reliance on mould tools, and offers the potential for virtually unlimited complexity and design freedom, allowing the manufacture of complex internal structure and freeform geometry. In DMLS (EOS GmbH), a high power laser is used to melt a powder feed-stock to form fully dense metallic parts.
The use of DMLS gives design and manufacturing freedom without the restrictions of traditional machining processes, bringing with it the benefit of lighter components, and, for hydraulic components, an ability to enhance internal flow paths, thus greatly improving the flow characteristics and ultimately resulting in less energy demanded of the engine by the hydraulic systems. The additive layer process of DMLS e-Manufacturing in this respect could be advantageous to many component designs throughout the Formula 1 racing environment. Although current F1 race teams are capable of producing a car with a mass less than 605 kg (the FIA minimum [1]), the advantageous weight reduction which is to be gained utilising DMLS would then
Manuscript received April 28, 2009. This work was supported in part by Red Bull Technology, EOS UK Ltd, and the School of Engineering, University of Warwick).
David. E. Cooper is with the School of Engineering, University of Warwick, Coventry, West Midlands CV4 7AL UK (e-mail: d.e.cooper@ warwick.ac.uk).
Gregory. J. Gibbons is with the WMG, School of Engineering, University of Warwick, Coventry, West Midlands CV4 7AL UK (phone: 24 7652 2524; fax: 24 7657 5365; e-mail: g.j.gibbons@warwick.ac.uk).
Mark. Stanford, is with the School of Engineering and the Built Environment, University of Wolverhampton, Telford, Shropshire TF2 9NT UK (e-mail: m.stanford@wlv.ac.uk).
Kevin. A. Kibble is with the School of Engineering and the Built Environment, University of Wolverhampton, Telford, Shropshire TF2 9NT UK (e-mail: k.a.kibble@wlv.ac.uk).
allow the designers to apportion the mass gained in other areas or components of the car, to help improve reliability of other components. Currently, most hydraulic components are designed for and manufactured mainly from aluminium billet by 5-axis CNC machining and other processes, typically including drilling and spark erosion.
DMLS technology has moved the concept of Rapid Prototyping [2] into the realm of real time manufacturing of metal components which have been proven for use within some of the most demanding environments and applications to be found [3]-[5]. One attractive aspect of DMLS is that design and production costs do not rise exponentially with the potential complexity of the design [6].
Engineers have been hesitant in embracing DMLS technology having reservations about the material’s mechanical integrity, density and the repeatability of the DMLS process. These aspects will be reviewed and discussed in this paper.
Red Bull Technology identified a desire to explore the application of the DMLS process in the design and manufacture of their hydraulic manifolds. The initial research focused on the metallurgical and mechanical aspects of the material, and then to investigate whether the DMLS process could be realistically relied upon to deliver both significantly lighter, and hydraulically more efficient manifolds than those currently produced by traditional methods, without compromising their reliability and safety.
II. EXPERIMENTAL METHOD
A. Design and Manufacture
In order to evaluate the use of DMLS for the manufacture of hydraulic components, samples suitable for pressure testing were required. Several test pipes were designed with wall thicknesses ranging from 0.5mm up to 2mm, with different cross-sections (circular, elliptical and hexagonal).
The test pieces (Figure 1) were produced using the EOSINT M270 Machine and were manufactured from EOS Titanium Ti64 powder, by the University of Wolverhampton, using the latest standard build parameters. The parts were orientated as horizontal tubes and were stress relieved at 790oC for 90 minutes and allowed to cool
naturally in the furnace before being removed from the Titanium base plate by Wire Electrical Discharge Machining (Wire EDM). The remaining fettling of support structures was performed by CNC milling. In order to pressure test the samples, a thread and a smooth surface finish suitable for a Dowty seal at a pressure of 25MPa, was applied to the boss at each end using a CNC Lathe. The machinability of the
E-Manufacturing for Product Improvement at Red Bull Technology
David E. Cooper, Gregory J. Gibbons, Mark Stanford, and Kevin A. Kibble
m r F th r lo c w tw c w p p r p F v E o m r b lo M p material was replacement too
Fig. 1. DMLS part
B. Pressure
Pressure tests he material co race car’s hydr osses in press constructed, wh which served b
[image:3.612.53.297.408.594.2]wo thermocoup catastrophic fa was an electr pressurised by pump. The syst regards to com pressure leaks.
Fig. 2. Pressure t valve.
Each test piece oven temperat maximum oper rate of 10oC/mi
by 2.5 MPa, he ogged through MPa this bein pressure. Once
found to be oling employed
ts both pre (a) and
Testing
s were underta ould withstand raulic systems sure due to po hich comprised both as an oven uples) and also
ailure. Incorpo onic pressure y a double ac
tem design wa mponents and c
est rig, twin walle
e was connecte ture was rais rating tempera in. The pressur eld at each leve h the pressure ng 3 MPa ab e proven at 25
good, with d.
post (b) machined
aken to establis d the operating without mech orosity. A test d a twin walle n (monitored a as a safety cha orated in the h
sensor and cting hand op as deliberately m
connections to
ed safety enclosur
ed to the hydra sed to 140oC
ature of the hy re was then inc el for a period sensor to a fin bove the appli 5 MPa, the pr
standard carb
d.
sh whether or g pressure of hanical failure rig (Fig. 2) w ed steel enclos
and controlled amber in case o hydraulic syst
the system w perated hydrau
minimalistic w o reduce poten
re, pressure senso
aulic rig, and this being ydraulic fluid a crementally rai
of 2 minutes, a nal pressure of ication operat ressure was th
bide not the e or was ure by of a tem was ulic with ntial or & the the at a sed and f 25 ting hen reduced for an pressure given an C. F A Flo Image V primaril demons provide The c test pie 5000, 3 B.V). O emulate DMLS. A pum matched [7] so a removin thus en liquid i Ltd) (n= The p a high-frame-b individu vector with m provide more ac D. Su In ord produce contact measure in Vert 611.4 x E. D To as dimensi sample Measur (Faro T parallel (±0.1mm the sam F. M Samp batch microha OmniM hardnes
d to 24 MPa ( extended “so e losses. The n extended test
Flow Visualisat
ow Visualisatio Velocimetry. T ly to assess t strate the geom e in producing i comparative as eces, manufac D Systems Co One of the test ed an historic e
mped closed s d the refractiv as to render th ng refractive nabling the cam
dentified as a = 1.511). passage of glas
-speed camera by-frame using ual particles in for its movem multiple passe ed a best guess ccurate correlat
urface Roughn
der to assess ed using the E interferometer e the surface a tical Scanning x 465.3 microm
Dimensional Ac
sess any chang ional accuracy after build rement was m Titanium arm
and perpendic m), allowing a mples to be asse
Microhardness T
les cut from re were hot-mo ardness measu Met MHT (Bu
ss number. The
10% above op oak” test of thinnest, 0.5m t of an addition
ion
on study was This experimen
the benefits to metric freedom
internal compl ssessments we ctured using orp) in XC1112 t pieces formed example, the se
system was fi ve index of the
e flow passage effects and im mera to image
match was a
s particles in t a. The image g the DaVis so
n one frame w ment. Using a es, and decre s window shift
tion on the fina
ness Measurem
the surface ro EOSINT M270
r (Veeco Instru at multiple poin g mode, with meters.
curacy Measur
ges in their ge y measureme ding and a made using a p
Faro UK Ltd). cular to the sa axial bending essed. Testing epresentative sa ounted and urement was uehler GmbH) ese measureme perating criteri 20 minutes t mm, samples nal 30 minutes
conducted usin nt had a twofol
o the flow, b layer manufac ex flow passag ere made by u stereolithograp 22 resin (DSM d with the SLA econd being de
illed with a fl e SLA materia e boundaries tr mproving ima e the glass par Silicone Oil (I
he fluid was re es were then oftware suite, with the next t an interrogatio easing size e t from pass to al pass. [8]
ment
oughness of co , a Wyko NT uments Inc) w nts. The system
a measureme
rement
eometry and al nt was made after pressure portable meas . The alignmen ample’s axis w and torsional
ample of each polished to made using ) to obtain th ents were used
ia) and left to observe
were also at 24 MPa
ng Particle ld purpose, but also to
cturing can ges. using clear phy (SLA M Desotech A material esigned for luid which al n=1.512 ranslucent, age clarity, rticles. The IMCD UK ecorded by processed correlating to obtain a on window each pass,
pass and a
omponents 9300 non-was used to
m was used nt area of
lignment, a e of each e testing. suring arm nt of planes
ere probed rotation of
The 7th International Conference on Manufacturing Research (ICMR09) University of Warwick, UK, September 8-10, 2009
the consistency of production and also as baseline data for further research on the effects of finishing processes.
G. Porosity Measurement
Samples were hot mounted and polished to 3μm, hydrofluoric acid etched. Optical microscopic images taken (Olympus Lext confocal microscope). Porosity levels were measured using image analysis software (a4i, aquinto AG, Germany).
III. RESULTS AND DISCUSSION
A. Pressure Testing
All of the samples (wall thicknesses 0.5 mm – 2 mm) survived without failure during the test sequence, despite the high pressures applied to them. For each sample, a consistent pressure drop (~3%) was observed during the first 5-6 minutes during pressure application. In the proceeding 20 minute test (at 24 MPa), the pressure remained constant. The initial loss was attributed as inherent in the system, as it was observed across all samples. No statistically significant pressure loss was observed for the 30 minutes extended pressure test for the 0.5 mm wall thickness samples.
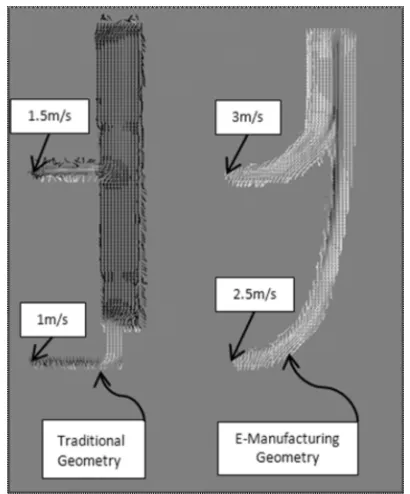
B. Flow Visualisation
Fig. 3 and Fig. 4 show the average vector field across 500 frames for two cases of traditional and e-manufactured geometries. As expected, there are areas of recirculation in the traditional geometry with abrupt changes in direction reducing the flow velocity. This condition is associated with overlapping hole intersections “dead-ends” in the traditional design, an inevitability of the manufacturing, where fluid flow bores are created by drilling straight line holes, and then capping the holes with Lee plugs. This limits the
Fig. 3. Vector fields for traditional and e-Manufactured geometry 1.
[image:4.612.327.547.85.290.2]manufacture of the flow channels to straight lines only, with severe angles between the bores at intersections.
Fig. 4. Vector fields for traditional and e-Manufactured geometry 2.
The measurements of the maximum fluid velocity at the exit and at a centre point of the flow path for the traditional and e-manufactured geometries are given in Table. 1.
Table. 1. Fluid flow measurements for traditional and e-manufactured geometries at centre and end points of the flow path.
Sample Traditional (m/s)
e-Manufactured
(m/s) [
[image:4.612.313.559.396.482.2]Δ%]
Fig 3, exit1 1.5 3.0 100
[image:4.612.59.264.463.710.2]Fig 3, exit2 1.0 2.5 150
Fig 4, centre 2.5 4.0 67
Fig 4, exit 1.0 2.5 150
The increase in fluid flow velocity is significant (up to 150% for end point and 67% for the centre point). This faster flow can be attributed directly to the kinetic energy contained within the fluid. Reduced energy losses during transport will allow more energy to be available at its destination, resulting in a lower energy input from the engine to achieve the same operating effect.
The actual increases in flow rate that might be achieved in a DMLS manufactured component may not entirely compare directly with these PIV results due to differences in the channel surface texture between DMLS and SLA materials.
C. Surface Roughness Results
Table. 2 gives surface roughness measured at different positions around the test piece, showing significant finish variations dependent upon the location of the face relative to the build orientation. These were consistent over all the test pieces. The upper surface shows the best quality of finish, whereas the Ra of angled faces was compromised by the
the downward facing surface found to be rougher than the upper facing surface. The roughest surfaces were those where supporting structures were required for the DMLS build process (in this case to support the tubular section). There may exist therefore a need for post-process finishing to some areas.
Table. 2. Surface roughness measurements for the DMLS samples.
Position Ra (μm)
Top surface 3.96±0.05
Upper facing sloping surface 8.95±0.05 Lower facing sloping surface 17.50±0.05 Supported surface 27.93±0.05
Good surface finishes are particularly important to hydraulic applications, with union surfaces typically requiring machining to 0.4 μm. Also, smooth surface finishes on internal bores serve to aid in improving flow efficiency, and thus post-processing to improve the finish of internals may be necessary. However, if design and build orientation are carefully considered, the extent of the post-processing required may be reduced.
D. Dimensional Accuracy Measurement
[image:5.612.314.560.218.404.2]Table. 3 gives the torsional and axial alignments of the samples, measured before and after pressure testing.
Table. 3. Torsional and axial alignments for the DMLS samples.
Sample Torsional
Alignment (o±0.5) Alignment (Axial o±0.5)
Pre Post [Δ] Pre Post [Δ]
0.5Tube 1.14 1.31 0.17 0.82 1.07 0.25 0.65Tube 0.69 0.94 0.25 0.7 0.68 0.02 0.85Tube 0.98 0.77 0.21 0.52 1.35 0.83 1.00 Tube 0.34 1.07 0.73 0.39 0.44 0.05 1.25Tube 0.34 0.58 0.24 0.12 1.56 1.44 1.50Tube 0.23 0.75 0.52 0.05 0.33 0.28 1.75Tube 0.49 0.37 0.12 0.13 0.28 0.15 2.00Tube 0.24 0.79 0.55 0.21 0.12 0.09 0.5Ellipse 1.64 2.33 0.69 1.19 0.81 0.38 0.5Hexagonal 0.98 2.38 1.40 0.12 0.53 0.41
Dimensional measurements prior to pressure testing show a slight distortion in the samples. The highest deviations are seen in the thinnest wall section components, most likely from stresses created during the build process due to the large differences in cross-sectional area. Measurement after pressure and temperature testing showed a small increase in torsional and axial, attributable to the torque and forces applied when fitting samples to the test rig rather than to any pressure effects.
E. Microhardness
A Vickers hardness of ~350HV was established for pre-heat treated parts, with an increase to ~500HV after pre-heat treatment, remaining consistent across all three production batches. These baseline measurements were conducted to facilitate further research into surface finishing techniques, such as anodising and electro-polishing, to quantify any effect on hardness.
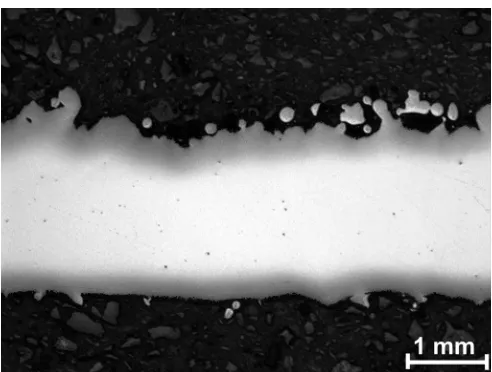
F. Porosity
[image:5.612.54.299.404.581.2]A representative cross-sectional image of one of the e-manufactured components is given in Fig. 5. The areal density of porosity was measured to be 0.28±0.05 %.
Fig. 5. Optical micrograph of a sample of EOS Titanium 64.
ACKNOWLEDGMENT
The authors would like to express their thanks to all those at Red Bull Technology (for whom the project which led to this paper was undertaken) for their invaluable assistance and insight, and our gratitude for the significant support provided by the EOS group. Also our thanks to Index Instruments for the provision of their REF 804 hand held Refractometer and to IMCD for supply of Silicone Oil used. Thanks also to Joe Nawasra at the University of Warwick Optical Engineering Laboratory for the use of their facilities and advice.
REFERENCES
[1] 2009 Formula One Technical Regulations : Federation Internationale de l'Automobile, 2008. Available: http://argent.fia.com/web/fia- public.nsf/7C4F8D883039AF6AC125757D00369C58/$FILE/1- 2009_F1_TECHNICAL_REGULATIONS_Showing-Alterations_17-03-2009.pdf
[2] C. C. Kai, L. K. Fai. Rapid Prototyping, Principles and Applications in Manufacturing. John Wiley & Sons (Asia) Pte Ltd, 1997. [3] P. Rochus, J. Y. Plesseria, M. Van Elsen, J. P. Kruth, R. Carrus, T.
Dormal. “New applications of rapid prototyping and rapid
manufacturing (RP/RM) technologies for space instrumentation,” Acta Astronautica, vol. 61, no. 1-6, pp. 352-359, June. 2007.
[4] J. Hanninen. “DMLS moves from rapid tooling to rapid
The 7th International Conference on Manufacturing Research (ICMR09) University of Warwick, UK, September 8-10, 2009
[5] E.C.Santos, M.Shiomi, K.Osakada, T.Laoui. “Rapid manufacture of metal components by laser forming,” International Journal of Machine Tools and Manufacture, vol. 46, no. 12-13, pp. 1459-1468, Oct 2006.
[6] N. Hopkinson, R. J. M. Hague, P. M. Dickens. Rapid Manufacturing, an Industrial Revolution for the Digital Age. John Wiley & Sons, 2006.
[7] DSM Desotech . Watershed XC 11122 Datasheet, 2009. Available: http://www.dsm.com/en_US/downloads/11122_Data_Sheet2.pdf. [8] LaVision Gmbh. DaVis FlowMaster Software Manual for DaVis 7.0,