Dropping out of medical school in the UK:
Explaining changes over 10 years
Wiji Arulampalam, Robin A. Naylor, and Jeremy P. Smith
University of Warwick
Revised 6th November 2006
BACKGROUND
In the context of changing admissions criteria and an expanding medical school intake in the UK, we analyse the determinants of the medical school dropout probability.
AIMS
To analyse the determinants of the probability that a student will drop out of medical school during their first year. To compare the results of this analysis over time.
METHOD
Logistic regression analysis for the six intake cohorts of 1990-92 and 1998-2000.
RESULTS
Between 1990-92 and 1998-2000, there was a substantial increase both in the size of the entry cohort and in the proportion of students dropping out of medical school. A logit model for the 1990-92 and the 1998-2000 cohorts reveals that the probability of dropping out depends on both the medical school attended and the personal characteristics of the students, including academic preparedness. Almost none of the increase in the dropout rate between the two cohorts can be explained by changes in observable characteristics of the students over this period. Instead, most of the increase in the dropout rate is associated with changes at the level of the institution and in unobserved student characteristics.
CONCLUSIONS
medical school and a growing mismatch between student and school characteristics. Testing between these competing hypotheses is left for future work.
OVERVIEW
What is already known on this subject
Recent years have seen increases in the number of students entering UK medical schools and in the proportion dropping out.
What this study adds
For the 1990-92 and 1998-2000 cohorts we find the probability of dropping out of medical school is lower for students (i) with better prior qualifications, (ii) with a parent who is a doctor, (iii) living on campus.
Suggestions for further research
1. INTRODUCTION
In earlier work published in this Journal we investigated the factors affecting the probability of dropping out in the first year of medical school for the full populations of UK medical students over the period 1980 to 1992.1 However, since 1992 many changes have taken place which are likely to have impacted on dropout probabilities, raising the issue of the extent to which results for earlier cohorts are informative for more recent cohorts. For recent cohorts of students the subject background at A-level is substantially more diverse compared to earlier. Similarly, there have been important curriculum and pedagogical changes Given all these changes, an analysis of the factors associated with the probability that a student will drop out of medical school is timely and important and updates earlier research.1,3,4 This paper analyses the data for both the 1990-1992 and the 1998-2000 cohorts. A particular interest is in the question of how the probability of dropping out – and the influence of its main drivers – changed across the two periods.
particular, we also observe whether the student lives on or off the university campus as this is likely to be associated with the success of student integration.
We focus exclusively on the probability that a medical student will drop out of their degree course by the end of their first year of study. A student is defined to have dropped out if they are not observed to be a registered student on their medical degree after their first year of study. Students failing and repeating their first year are not defined as having dropped out. We concentrate our analysis on the first-year dropout probability because as shown in previous work,8 the determinants of the dropout probability are significantly different for first year students compared to those for subsequent year students.
The rest of this paper is organised as follows. Section 2 describes the data and presents summary statistics. Section 3 presents results of the binomial logit regression analysis of the first-year medical student drop-out probability. Section 4 concludes with a summary of the results and further remarks.
2. THE DATA AND SUMMARY STATISTICS
We analyse administrative data on all students beginning a medical degree in the UK for entry cohorts of students: 1990-1992 cohorts and 1998-2000 cohorts. We pool together three years of data for each of the two cohort groups in order to have sufficiently large cell sizes for the analysis: this follows from the fact that there is a relatively low dropout rate in each year. The data for the period 1990-1992 come from the Universities’ Statistical Record (USR). Data for the period 1998-2000 come from the Higher Education Statistical Agency (HESA). Data for the period 1993 to 1997 are not of sufficient quality to be included in the analysis.
Summary statistics
characteristics, the second column reports the corresponding proportion for the sub-samples of students who dropped out.
Across the two cohort groups the number of students grew from an annual average of 4,125 (based on 6107 male and 6204 female students) in the 1990-1992 cohort group to 4,876 in the cohort group for 1998-2000. The data do not include those students who entered medical schools on postgraduate entry schemes.
The average first year dropout rate was 3.5% for the earlier cohort group and 4.9% for the later cohort group. For the 1990-1992 cohort group, there is a lower proportion of males among the dropout group than in the total population of medical students, however this is reversed for the 1998-2000 cohort group. The age structure of medical students has also been changing with a shift towards older students in the later cohort group.
In order to make our results comparable to the already published set of results1, we have carried out our analysis including those students who were overseas (non-EU) students. From Table 1, we see that an increasing proportion of students over the two cohort groups were overseas students and these students appear to have a higher drop-out rate than EU students. Overseas student fees are substantially higher than EU fees; in fact, for the first cohort group, EU students’ tuition fees were zero. Tuition fees for EU students were introduced only in 1998 and hence applied only to the second cohort. From the table, we also see that a large proportion of students lived in on-campus accommodation and these students have a markedly lower drop-out rate than students living off-campus, consistent with the social integration argument. 8
Prior to entering university, most UK students study in schools which can broadly be described as either private sector (henceforth, ‘Independent’ schools) or state sector (Local Education Authority - LEA). The proportion from Independent schools is much higher than for most other university courses in the UK. Information provided on previous schooling for the 1998-2000 cohort group is very poor with more than 60% with missing values, and is therefore not incorporated in the analysis.
The pre-university secondary school qualifications which form part of the basis for offers of places at medical schools are, typically, ‘A-levels’ for English and Welsh school pupils, and ‘Highers’ for school pupils from Scotland. Passes at A-level are classified as A (=10 points) through to E (= 2 points). Passes in Highers are classified as A (=3 points) through to C (=1 point).
The proportion of students with A-levels has been increasing slightly among both male and female students. Table 1 reveals the extent to which the dropout rate varies by the students’ A-level (or Higher) subjects and grades. Those students who had already been awarded a degree prior to becoming medical students are less likely, on average, to drop out of medical school.
Of those who had A-level qualifications, almost all students had taken Chemistry. While there was a rise in the proportion of those with Biology, there was a marked fall in the proportion with Physics. Overall, students with Biology at A-level were less likely to drop out than others. Over the two periods the proportion with the top score of 30 points at A-level grew, which could indicate that the average academic quality of the intake improved despite expansion, but could also reflect grade inflation. These two trends are likely to be related as Physics tends to produce below average A-level points scores.
3. RESULTS FOR THE PROBABILITY OF DROPPING OUT
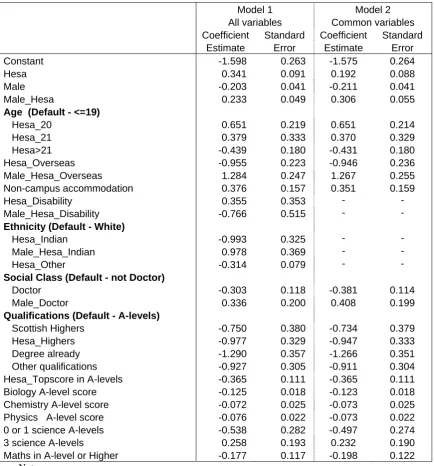
We conduct a binomial logit regression analysis of the probability that an individual withdraws from their medical degree during their first year of study. Initially we allow the coefficients on the variables to vary according to both the sex of the student and the cohort group to which the student belongs. This most general model is then reduced by excluding those variables which were insignificant at the 5% level. The final restricted model is reported in Table 3, which reports coefficient estimates (equivalent to the effect of the variable on the log odds ratio) and their standard errors for two specifications. The first specification (Model 1) uses all available variables. The second specification (Model 2), discussed below, uses only those variables which are common to both cohort groups. Although not reported in Table 3, the models also include binary indicator variables for the university the student attended.
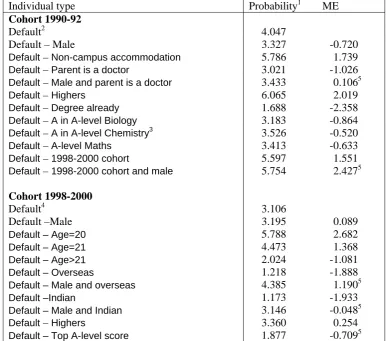
As can be seen from the table, the estimated coefficients are very robust across the two models. It is also noticeable that few of the coefficients change across the two cohort groups. In order to discuss and interpret the results in more detail, we calculate predicted probabilities and marginal effects associated with specific variable changes for individuals in each cohort group. Based on the results of Model 1 reported in Table 3, we report in Table 4 the predicted
probability (×100) of dropping out for two types of default individuals; one based on the 1990-92 cohort group and one based on the 1998-2000 cohort group. We then change a single characteristic of our ‘typical’ individual and recalculate the probability of dropping out. The difference in these two probabilities is referred to as the marginal effect associated with that changed characteristic.
Personal characteristics: From Table 4 we find that the predicted probability (×100) of dropping out for our default modal female student in the 1990-92 cohort group is 4.05%, an equivalent male student has a predicted probability of dropping out of 3.33%. Therefore the marginal effect of being male (compared to female) is approximately 0.72, implying that males are around 0.72 percentage points less likely to drop out than equivalent female students. Note that as the logit model is not linear and as the default individual has modal and not mean characteristics, there is no reason for the predicted probabilities to coincide with those reported in Table 1. For the 1998-2000 cohort group, the predicted probability of dropping out for our ‘typical’ (default) female is lower than that observed for the 1990-92 cohort group as our typical female has better A-level qualifications than were assumed for the earlier cohort group. For the 1998-2000 cohort group we note that there is little difference in the dropout rates for males compared to females, with males 0.09 percentage points more likely to drop-out.
There are no significant age effects for the 1990-92 cohort group, but there are for the 1998-2000 cohort group. We find that 20 and 21 year olds are more likely to dropout by around 1.4-2.7 percentage points compared to 18-19 year olds, whereas the more mature students (>21 years old) are around 1 percentage point less likely to drop out compared to the 18-19 year old students.
For the 1990-92 cohort group, there were no significant overseas student effects. However, for the 1998-2000 cohort group female (male) overseas students were around 1.9 (1.2) percentage points less (more) likely to dropout than our typical female (male). Multivariate analysis thus confirms the findings in the raw data (Table 1).
Social Class and ethnicity background: Ethnic background of the student is recorded only for the 1998-2000 cohort group. We find that Indian females are around 1.9 percentage points less likely to drop out compared to white females, whereas Indian males are no different from white males. Other ethnic groups are less likely to dropout by around 0.8 percentage points. On social class, we find that female students from a background in which a parent is a medical doctor have a significantly lower probability of dropping out, by around 1 percentage point; for males, there is no such effect.
Prior qualifications and school background: We find that students who had already obtained a degree prior to registering for a medical degree are significantly less likely to drop out, by around 2.4 percentage points, compared to a student with A-levels only. For the purposes of this comparison, we assume that the student with a degree had similar A-levels to those students getting into a medical school with only A-levels. This is a remarkably strong effect. It suggests that the creation of post-graduate medical schools could well have a beneficial effect on progression, ceteris paribus. The marginal effect on Highers shows that, compared to an A-level student, these students are around 2 percentage points more likely to drop-out in the 1990-92 cohort group, whereas in the 1998-2000 cohort group this effect is much smaller.
points, though this is only for the 1998-2000 period. Academic preparedness clearly exerts a substantial influence on the probability of dropping out.
Medical school effects: Tables 3 and 4 show results based on a specification in which binary indicator variables were included for each medical school. For reasons of confidentiality the identity of individual medical schools cannot be revealed. However, in Figure 1 we plot the medical school coefficient estimates (and their 95% confidence intervals), relative to a base medical school, for both males and females for the 1998-2000 cohort group. From the figure we can see that there are a number of significant university effects. There is also a relatively high correlation (of 0.76) between the coefficient estimates for males and females (for 1990-92 cohort group the dispersion is slightly greater and the correlation lower at 0.62). This is reflected
in the figure by the narrow dispersion of points around the 45° line. However, for 15 of the 19 estimated medical school effects the associated confidence intervals do not cross the 45° line – implying significant differences in the estimated medical school effects for males compared to females. Figure 2 plots the medical school coefficients and confidence intervals for the 1990-92 and 1998-2000 cohort groups, for males only. Again, there are a number of significant effects for both cohorts. These estimated medical school effects have a relatively high correlation (of 0.63) between the point estimates over time (although this is only 0.16 for females). Despite this, there are significant differences over time in the estimated medical school effects and it is noticeable that the effects have tended to shift upwards.
Changes over time: In order to address the question of the extent to which the rise in the
predicting what the probabilities of dropping out for students in the earlier cohort would have been using the estimated coefficients from the later cohort, and vice-versa.
For males (females), the average predicted probability of dropping out for the 1990-92 group is 3.3% (3.7%). When these students are attributed the estimated coefficients generated from the regression conducted on the 1998-2000 cohort group, the average predicted probability rises to around 5.5% (4.9%): a rise of 2.2 (1.2) percentage points. The actual dropout rate for the 1998-2000 cohorts is 5.3% (4.5%). Reversing the decomposition and using 1998-2000 cohort group, but taking the estimated coefficients generated from the regression conducted on the 1990-92 cohort group, the average predicted probability of dropping out is 3.5% (3.8%). In either case then, the evidence is that the increase in the dropout rate is not explained by changes in observed characteristics of students over time. Instead, the increase is associated with changes in unobserved characteristics. For example, we incorporate in our analysis a wealth of information on prior qualifications, such as A-level performance: accordingly, we can conclude that a rise in the dropout rate is not attributable to a simple fall in student quality as measured by A-level results. Of course, measures of prior performance might not reflect underlying potential, which is unobservable within the data. If A-levels have become more weakly correlated with ability (for example through grade inflation), then this would be a potential reason for a rise in the dropout rate associated with a change in an unobservable characteristic.
thoroughly. Among unobserved institutional characteristics, we would include tuition fees and curriculum design. It is interesting that although the institutional effects are not uniform across medical schools, the dropout probability has increased in the great majority of cases, suggesting that characteristics common to the sector generally – rather than institutionally-specific – lie behind the rising dropout rate.
4. CONCLUSIONS
We have presented the results of an analysis of the probability of dropping out of a UK medical school for all first year students entering a medical school in the period either 1990-92 or 1998-2000. We have noted that over the two periods there was a substantial increase both in the size of the entry cohort and in the proportion of students dropping out of medical school and that there were also changes in the average characteristics of students.
We have found that the probability of dropping out of medical school tends to be lower, inter alia, for (i) students living on campus, (ii) students with a parent who is a doctor, (iii) students with better prior qualifications.
CONTRIBUTORS
None.
ACKNOWLEDGEMNTS
We would like to thank Paranjothy Arulampalam, seminar participants at the University of Nottingham and Warwick, and Chris McManus and another referee for helpful comments. We acknowledge both the USR, as the original depositors, and the UK Data Archive for the use of the data-set SN:3456 Universities' Statistical Record and HESA and UCAS for the datasets relating to medical students for 1998-2001. None of these individuals or organisations bears any responsibility for any of the analysis or interpretations presented in this paper.
FUNDING
Financial support from the ESRC under Research Grant no. RES-000-22-0303, ‘Medical School: Applications, Admissions and progression’, is gratefully acknowledged.
ETHICAL APPROVAL
Ethical approval was not required for this study.
REFERENCES
1. Arulampalam, W., Naylor, R. A. and Smith, J. Factors affecting the probability of first-year medical student dropout in the UK: a logistic analysis for the intake cohorts of 1980-1992. Medical Education 2004; 38: 492-503.
2. Medical Workforce Standing Advisory Committee. Planning the medical workforce: third report. London: Department of Health (a downloadable version of this report is available at
http://www.doh.gov.uk/medical/mwsca3.htm); 1997.
3. Parkhouse J. Intake, output, and dropout in United Kingdom medical schools. BMJ 1996;312:885.
4. McManus IC. Dropout rate in medical school seems reasonable. (Letter to the Editor) BMJ 1996;313:173.
6. Tinto, V. Leaving college: rethinking the causes and cures of student attrition. Chicago: University of Chicago Press, 1987.
7. Tinto, V. Dropout from higher education: a theoretical synthesis of recent research. Review of Educational Research 1975;45: 89-125.
8. Arulampalam, W., Naylor, R. A. and Smith, J. A Hazard Model of the Probability of Medical School Dropout in the United Kingdom. Journal of the Royal Statistical Society, Series A 2004; 167: 157-178.
9. McManus IC, Richards P. Prospective survey of performance of medical students during pre-clinical years. BMJ 1986;293:124-7.
10.Richardson, PH, Winder, B, Briggs, K, Tydeman C. Grade predictions for school-leaving examinations: do they predict anything? Med Educ 1998;32:294-297.
11.Oaxaca, R. Male-female wage differentials in urban labour markets. International Economic Review 1973;14: 693-709.
Table 1: Summary statistics
1990-1992 entry cohort 1998-2000 entry cohorts
Males Females Males Females
Prop or Mean Prop or Mean for dropouts Prop or Mean Prop or Mean for dropouts Prop or Mean Prop or Mean for
dropouts Prop or Mean Prop or Mean for dropouts
Overall dropout 0.033 1.000 0.037 1.000 0.053 1.000 0.045 1.000
Age
18-19 0.870 0.873 0.911 0.890 0.812 0.745 0.815 0.765
‘20 0.037 0.044 0.025 0.031 0.043 0.119 0.029 0.067
‘21 0.013 0.024 0.009 0.004 0.021 0.036 0.021 0.040
>21 0.080 0.059 0.055 0.075 0.124 0.101 0.135 0.128
Overseas 0.071 0.068 0.057 0.075 0.077 0.139 0.068 0.037
Non-campus accommodation 0.147 0.146 0.139 0.229 0.218 0.282 0.207 0.259
Disability 0.027 0.018 0.022 0.029
Ethnicity
White 0.577 0.549 0.676 0.770
Indian 0.130 0.119 0.083 0.032
Other 0.171 0.142 0.142 0.099
Missing 0.122 0.190 0.099 0.099
Social Class
Doctor 0.200 0.200 0.146 0.109 0.251 0.256 0.187 0.133
Professional (excl. Doctor) 0.216 0.194 0.275 0.323 0.208 0.172 0.158 0.212
Intermediate 0.404 0.417 0.433 0.448 0.332 0.353 0.298 0.417
Skilled, semi-skilled, unskilled 0.156 0.177 0.127 0.115 0.159 0.149 0.113 0.200
Other 0.024 0.011 0.020 0.005 0.050 0.070 0.244 0.038
School Type
Local Education Authority 0.315 0.376 0.349 0.357
Grammar 0.135 0.122 0.136 0.110
Independent 0.406 0.380 0.369 0.352
FE College 0.069 0.054 0.088 0.075
Other 0.075 0.068 0.058 0.106
Qualifications
A-levels 0.819 0.795 0.816 0.771 0.839 0.828 0.826 0.818
Higher 0.081 0.137 0.089 0.075 0.076 0.074 0.085 0.083
Degree already 0.044 0.024 0.037 0.031 0.036 0.012 0.041 0.032
Other 0.056 0.044 0.058 0.123 0.049 0.086 0.048 0.067
Table 1 (cont’d): Summary statistics
1990-1992 entry cohort 1998-2000 entry cohorts
Males Females Males Females
Prop or Mean Prop or Mean for dropouts Prop or Mean Prop or Mean for dropouts Prop or Mean Prop or Mean for
dropouts Prop or Mean Prop or Mean for dropouts
Number with A-levels 5073 164 5076 175 5342 279 6811 306
Topscore in A-levels 0.343 0.293 0.278 0.217 0.371 0.215 0.389 0.327
Science score in A-levels 21.42 (5.10)
19.18 20.40 (5.04)
18.49 21.28 (5.69)
17.82 20.27 (5.44)
17.11
Other score in A-levels 11.34
(7.86) 12.95 11.68 (7.89) 12.73 7.27 (3.12) 6.129 7.62 (2.85) 7.07
Biology in A-levels 0.737 0.579 0.844 0.743 0.824 0.685 0.897 0.745
Chemistry in A-levels 0.992 0.976 0.988 0.977 0.977 0.842 0.974 0.869
Physics in A-levels 0.674 0.652 0.490 0.503 0.463 0.419 0.294 0.258
Maths in A-levels 0.642 0.750 0.661 0.651 0.685 0.556 0.633 0.559
Numbers with Highers 497 28 553 17 483 25 702 31
Topscore in Highers 0.376 0.321 0.382 0.529 0.128 0.160 0.214 0.258
Science score in Highers 7.77 (1.33)
7.75 (1.33)
7.39 7.18 7.52 (2.73)
7.32 (2.42)
7.52 7.55
Other score in Highers 9.25
(3.74)
8.89 (3.61)
10.68 10.94 3.59 (2.38)
3.06 (1.88)
3.58 3.23
Biology in Highers 0.899 0.929 0.897 0.824 0.888 0.920 0.923 0.935
Chemistry in Highers 1.000 1.000 0.998 1.000 0.896 0.920 0.926 0.935
Physics in Highers 0.978 1.000 0.948 1.000 0.853 0.920 0.801 0.871
Maths in Highers 0.964 0.964 0.989 1.000 0.886 0.920 0.923 0.935
Notes:
1.The summary statistics on A-levels (Highers) are conditional on the student having A-levels (Highers) and the respective sample sizes are reported.
[image:18.595.97.505.521.731.2]2.For both Science and Other A-level as well as Higher scores we report standard deviations in parentheses. 3.All variables are binary indicator variables, except those for which we report standard deviations.
Table 2: Tests of independence for the dropout probability
1990-1992 cohort 1998-2000 cohort Males Females Males Females
Age (4) 0.303 0.477 0.000 0.000
Non-UK fees (1) 0.864 0.248 0.000 0.016
Non-campus accommodation (1) 0.973 0.000 0.003 0.010
Disability (1) - - 0.305 0.296
Ethnicity (4) - - 0.001 0.000
Social Class (5) 0.744 0.209 0.105 0.019
School Type (5) 0.417 0.024 - -
Qualifications (4) 0.013 0.000 0.001 0.275
Topscore in A-levels (1) 0.508 0.068 0.000 0.022
Biology in A-levels (1) 0.000 0.000 0.000 0.000
Chemistry in A-levels (1) 0.020 0.169 0.000 0.000
Physics in A-levels (1) 0.549 0.724 0.129 0.160
Maths in A-levels (1) 0.003 0.795 0.000 0.006
Note:
Table 3: Logit result on the probability of dropping out in the first year
Model 1 Model 2
All variables Common variables
Coefficient Standard Coefficient Standard Estimate Error Estimate Error
Constant -1.598 0.263 -1.575 0.264
Hesa 0.341 0.091 0.192 0.088
Male -0.203 0.041 -0.211 0.041
Male_Hesa 0.233 0.049 0.306 0.055
Age (Default - <=19)
Hesa_20 0.651 0.219 0.651 0.214
Hesa_21 0.379 0.333 0.370 0.329
Hesa>21 -0.439 0.180 -0.431 0.180
Hesa_Overseas -0.955 0.223 -0.946 0.236
Male_Hesa_Overseas 1.284 0.247 1.267 0.255
Non-campus accommodation 0.376 0.157 0.351 0.159
Hesa_Disability 0.355 0.353 - -
Male_Hesa_Disability -0.766 0.515 - -
Ethnicity (Default - White)
Hesa_Indian -0.993 0.325 - -
Male_Hesa_Indian 0.978 0.369 - -
Hesa_Other -0.314 0.079 - -
Social Class (Default - not Doctor)
Doctor -0.303 0.118 -0.381 0.114
Male_Doctor 0.336 0.200 0.408 0.199
Qualifications (Default - A-levels)
Scottish Highers -0.750 0.380 -0.734 0.379
Hesa_Highers -0.977 0.329 -0.947 0.333
Degree already -1.290 0.357 -1.266 0.351
Other qualifications -0.927 0.305 -0.911 0.304
Hesa_Topscore in A-levels -0.365 0.111 -0.365 0.111
Biology A-level score -0.125 0.018 -0.123 0.018
Chemistry A-level score -0.072 0.025 -0.073 0.025
Physics A-level score -0.076 0.022 -0.073 0.022
0 or 1 science A-levels -0.538 0.282 -0.497 0.274
3 science A-levels 0.258 0.193 0.232 0.190
Maths in A-level or Higher -0.177 0.117 -0.198 0.122
Notes:
1.This is a restricted model derived from a model in which all coefficients were allowed to vary according to the cohort (1990-92 and 1998-2000) and sex. In total the fully interactive model had 200 coefficients and a log-likelihood of -4242.01 across 200 coefficients. The model above (with
university coefficients allowed to vary across sex and cohort, although not reported above) has 104 coefficients and a log-likelihood of -4301.69. Testing between the fully-interacted model and that above yields a chi-squared statistic of 119.36 (with p-value of 0.054).
2.Hesa_ = Interaction with a HESA dummy variable.
3.Male_ = Interaction with a Male dummy variable.
Table 4: Predicted Probability (×100) and marginal effects (×100) of dropping out for specific types of individuals
Individual type Probability1 ME
Cohort 1990-92
Default2 4.047
Default – Male 3.327 -0.720
Default – Non-campus accommodation 5.786 1.739
Default – Parent is a doctor 3.021 -1.026
Default – Male and parent is a doctor 3.433 0.1065
Default – Highers 6.065 2.019
Default – Degree already 1.688 -2.358
Default – A in A-level Biology 3.183 -0.864
Default – A in A-level Chemistry3 3.526 -0.520
Default – A-level Maths 3.413 -0.633
Default – 1998-2000 cohort 5.597 1.551
Default – 1998-2000 cohort and male 5.754 2.4275
Cohort 1998-2000
Default4 3.106
Default –Male 3.195 0.089
Default – Age=20 5.788 2.682
Default – Age=21 4.473 1.368
Default – Age>21 2.024 -1.081
Default – Overseas 1.218 -1.888
Default – Male and overseas 4.385 1.1905
Default –Indian 1.173 -1.933
Default – Male and Indian 3.146 -0.0485
Default – Highers 3.360 0.254
Default – Top A-level score 1.877 -0.7095
Notes:
1. The above predicted probabilities use an average weighted combination of the estimated
university effects in the calculations.
2. The default person is white female aged 18 or 19 years old, not disabled and is from a social
class background in which neither parent is a doctor. She has only taken A-levels and has a B in Biology and a B in Chemistry, but has no Physics or Mathematics A-level. She went to university in the 1990-92 cohort group and lived in on-campus accommodation in her first year.
3. The dropout probability of the equivalent student as above with a B in Physics rather than
Chemistry has almost exactly the same dropout probability.
4. The same default person is as above except she had an A in her Biology and Chemistry
A-levels and a B in A-level Physics. She went to university in the 1998-2000 cohort group.
5. In these cases the marginal effect calculates the difference in the probability of dropping out relative to the Default – male case.
Figure 1: Estimated medical school effects for males and females from the 1998-2000 cohort
-3 -2 -1 0 1 2 3
-3 -2 -1 0 1 2 3
Females
Ma
les
Note: The estimated medical school effects are the coefficient estimates from Model 1 (Table 3) and their corresponding 95% confidence intervals.
Figure 2: Estimated medical school effects for males from the 1990-1992 and 1998-2000 cohorts
-3 -2 -1 0 1 2 3
-3 -2 -1 0 1 2 3
1990-1992 cohort
1998
-2
0
00 co
ho
rt
[image:21.595.83.513.465.705.2]