Profiling of potential higher
education website visitors based
on online behaviours: A machine
learning approach
Parth Gupta Thesis Assignment
M.Sc. Business Administration – Strategic Marketing and Business
Information August 2018
Faculty of Behavioural, Management, and
Social Science
Supervisors:
Dr. E. Constantinides (Efthymios) Dr. S.A De Vries (Sjoerd)
2
Abstract
Purpose: Recently, educational institutes have taken an initiative to aggregate and store the voluminous amount of behavioural data of users interactions on their websites, but still many have difficulties to unveil the patterns in it. Therefore, the objective of this paper is to discover the behavioural profiles of website users in the domain of higher education.
Design: In this research, a framework is developed for profiling of customer behavioural attributes within the marketing context. It define the process regarding the use of unsupervised machine learning algorithms in multiple stages for a variety of datasets which differs in terms of volume, ability to handle dimensionality, type (categorical/numeric) and its availability in R language. In addition, this study presented a model, which specifies the effect of the nature of information on the quality of clustering and difficulty to interpret them.
Findings: Outcomes from the application of unsupervised machine learning algorithms using the proposed framework on the Indian website visitors of University of Twente interested in master studies reveals that proposed combination and sequence of these algorithms performed well. These algorithms created the meaningful behavioural profiles as well as captured the minute differences between them.
Research limitations/implications: This study laid a foundation for future research work related to higher education website users in the domain of supervised machine learning especially classification. In this research, the behavioural profiles were discovered along with the patterns pertaining to each profile. Therefore, a prediction model can be built for Indian website visitors of the University of Twente interested in master studies to classify the new visitor belongs to this group in one of the six discovered behavioural profiles. Further, the text mining approach is suggested to unravel the semantics from the vast amount of unstructured text. This research is limited by volume and veracity of the dataset used.
Practical implications: The patterns in behavioural profiles render information to the marketer, to ameliorate targeting of the advertising campaigns by selecting a relevant target audience and messages based upon the behaviour manifested by visitors on the website. In the field of higher education unravelling patterns in the behavioural profiles will create possibilities for institutes to positively influence the engagement of their prospective students/users to aid them in their decision-making. It will simultaneously help the university to achieve their desired goals, such as improving the application submission rate. Further, it empowers the SMEs (Small and medium-sized enterprises) to efficiently execute the behavioural targeting under tight budget constraints or limited resources.
Originality/value: In this study, complete linkage (hierarchical clustering) followed by K-modes (partitional clustering) algorithms are executed using the proposed framework for behavioural profiling. To the best of the researcher's knowledge, in the domain of higher education, none of the studies used complete linkage (hierarchical clustering) in combination with K-modes to unravel patterns in behavioural attributes of website visitors. This methodology-oriented approach renders direction to create meaningful clusters for a small-scale symmetric binary dataset with low dimensionality.
Keywords: behavioural profiling, machine learning, nominal dataset, behavioural targeting
3
Table of Content
Abstract ... 2
1. Introduction ... 6
2. Theoretical Framework ... 9
2.1. Description of Behaviour ... 9
2.2. Discovering Knowledge in Data ... 10
2.3. KD Modelling Techniques ... 11
2.3.1. Unsupervised Machine Learning ... 11
2.3.1.1. Literature Review of Unsupervised Machine Learning ... 12
2.3.1.2. Algorithm and similarity measures for Binary data ... 13
2.3.2. Supervised Machine Learning ... 15
2.4. User profiling Approaches ... 15
2.5. User profiling Methods and Nature of Information ... 16
2.6. Types of User-profiling and its Characteristics ... 17
2.8. Behavioural Attributes ... 19
2.9. Framework for User Profiling ... 19
2.10. Model for determining the quality and interpretability of User Profiling ... 22
2.11. A literature review of other techniques implemented in the domain of Behavioural Targeting for User-profiling ... 22
3. Methodology ... 24
3.1. Research Understanding Phase ... 24
3.2. Data Understanding Phase ... 24
3.3. Data Preparation Phase ... 25
3.4. Modelling Phase... 25
3.4.1 Behavioural Attributes ... 26
4. Results ... 28
4.2. Calculating the number of clusters ... 29
4.3. Evaluation Phase (Cluster Analysis) ... 30
4.4.1 Behavioural profiling of All Master visitors ... 30
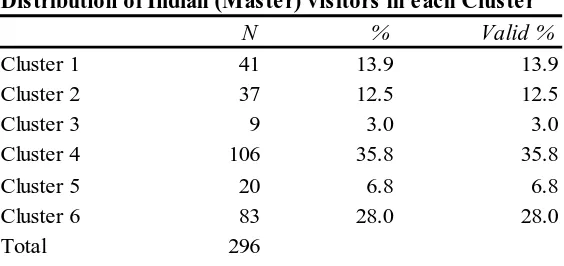
4.4.2. Behavioural profiling of Indian Master Visitors ... 35
4.5. Interpretation of Analyses ... 37
4.6. Clustering Validation ... 43
4.6.1. Silhouette analysis (Internal Criteria) ... 44
5. Discussion and Conclusions ... 45
5.1. Discussion ... 45
5.2. Conclusion ... 47
4
5.2.2. Practical Implication ... 48
5.2.3. Future Research and Research Limitations... 49
6. Reference ... 50
7. Appendixes ... 56
Appendix 1 ... 56
Appendix 2 ... 56
Appendix 3 ... 57
5
List of Abbreviations
Abbreviation Explanation
SET Sustainable Energy Technology
ME Mechanical Engineering
IDE Industrial Design Engineering
IEM Industrial Engineering and Management
BA Business Administration
CE Chemical Engineering
CEM Civil Engineering and Management
ES Embedded Systems
N Nanotechnology
EE Electrical Engineering
SE Spatial Engineering
GSEO Geo-information Science and Earth Observation
EEM Environmental and Energy Management
HS Health Sciences
MSM Master Risk management
CS Communication Studies
CME Construction Management and Engineering BIT Business Information Technology
P Psychology
EST Educational Science and Technology
6
1. Introduction
Empowered by the ever-rising employment of the internet and computing technologies, corporations gather massive amounts of consumer data, which is made feasible by advances in storage, networking, and data processing technologies. The swelling applications of neuroscience, internet of things, artificial intelligence, data mining, and social network analysis techniques have further fuelled the desire for personal information vis-à-vis effective strategic decision-making (Chester, 2012). These technologies are the primary input of customer data, which is used to personalize websites to surge the conversion rate (Tucker, 2014). Personal information is perceived as an ever more valuable commodity and the prevalent use of personal data for marketing purposes has created a market of it with an annual transaction of roughly 156 billion dollars (Montes et al., 2016). An industry group portrays online personalization as “the usage of technology and customer information to customise electronic commerce interactions between a business and each individual customer” (Adomavicius, 2006). Among marketers, personalization is usually presumed to be the utmost effective tool for attaining business success online (Cao and Li, 2007). Targeted advertising is a form of personalization in which advertisers target the individuals with customized-content; it has seen outstanding growth in the past few decades (Zhao, 2012; Zhao and Xue, 2013). Prevalent forms of this type of advertising are contextual targeting, behavioural targeting, IP-based geo-tracking and explicit profile data targeting (Lambrecht and Tucker 2013). A recent report states that digital advertising creates yearly revenue of €41.9 billion in Europe, soaring at a rate of 12.1 % year-on-year in 2016 (IHS Markit, "The economic value of behavioural targeting in digital advertising ", 2017). A rising percentage of this revenue and growth is specifically attributable to behavioural targeting. There are many definitions of behavioural targeting; it is also known as “behavioural profiling” and “online behavioral advertising” (Bennett, 2010). Instances include “a technology-driven advertising personalization method that enables advertisers to deliver highly relevant ad messages to individuals” (Nelson et al., 2016, p. 690) and “adjusting advertisements to previous online surfing behavior” (Van Noort et al., 2014, p. 15).
These definitions have two common characteristics; first, tracking or monitoring of user’s online behaviour and second, utilize the gathered data to individually target ads. Therefore, Sophie et al. (2017) describe it as “the practice of monitoring people’s online behavior and using the collected information to show people individually targeted advertisements”. Online behaviour can include search histories, web-browsing data, media consumption, responses to advertisements, communication content and purchases (Zuiderveen Borgesius, 2015). The purpose of behavioural targeting varies across different type of firms, for instance, it was a world news that the American retailer Target knew about the pregnancy of a teenager before her father. Big-data (concerning the type of products and their frequency) was used by the Target to determine 'pregnancy prediction score' of women. If a woman scored higher than the benchmark set by the Target, they sent the discount coupons for the baby products.
7 to execute this task, is quite expensive. Eventually, due to a limited resource for advertising, SMEs end up with the inefficient usage of website visitor’s data. Further, a recent scandal by Facebook (Social-media website) and Cambridge Analytics (British political consulting firm) to cunningly harness the personalized data of millions of users without their explicit consent to influence the aftermath of the Brexit vote and United States presidential election of 2016, significantly alleviates the concern of SMEs about handling of users’ data (Meredith, 2018). Nevertheless, the dataset used in this study is anonymous and complies with GDPR regulations ("Guideline privacy rules: protection of personal data in scientific research", 2018).
Behavioural targeting has four essential stages (Srimani et al., 2011): first, uniquely recognize every user and generate a searchable database; second, track user’s internet activities and record all relevant information (without personal identifiers); third, generate a user profile using an advanced algorithm and finally, send advertisements which are best suited to a specific individual based on past online behaviour. Although all the steps are crucial, the third stage- creating user profiles/ segments based on online behaviours- is the most critical and perplexing task. There is an enormous number of research articles available for disparate behavioural techniques and their contribution in ameliorating the online advertising regarding effectiveness and accuracy (Goldfarb & Tucker., 2011; Yan et al., 2009). However, there is a scarcity of research which outlines approaches for behavioural profiling based on the characteristics of data, unsupervised machine-learning algorithms and website visitor’s behavioural attributes. Therefore, defining a framework for unsupervised machine learning algorithms based upon characteristics of online-behavioural data can empower small and medium-sized enterprises. Consequently, even with a low budget, SMEs can effectively employ behavioural targeting technique. A comprehensive understanding of these approaches will assist the firms to treat the data carefully and avoid the pitfall. Furthermore, the university considered in this paper has gathered the data about digital trails (behavioural attributes) left behind by visitors while surfing its website from past some years via Google Analytics and CRM software. Until now most of the patterns in the online behaviour of the users is unacknowledged to university (stated by the University marketing department). These unclear patterns present a challenge to dive deep into the huge piles of behavioural data of users to obtain patterns and analyse them from a disparate perspective to render meaningful insight to the marketing department of the university to design targeted campaigns or advertisements. Further, advertisements sent to the relevant cohort of users, will soar the user engagement and motivate/encourage the user to complete the conversion process. The conversion rate is the way of converting the website visitor into a paying customer. The usage of this term is conditional on the kind of websites, where some consider it as an outcome of actions other than sales (“Conversion Rate,” 2017). An illustration of desired actions includes but is not limited to registration, newsletter subscriptions, submission of application dossiers.
8 Research Question: What are the behavioural profiles of Indian website visitors interested in the master studies at the University of Twente?
Further, following questions are necessary to be addressed to answer the main question 1. What are the characteristics of customer behavioural data used for profiling?
2. What sort of unsupervised machine-learning algorithm is appropriate for profiling nominal/categorical datasets?
3. How to identify the behavioural profiles?
4. Are the discovered behavioural profiles of Indian visitors consistent with an entire bunch of visitors interested in the master studies of the University of Twente?
To fulfil the objective of this study, relevant literature concerning segmentation such as machine learning and user profiling is reviewed. However, the core literature for this paper is user profiling, customer segmentation, clustering, unsupervised machine learning and identifying the suitable techniques for behavioural profiling of website visitors to augment the effectiveness of behavioural targeting.
The data used in this study are from the University of Twente, thus making it an explorative case study. Also, targeting relevant online advertisements to visitors will positively influence visitor’s engagement, which may enhance, for instance, application submission rate, one of the crucial conversion points for most of the higher education institutes. Dataset used in this study is secondary, i.e. obtained from CRM (Customer Relationship Management) database and Google Analytics.
This study is an endeavour to close the gap in the literature, by developing the framework which consists of disparate machine learning approaches to leverage the customer attributes to support business decisions. Further, this study laid emphasis particularly on the symmetric binary dataset (category of the nominal dataset) of low volume and low dimensionality to execute unsupervised machine learning algorithms. This paper laid the foundation for future research in which analysis of the sequence of interactions on the university website along the timeline for the interested high potential prospect, i.e. ‘Interested-HP’ profile of Indian visitors interested in master studies could potentially reveal more insights to develop a robust prediction model, and further integration of text analytics could help to understand the semantics in behavioural data.
9
2. Theoretical Framework
To accomplish the objective of this paper, several aspects need to be accentuated. For instance, definition of behaviours, machine learning and its algorithm, customer characteristics etc. This chapter introduces the core literature used in this research. Every section illustrates the relevant facet of the key literature which permits the researcher to generate the framework consisting of ML algorithm strategies which is based on the attributes of data to execute clustering analysis with minimum inaccuracy. Relevant literature regarding each aspect is summarised and discussed briefly in each section.
2.1. Description of Behaviour
Prior to behavioural profiling, it is essential to understand and define the behaviour. Consequently, in this section, the definition of behaviour pertaining to this paper is expounded. In conventional terms, the behaviour is manner or fashion with which a being or system interact with one another. Cao (2014) states that behaviours are recognized by demeanour and actions with which beings interact with their environment. Behaviours had been immensely studied in the offline (non-digital) world from distinct viewpoints due to their explicitness (Cao, 2014). Though with the advancement of digital technology, behaviour took intricate forms, as it comprises the implicit form of digital information. For instance, the manner in which user seek out the information or respond to the digital environment. Behaviour logged in digital format are often termed “Soft Behaviour” or “Behaviour Computing” (Cao, 2014). In the field of behavioural informatics, Cao (2010) defines behaviour as “activities that present as actions, operations, events or sequences conducted by humans in specific context and environment in either virtual or physical organization”. Behaviour computing is a favourable chance to ameliorate and discover certain behavioural patterns that could be utilized for distinct purposes in management and business intelligence (Cao, 2014).
Fayyad, Piatetsky-Shapiro & Smyth (1996) define the pattern as “an expression in some language describing a subset of the data or a model applicable to the subset”. They accentuated that unravelled patterns is valid to some extent on new data that could render useful information which succour user in decision-making. Hence, Fayyad et al. (1996) concludes that for any pattern to be recognized as a pattern it has to exceed beyond a certain threshold to render meaningful information.
10
2.2. Discovering Knowledge in Data
As stated in the earlier section, certain techniques are required which can be applied to the user’s behavioural data to extract significant yet thoughtful informative insights. Data mining refers to the process of discerning meaningful patterns and trends in huge datasets. Big data and data mining go hand in hand. The challenges big data presents are frequently characterized by four V’s– volume, velocity, veracity and variety. Volume is referred to the amount of data. Velocity represents the flow rate, i.e. the speed at which data is being generated and changed. Variety refers to distinct sorts of data being generated (clicks, numbers, text, etc.). Veracity refers to the issue of validity, meaning accuracy of data for the intended use.
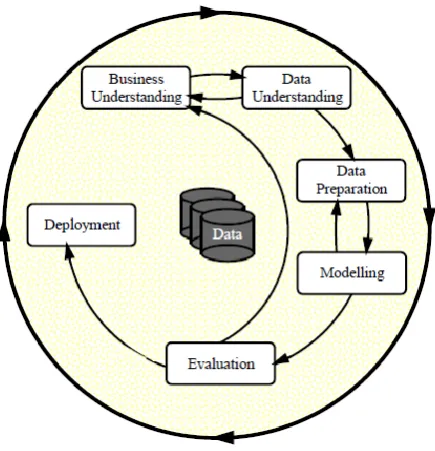
Analysts from SPSS, Daimler- Chrysler, and NCR established the Cross-Industry Standard Process for Data Mining (CRISP-DM) (Wirth et al.; 2000). CRISP-DM renders a non-proprietary and freely accessible standard process for fitting data mining into the generic problem-solving strategy of a research or business unit. As per CRISP-DM, a data mining project has a life cycle that consists of six phases - business/research understanding phase, data understanding phase, data preparation phase, modelling phase, evaluation phase and deployment phase, respectively. This phase-sequence is adaptive. That is, the next phase in the sequence often relies on the outcomes linked with the previous phase. The iterative nature of CRISP is represented by the outer circle in Figure 1.
Further, Fayyad et al. (1996) devised the term Knowledge discovery that consists of some previously mentioned techniques and distinguished it into two types: (1) Verification and (2) Discovery. The first category verification is limited to prove or disprove the hypothesis and second category Discovery, autonomously explore new patterns in data. Discovery is further subdivided into prediction and description. In prediction, the system finds patterns from behaviours (for instance number of clicks, content reading time) for predicting the future behaviour. On the contrary, descriptive sub-category unveils the naturally occurring patterns
[image:10.595.189.407.366.592.2]11 in the dataset. In brief, descriptive category pertaining to the Discovery is relevant for this study. The descriptive technique can be used for clustering or segmentation, whereas, predictive technique can be utilized for customer characteristic prediction.
This section demonstrates the synopsis of data mining and its six phases of the life cycle and a description of techniques for discovering knowledge in data mining. Techniques which are usually used for a descriptive and predictive category of knowledge discovery are highlighted in the following section.
2.3. KD Modelling Techniques
This section describes the machine-learning algorithm used for subcategories of knowledge discovery, i.e. descriptive and predictive. Selecting descriptive and predictive one over another is entirely depends upon the research/ business goal of the individual. Machine learning field belongs to computer science that frequently uses statistical techniques which renders ability to computers to learn with the aid of data, without explicitly programmed. Nowadays, in the marketing domain, it is frequently used for customer profiling, classification and predictions. It is usually divided into two categories supervised-machine learning and unsupervised machine learning. The unsupervised machine learning resembles the descriptive category, as its algorithm identifies the naturally occurring patterns in the data whereas supervised-machine learning corresponds to thepredictive category; it requires the output data, to train the input variables, to generate the classification/ prediction model. Supervised learning is occasionally called learning with a teacher; the teacher states the network which one is the accurate answer.
2.3.1. Unsupervised Machine Learning
Unsupervised machine learning is the task of deducing a function to describe the hidden structure from “unlabelled data”. Clustering techniques are unsupervised machine learning, i.e. they do not require the target variable to identify arbitrary patterns in the data. It is an effective tool in managerial or scientific inquiry for discovering a natural pattern in the dataset. It splits a set of data into m-dimensional clusters, which are homogenous within and maximize the dissimilarity between them. Fahad et al. (2015) introduce a framework that categorizes the various clustering algorithms prevalent in the literature into distinct groups. These clustering algorithms can be broadly classified as follows: Partitioning-based, Hierarchical-based, Grid-based, Density-based and Model-based. Further, among these clustering algorithms in the marketing domain, three categories Partitioning-based, Hierarchical-based and Model-based are largely used in the scientific literature for segmentation (Fahad et al., 2015).
Hierarchical Clustering
12
Non-hierarchical/ Partitioning methods
A partitional or non-hierarchical clustering is a division of a set of observations into non-overlapping clusters (subsets) such that individual observation belongs to exactly one subset.Partitional clustering requires a predefined number of clusters to assign records to each cluster. These methods are generally computationally less intensive therefore it is preferred for large datasets. K-means is the prevalent clustering method in this category. There are numerous other partitioning algorithms such as PAM (Partitioning Around Medoids) and K-modes.
Model-Based Method
Such methods optimize the fit between the predefined mathematical model and given data. It is based on the supposition that the data is generated by a blend of underlying probability distribution. Further, it paves the way to automatically determine the number of clusters, which is based on standard statics and considering outlier, thus yields a robust clustering method. Self-Organising Maps (SOMs) or Kohonen maps is widely used model-based approach for clustering.
2.3.1.1. Literature Review of Unsupervised Machine Learning
Clustering is the key problem in data management and has an illustrious and rich history with literally thousands of disparate algorithms published in this domain. Even so, a sole method K-mean (partitioning clustering) remain the most prevalent clustering method; in fact; it was considered as one of the 10 algorithms in Data mining. Scaling, K-means to large datasets is relatively simple due to its iterative nature. However, the accuracy of the K-means procedure is highly dependent upon the choice of beginning seeds (Milligan & Cooper, 1987) and it often falls in local optima. Mishra et al. (2012) stated apart from local optima; the K-means algorithm is quite sensitive to the initial centroid. These are the major shortcomings of K-means, which decreases the accuracy of post-hoc (data-driven) market segmentation due to which the precise designation of market clusters is quite hard for marketing managers. To explore the solution to this problem the researcher reviewed the core literature related to the clustering and segmentation in the domain of marketing.
Punj and Steward (1983) suggested the combination of hierarchical approach i.e. Ward’s minimum variance, followed by non-hierarchical approach i.e. K-means. His proposed algorithm provided better results than using either a hierarchical or a non-hierarchical method alone. Their approach is known as a two-stage approach. However hierarchical has its own disadvantages; first, for large datasets, it is expensive and slow; second, it cannot handle high dimensionality. Kuo et al. (2002) proposed a modified two-stage method, which initially uses the self-organising feature maps to determine the number of clusters and then employs the K-means algorithm to find the final solution. Pivotal steps taken by Punj and Steward (1983) and Kuo et al. (2002),revealeda good initiation point could significantly affect the K-means result and reduces the rate of misclassification. Therefore, Self-Organising Maps (SOMs) followed by K-means is a superior algorithm to obtain clusters.
13 These maps caught the attention of the researcher in different domains, ranging from biology to marketing (Augustijn et al., 2013). In its original version, the SOMs was aimed to cluster the real-valued data, so when it fed with categorical or binary data, the model usually delivers the worst results. Above that, when handling the categorical data other worries remains for example: encoding the categorical data into a real-valued vector and simultaneously conserving the categorical similarity information (Hsu, 2006). Some authors addressed the categorical/ binary learning problem via extending the SOMs to deal with these sorts of data. Lourenco et al. (2004) used the animal dataset to study different sort of similarity measurements, including euclidean distance, to examine the performance of Kohonen networks on binary data. But, still the unit’s weight treats input value as real value. A similar incident happened in this research when the researcher tried to implement the SOM algorithm with euclidean distance on binary data. Appiah et al. (2012) introduced the tristate neuron weights strategy as a learning process, in which hamming distance was used instead of the euclidean distance. Trails with the MNIST dataset (LeCun et al., 1998) represented that; implementation of this approach is 30 times swift than original SOM, but it delivered the bad clustering accuracy. Santana et al. (2017) proposed effective SOM extension for the binary dataset, which considers both key training steps of self-organising map algorithm: determination/competition of winner neuron and network update rule. Santana et al. (2017) experiments with the proposed SOMs model deliver quite impressive clustering results as compare to other SOM models for binary dataset.
In this research, the researcher is using R language, which is free software for statistical computing and graphics. R and its libraries include clustering, classification and others machine learning algorithms. A key set of packages often included with the installation of R, and it has more than 12,500 additional packages as of May 2018 ("R (programming language)", 2018). However, there is no algorithm in R packages which can execute kohonen network algorithm on binary data. It is beyond the scope of research, to develop one for this research. In addition, K-means algorithm specifically performs best on metric dataset whereas produces meaningless clusters for categorical dataset because of integration of euclidean distance in its algorithm. Therefore, the researcher investigated for another set of techniques in the scientific domain to deal with binary/ categorical data.
2.3.1.2. Algorithm and similarity measures for Binary data
As mentioned in the previous section SOMs neither be used for dimensionality reduction nor to determine the number of clusters for binary dataset because of the inability of current packages of Kohonen network in R language to alter the original algorithm, which permits the use hamming distance instead of euclidean distance. There are other approaches available in the literature as well to explore the relationship between variables such as factor analysis or principal component analysis, (Jolliffe, 2002), or their categorical counterpart, correspondence analysis (Greenacre, 2010) is quite famous. However, the solution rendered by these methods is usually hard to interpret (Palla et al., 2012). There is a scarcity of approaches for categorical variable clustering, some of which are, for instance, hierarchical clustering or latent classes accentuated by Frolov et al. (2014) . Hierarchical clustering for the nominal, ordinal or metric dataset is often employed to determine the number of clusters. This sort of clustering based on proximity matrix, which includes dissimilates among all inspected variables. Dissimilarity can easily be computed by a simple transformation of the similarity measures.
14 distance are two pervasively used distance measure for continuous data. The notion of distance for a categorical variable is not candid as for continuous data. The fundamental difference is that categorical attributes are not inherently ordered. If we consider two multivariate categorical data points, the distance or similarity among them is directly proportional to the number of characteristics in which they match.
(Boriah et al.; 2014) asked the question “Which similarity measure is best suited for my data mining task?”, their experimental outcome suggested that there is no sole best performing similarity measure. Dataset used in this research is binary variables whose outcome can obtain only two values, i.e. 0 and 1. In nominal scale, observations are only allocated to different classes, but they can’t be measured nor ordered. Binary variables often called symmetric, if there no specific choice for the outcome, i.e. both outcomes are equally valuable and assigned identical weight when proximity measure is calculated. On the contrary, if the outcome of binary variables is not equally valuable then, the binary variable is known as asymmetric. Tamasauskas et al. (2012) examined five asymmetric and five symmetric distance/ similarity measurements. Tamasauskas et al. (2012) categorised, Hamming, Dmatch, DSQmatch, Roger and Tanimoto and Sokal and Sneath 1 under symmetric distance measurement. Asymmetric distance measurement consists of Djaccard, Dice, Russell and Rao, Bray and Curtis and Kulcynski 1. Tamasauskas et al. (2012) chief aim was to evaluate the accuracy of distinct hierarchical clustering algorithms performance with respect to disparate similarity measures specifically for the binary dataset. Hierarchical clustering method used in Tamasauskas et al. (2012), research includes Average linkage, Centroid Linkage, Complete Linkage, Density Linkage, Flexible-beta, McQuitty’s, Median, Single linkage, Two-stage density linkage and Ward’s. Tamasauskas et al. (2012) experiment revealed that the symmetric distance measurements outperformed the asymmetric ones as their errors rate are smaller. Among the ten hierarchical algorithms in the study of Tamasauskas et al. (2012), complete linkage performed the best among all symmetric distance measurement whereas McQuitty’s, Density linkage, Single linkage and Median algorithm performs the worst. Outcomes of the performance of hierarchical clustering algorithms on symmetric distance measurements are shown in Appendix 1.
Therefore, to determine the number of clusters (first stage of proposed framework section 2.9), researcher executes the hierarchical clustering with complete linkage algorithm and hamming distance (symmetric distance measurement).
Chan (2008) has categorized prevailing customer segmentation/ clustering methods into application-oriented and methodology-oriented approaches. Often methodology-driven studies modify data clustering techniques such as ward's minimum variance method, K-means, or use a blend of two or more data mining techniques to attain more accurate segments or clusters (such as Lee et al., 2004; Tzeng et al., 2007). “On the other hand, in application-oriented approach researcher must search for the optimum method for solving segmentation problems in specific applications” Chan (2008).
This study used a methodology-based approach. In methodology oriented, this research executes a combination of complete linkage (hierarchical clustering) followed by K-modes, to obtain the meaningful clusters for the symmetric binary dataset.
K-modes
15 considered component-wise. Second, instead of euclidean distance, K-mode uses hamming distance (Simple matching dissimilarity measure), again component-wise. Hung (1998) also stressed that; the K-mode clustering algorithm is swifter than K-means as it converges in less number of iteration. In principle, K-modes is like K-means, expect the two differences stated above. Like K-means, K-mode clustering algorithm requires the initial number of clusters, which difficult to determine and if determination of an optimum number of cluster went wrong, it would mislead the interpretation of results (Khan et al.; 2013). That is why the researcher adopted the two-stage clustering for the data set used in this research, i.e. firstly determine the number of the cluster via hierarchical clustering and then execute K-modes clustering algorithm.
The k-modes consists of the following steps (taken from Huang (1997)): 1. Select, the initial number of clusters k.
2. Allocate the data objects or observations to the cluster whose cluster centre closest to it. 3. Then, retest the dissimilarity of the observations against the current modes. If observation
found nearer to the mode of another cluster then the current one, it reallocates observation of that cluster and update modes in both clusters.
4. Repeat step 3, until no observation has changed cluster membership.
In the upcoming sections, framework for multi-stage clustering is developed. It is designed to execute clustering on categorical and numeric data considering the volume and dimensionality of the dataset.
2.3.2. Supervised Machine Learning
Classification is a supervised machine-learning algorithm. The aim of this system is to generate a mapping (also called model) between a given set of documents and class labels. It is then used to determine the class of new unlabelled document automatically. To predict numerical variables (continuous values typically real value) a regression technique (linear regression or multiple regression) is used to approximate the outcome based on the new data. Another famous classification technique is decision trees, for variable which takes a discrete set of values.
This section accentuated numerous Knowledge Discovery techniques labelled by Fayyad et al. (1996), as Machine Learning methods in the IT field. Two main categories are supervised, and unsupervised machine learning, elaborate detail about each technique succours to recognize suitable technique to attain the purpose of this paper. However, further information is necessary how segmentation and user profiling should be done. Therefore, the following section summaries general approaches of segmentation in literature.
2.4. User profiling Approaches
16 second cohort based on ‘post hoc’ or ‘data-driven’ method, i.e. empirical analysis is executed using multivariate analysis to recognize the segments. This approach creates a user profile, which is hard to interpret. However, it has the capability to divulge concealed relations among users that are unnoticed by the typical segmentation approach (a priori).
In an endeavour to alleviate the shortcoming of both approaches, Dolnicar (2004) suggests a Hybrid in which segmentation is done in two stages. The four approaches he introduced is a permutation of a priori and a posteriori method, i.e. a priori-a posteriori, a priori – a priori, a posteriori- a priori and a posteriori- a posteriori. For instance, in ‘a priori- a posteriori’ the segmentation process initiates with common-sense (a priori) segmentation and then every segment is separated into more refined sub-segment by using a posteriori (Dolničar, 2004).
In brief, there are three approaches to segmentation: ‘a priori’, ‘a posteriori’ and ‘hybrid’ (two-step approach). Among these approaches, Dolnicar (2004) proposed that hybrid approach balances the demerits of prior two approaches to achieve a robust segmentation, which is easy to interpret yet generates thoughtful insight. However, these approaches do not recognize how the nature of gathering user’s information effects the quality and interpretability of behavioural profiles. Therefore, the following section describes nature of gathering user’s information and user profiling methods.
2.5. User profiling Methods and Nature of Information
In prior section, approaches discussed for user segmentation were failed to consider the effect of nature of gathering user’s information on segmentation. In the literature, there are two central ways of obtaining information about the user. These are termed as an implicit or explicit information gathering. In the explicit method, the user explicitly provides information pertaining to the user’s preferences. The demerit of this method is that explicit profiles are static in nature and valid until the user alters their preferences and interest parameters explicitly. It is used for static profiling which analyses the static and predictable attributes of users. On the contrary, implicit information is harnessed dynamically by observing the user’s interactions with the system automatically. The implicitly generated profile is known as a dynamic or implicit user profile. Unlike static profiling, implicit profiling analyzes user’s behavioural pattern (e.g. past browsing behaviours) to identify user’s interests.
In implicit profiling, the precision of the user profile contingent on the volume of data generated through user-system interaction. It is also possible to create a hybrid user profile in two ways. One way is to initiate by explicit technique to gather data followed by an implicit technique. The second way is vice-versa. It has been cited that hybrid methods are more proficient than both aforementioned methods (Khosrowpour, 2005). Comparison of the aforementioned user profile type presented in Appendix 2.
17 user’s present behaviour is predicted based on the user’s past behaviour. The system selects the things in which content correlation with the user profile is high. The content dependence is the key disadvantage of the content-based filtering. Also, these methods give poor performance if the volume of data is inadequate. Collaborative method also known as collaborative filtering method, which considers a user who belongs same cohort (e.g. same sex, age or social class) behave similarly and hence, have similar profiles. In this method users with similar taste, are referred to as ‘like-minded people’ (Cufoglu, 2014). The hybrid method integrates the advantages of both method and simultaneously eliminates the shortcomings. Summary of the user profiling methods proposed by Cufoglu (2014) can be found in Appendix 3. In this study profiling method is based on the Collaborative method.
In brief, there are three ways of obtaining user’s information for profiling, among which hybrid information for profiling address the limitation of both implicit and explicit user data, which is highly pivotal for generating accurate user profiles. Further, in user-profiling methods, hybrid method tackles the shortcoming of a collaborative and content-based method to obtain clusters reflecting true behaviour of users.
2.6. Types of User-profiling and its Characteristics
In this section, various categories of data attributes used for customer segmentation/user profiling in the literature are mentioned. It is significant to recognize diverse customer data attributes, as utilizing a combination may yield a meaningful user profiles (from here segmentation and profiling are used interchangeably). Different data attributes of customers are used for different business situations. The following most widely used segmentation types and its characteristics are described:
Value-Based
Value-based data feature is used to classify the customers according to their value (Hosseni et al., 2011; Chorianopoulos et al., 2009). Customer value has been defined by numerous researchers, which usually recognised as customer profitability or customer equity (Hosseni et al., 2011). Relevant customer attributes pertaining to these are usage situation, necessities, favourite channel, preferable promotions etc.
Behavioural
Behavioural data feature permits the pattern recognition based on the passive behaviour of internet browsing session such as usage rate, visit frequency, benefit sought, the frequency of transactions, revenue history, user status (Baranowska, 2014). Hence, such a characteristic of data used to unveil patterns to group users with the same patterns.
Loyalty or Engagement
Loyalty or Engagement characteristics of data help to identify the distinct grouping of customers according to different extent of loyalty or engagement to brand or customer (Stroud, 2006). Characteristics related to these can be the frequency of purchases, the frequency of complaints, engagement scores, engagement interests etc.
Socio-demographics and Life Stage
18
Needs or attitudinal-based
These data characteristics succours to explore customer’s needs which can be fulfilled by the purchase of a service or product, service, views, preferences and attitudes (Chorianopoulos et al., 2009). In the offline environment, the data required for this sort of profiling is fundamentally collected from external sources for instance market surveys via which customer can express their preferences and opinion. In an online setting, these characteristics consist of visited channels, visited Sites, page Views etc.
2.7. Data Sources
To obtain meaningful behavioural profiles, data sources of customer attribute as important as an appropriate clustering algorithm. The data sources for customer big data analytics mainly classified into five types: transactional data, data about service/product use, web behaviour data, data from customer-created texts and data about social network activities. This research is concentrated towards web behaviour about the user. Therefore, necessary data pertaining to it is extracted from web analytics. Instrumentation of web analytics implies that using methods and technologies with a purpose of recording and storing pertinent data connected to the interaction between the users and the system. Two distinct types of techniques applied when capturing user’s behavioural data from an online services are page tagging and log files. The advantages and disadvantages of these two methods (page tagging and log files) are illustrated by Singal, Kohli, and Sharma (2014, p. 25).
2.7.1. Page Tagging (Google Analytics)
One general way to capture the user behaviour data from a website is the page tagging method. Page tagging depends on a piece of JavaScript that is injected to the source code of the page. When the browser loads a webpage, the browser executes the JavaScript code and data is transferred to the server hosting the analytics application. Depending on the need of the web site administrator, the tracking can be targeted only to a part of the website. Usually, all the pages of a given website are equipped with a tracking code. Applying page tagging to all the pages opened by the user basically enables the discovering the user behaviour more comprehensively as all the possible pages are being recorded. The Google Analytics is a widespread page-tagging tool as per W3Techs technology report nearly 86.4% of websites as per their database incorporated this in their web pages ("Usage statistics and market share of Google Analytics for websites", 2018).
2.7.2. Log files (CRM)
Log files denote the web server log files, which records the user interactions, for instance, pages opened by the users, in the form of a log file entry. In academia and literature, this technique is known as a transactional log analysis (Arshad & Ameen, 2015). CRM software’s are often employed to obtain this type of data. As per the survey, nearly 55% of higher education institutes is not utilizing CRM data for enrolment and marketing purposes (Blackboard, 2014).
19
2.8. Behavioural Attributes
As accentuated in the prior section, having a comprehensive understanding of user-profiling types renders relevant insight about behavioural attributes to achieve the purpose of this paper. There is numerous literature available in which researchers used behavioural attributes for user profiling (Chorianopoulos et al., 2009; Boratto et al., 2016). Behaviours which is often used in behavioural targeting are mentioned below (Pandey et al., 2011; Baranowska, 2014):
As aforementioned, this study is based on fundamental assumption that user who belongs same cohort behave similarly (collaborative method) and vice-versa (Cufoglu, 2014).
2.9. Framework for User Profiling
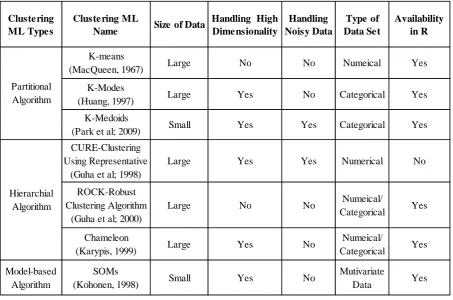
In this section, the framework is presented, Table 1 describes the virtues and shortcomings of unsupervised machine-learning clustering algorithms in terms of size, the ability of handle dimensionality, noise, type of dataset and its availability in R language. Fahad et al., 2014 stated that size of data set has a considerable effect on the quality of clustering, i.e. some clustering algorithm is more efficient as compare to the other when the dataset is small and vice-versa. Datasets with numerous attributes are denoted as high dimensional because handling them presents the specific computational challenges. Fahad et al., 2014 also mentioned, handling high dimensionality is an essential feature in clustering analysis as numerous application requires the analysis of object with a high number of attributes, for instance, a text document may contain hundreds of keywords as attributes. However, it is difficult due to the curse of high dimensionality as some dimension are not relevant in the dataset, and it increases sparsity thus make interpenetration of clusters meaningless. Regarding the curse of dimensionality, the pivotal problem lies in the loss of discriminative power of density or distance measure (Assent, 2012). Assent (2012) did a comprehensive review of the clustering of high dimensional datasets. However, Assent (2012) found that there is no persistent definition in the literature pertaining to the minimum of dimensions, which can be considered as a high dimension. In some studies, data with as few as ten variables (dimensions) are referred as high dimensional, whereas numerous works, specifically in image processing, bioinformatics have hundred, or thousands of attributes (see, e.g., Jiang et al., 2004; and Kailing et al., 2003). Therefore, for this study researcher is considering <=10 as low dimension and >10 high dimension.
In Chapter 2 section 2.3.1, the researcher discussed the importance of executing two-step clustering and accentuated how machine learning algorithm counters each other merits
Interactions clicked Offers viewed Web-shop visits
Interactions viewed Product type purchased Operating System Version Visited channels Product type viewed Campaigns
Visited sites Number of visits Referring URL
Page views Number of page views Location
Preferred social media Average visit time Sequence of page visited
20 and demerits in particular scenario to obtain simple yet robust cluster which will render significant insights. Therefore, the framework in Table 2 represents the strategies under what condition which combination yields near to optimal results. The first stage is designed to determine the number of clusters. Therefore, all the algorithms (hierarchical or model-based) mentioned in stage 1 for the numerical or categorical dataset, would explore certain patterns and identify the suitable number of clusters. Stage 2 algorithms require the number of clusters to execute the final clustering. K-means, K-modes, SOMs/ Kohonen maps and traditional hierarchical clustering methods such as ward’s minimum variance, complete linkage, single linkage etc. already discussed in Chapter 2 section 2.3.1. This section renders very short introduces to ROCK, CURE and CHAMELEON algorithm (Pandove, 2018).
ROCK (Robust Clustering using links): This clustering algorithm belongs to the agglomerative hierarchical clustering algorithms. It works well on both boolean and categorical variables, and it uses the concept of links to measure the likeness between a pair of data points (Guha et al.; 2000).
CURE (Clustering Using Well Scattered Representatives): It is used to illustrate the clusters with the aid of well-distributed representative points. Cluster distance in these techniques is the minimum distance between the representative points, which implies this incorporates both average and single linkage methodologies (Guha et al.; 1998). It is cables of capturing cluster of arbitrary shapes by selecting the scatter plot.
21
Clustering ML Types
Clustering ML
Name Size of Data
Handling High Dimensionality Handling Noisy Data Type of Data Set Availability in R K-means
(MacQueen, 1967) Large No No Numeical Yes
K-Modes
(Huang, 1997) Large Yes No Categorical Yes
K-Medoids
(Park et al; 2009) Small Yes Yes Categorical Yes
CURE-Clustering Using Representative
(Guha et al; 1998)
Large Yes Yes Numerical No
ROCK-Robust Clustering Algorithm
(Guha et al; 2000)
Large No No Numeical/
Categorical Yes
Chameleon
(Karypis, 1999) Large Yes No
Numeical/
Categorical Yes
Model-based Algorithm
SOMs
(Kohonen, 1998) Small Yes No
[image:21.595.72.526.92.392.2]Mutivariate Data Yes Partitional Algorithm Hierarchial Algorithm
Table 1: Illustrates virtues and shortcomings of unsupervised machine learning algorithms
Table 2: Framework outlining various strategies for user profiling based on characteristics of dataset and unsupervised machine learning
S ize Dimensions S tage 1 S tage 2
Low (<=10) SOM s K-M ean
High (>10) SOM s K-M ean
Low (< 10) CURE K-M ean
High (>=10) CURE K-M ean
S ize Dimensions S tage 1 S tage 2
Low (< =10) Ward's M ethod\Complete Linkage K-M ediods/K-M odes
High (>10) Chameleon K-M ediods/K-M odes
Low (< =10) ROCK K-M odes
High (>10) Chameleon\ ROCK K-M odes
Small (<=2400 observations) Large (>2400 observations) Categorical Dataset Numerical Dataset
Unsupervised ML Algorithms Unsupervised ML Algorithms
Small (<=2400 observations)
[image:21.595.66.532.475.693.2]22
2.10. Model for determining the quality and interpretability of User Profiling
In section 2.4 and 2.5 of Chapter 2 approaches to user profiling and nature of data sets pertaining to the user’s information was discussed. Cufoglu (2014) sated two ways of obtaining information about users, i.e. implicit and explicit information gathering. In the explicit method, the user of the system explicitly renders information related to his/her preferences. The demerit of this method that explicit profiles are static in nature and valid until only the user alters their preferences and interest parameters explicitly (Gena, 2005). It is used for static profiling which analyses the static and predictable attributes of users. On the other hand, implicit information is harnessed dynamically by observing the users interactions with the system automatically. The implicitly generated profile is known as a dynamic or implicit user profile. Unlike static profiling, implicit profiling analysis user’s behavioural pattern (e.g. past browsing behaviour) to identify user’s interests (Khosrowpour, 2005). Here, the precision of the user profile contingent on volume of data generated through user-system interaction. It is also possible to create a hybrid user profile in two ways. One way is to initiate by explicit technique to gather data followed by an implicit technique. Khosrowpour (2005) stated that the hybrid method is more efficient in comparison with the sole implicit or explicit method. Cufoglu (2014) accentuated the accuracy of implicit information ameliorate with continuous use of the system by users whereas the accuracy of the explicit/personalized information depends upon the manually rendered information which is updated by the user. Example of implicit (static) information consists of native country of the visitor. On the contrary, dynamic information consists of needs, behavioural attribute etc.
Table 3: Model to determine the quality and interpretability of user profiling based upon the nature of information
Nature of information
Quality of profiling ( in terms of accuracy)
Efforts in gathering data
Difficulty in interpreting
Explicit Data (static information)
Contingent on the accuracy of
information provided by the user High Low
Implicit Data (dynamic information)
Contingent on the amount of interaction between user and system
(Higher interaction higher accuracy)
Minimal effort by
the user High
Implicit and Explicit
Data Contingent to both stated above Moderate Moderate
2.11. A literature review of other techniques implemented in the domain of Behavioural Targeting for User-profiling
23 for user profiling which are either novel or first time implemented in the domain of User-profiling. Such approaches are mentioned below:
Low et al. (2011) addressed the problem related to the creation of a user profile for behavioural targeting. They demonstrated, time altering the hierarchical user model which harness the short and long-term user interests and this model is known for its application at web scale. They represented that streaming distributed inference algorithm can handle tens of millions user data and simultaneously accustomed to user’s interest as it aids to know about the user. Their learnt user demonstration was empirically proven effective in computational advertising.
Yao et al. (2010) proposed a two-step approach for profiling the users, i.e. by integrating Ward clustering with predictive analytics. Yao et al. (2010) mentioned SOM-Ward Clustering is based on the unsupervised neural clusters, thus useful for exploratory data analysis, i.e. when no a priori categories have been identified, and it possesses robust capabilities in handling missing data, non-linear relationships and skewed distributions. On the other hand, predictive customized to a specific purpose and it is a part of supervised machine learning. His results demonstrate this combination is potentially effective in customer profiling/ segmentation.
Gong et al. (2013) argued that often user profiling work adapts clustering algorithms and treat data as user reprentation, but it does not consider the concealed semantics embedded in data. Therefore, in their research paper, they presented the behaviour based latent semantic user profiling and authenticate its validity on new ads. They illustrate data as characteristics of user issued query or clicked advertisements after that Latent Dirichlet Allocation (LDA) is applied to the dataset for user profiling. Gong et al. (2013) found as compared to famous k-means clustering their approach attain higher Click- through rate (CTR) values on advertisements.
Tu et al. (2010) also profiled the users with the aid of Latent Dirichlet Allocation (LDA) and compared with other three baseline user profiling approaches hierarchical clustering, k-means and pLSA (Probabilistic Latent Semantic Analysis). Their results demonstrate that the proposed method delivers better performance as compared to other baseline user profiling algorithms, both in terms of assessment metrics click entropy and CTR improvement.
24
3. Methodology
This chapter expounds the procedure to systematically realize the goal of this paper. The procedure is based upon the data-mining framework CRISP-DM (Cross-industry standard process for data mining), which outlines 6 phases of the data mining life cycle, i.e. business/research understanding phase, data understanding phase, data preparation phase, modelling phase, evaluation phase and deployment phase, respectively. This phase-sequence is adaptive. That is, the next phase in the sequence often relies on the outcomes linked with the previous phase. This chapter explores the first four stages of CRISP-DM: research-understanding phase, data research-understanding phase, data preparation phase and modelling phase. Further, the strategies are incorporated from the proposed framework and a model in the CRISP-DM framework for reliable user segmentation.
3.1. Research Understanding Phase
In this phase, the objectives of the research are coherently stated. As per the figures on the university website ("FACTS & FIGURES", 2018), the total number of students took admission is higher education studies of University of Twente was 10026 in 2016 out of which 53.06% are bachelor students, 41.15% are masters students and rest 4.15% are pre-master and post-master students. Admission criteria for these categories of students are distinct from each other therefore the researcher is anticipating, they reflect different behaviours while surfing the university website. Further, there are 2500 international students from nearly 80 nationalities, i.e. they form approximately 25% of the admitted students, which is interesting figure because although they form one-fourth of the total admitted students but their tuition fee (€ 11,500 / € 14,250 per annum for master studies , Non-European international students) is 5-6 times more as compared to national students or EU international students (€ 2,060 per year for a master studies) which implies that solely in terms of monetary value Non-European international students are highly beneficial. To encourage them to submit their application, it is pivotal to know their online-behaviour. However, the due presence of large number of nationalities, it is nearly impossible to analyse all of them within a limited time. Therefore, this study is focused on countries from where the majority of the traffic of prospective students arrive at the website of the University of Twente. India and Germany are the two countries that have the majority of prospective student traffic after the Netherlands. Therefore, the study/research focuses on prospective Indian master’s students/ website visitors. To make the study relevant a two-step analysis was executed: first, analyse patterns in the behavioural data of All Master visitors. In the second step, analyse behavioural patterns of Indian Master visitors and compare it with All Master visitors. The results would preferably lead to the discovery of behaviour manifested by potential prospects.
3.2. Data Understanding Phase
25 visitor's privacy. Entire data is anonymised, and it is harnessed with the clear consent of the user. It meets all the requirements of General Data Protection Regulation ("Guideline privacy rules: protection of personal data in scientific research", 2018).
Two sources are used for obtaining behavioural data; Google Analytics (page tagging) and CRM database of the university. These datasets are merged to create the dataset which has both implicit and explicit characteristics, but mostly explicit. However, data is of a secondary nature, its reliability and quality are often questioned in research. Therefore, to ameliorate the quality and reliability, validation of the data is necessary.
3.3. Data Preparation Phase
[image:25.595.70.510.490.624.2]This labour-intensive stage covers all aspects for formulating the final dataset, from the raw and dirty datasets. Further, it represents the approaches of analysis implemented in this paper. It renders the comprehensible understanding of required steps, which can be replicated for the new data. To achieve the purpose of this paper analysis are conducted using open-source software R and Microsoft Excel, which was purposefully chosen as one of the objectives of this study to enlighten the SMEs about the cheap alternatives for advanced clustering.
Figure 2 represents all the required steps to execute all analysis in this study. It initiates by retrieving data from the university account of Google Analytics such that it must have wrd-ID corresponding to extracted behaviours. wrd-wrd-ID is the anonymous user-wrd-ID which is generated when visitor first time visits the university website, and it is the only link which can integrate disparate database. Excel files with behavioural attributes are extracted multiple times from Google Analytics from Oct 2016 until July 2017, in a step of one month to get a high sampling rate (83.5%). After that, relevant behavioural features extracted from multiple CRM excel files of the University of Twente. Then, these two data sources integrated into one comprehensive file, followed by pre-processing of data set in suitable machine learning format by transforming the categorical variables into dummy variables.
3.4. Modelling Phase
In this phase, the researcher must select and execute the appropriate clustering algorithm. The volume of pre-possessed data is low volume as well as dimensionality (2327 entries and 11 behavioural dimensions), therefore, as accentuated by the proposed two-stage clustering framework in Chapter 2 section 2.9, complete linkage (hierarchical) clustering with hamming distance followed by K-modes is the optimal choice. There are two analyses conducted in this paper as mentioned before. Procedure and selected strategies for each analysis are demonstrated below. The first analysis is executed on All Master visitors to build the
Google Analytics
CRM
Integrated database
Pre-processed data Hierarchical clustering
K-modes
Cluster validation
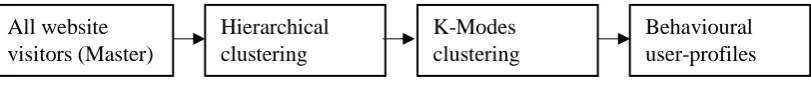
26 comprehensive view from the discovered profiles. The procedure for executing analysis is shown in Figure 3. The analysis is conducted by using implicit and explicit data with one-step a postpriori approach (refer to section 2.4 and 2.5). To achieve the desired purpose, i.e. behavioural profiling of Indian Master visitors, the researcher introduced the variable country. Therefore, one more analysis will be executed using the proposed framework and model in this paper.
Figure 4, represents the second analysis, conducted on Indian Master visitors, with implicit and explicit datasets along with a prioi- a postpriori approach.
The profiling results of the above two analysis are elaborated in terms of behaviour exhibited by each profile, which are presented in the next chapter. To assess the reliability of behavioural profiles, the results are validated by silhouette analysis.
3.4.1 Behavioural Attributes
The purpose of this study is to find behavioural profiles of Indian visitors who were interested in the master studies. Marketing and Communication department of the University of Twente acknowledge that some student initiates their application early. Therefore, it is necessary to motivate them until they finish the application submission. Behavioural patterns of prospective student help in predicting other behaviours which user can exhibit at later stage. Therefore, it will help marketing department to put forth advertisements strategically, which will compensate for the deficiency in knowledge/skill of the user, thus enhances user engagement and motivates them to submit the application dossier. Hence, application submission is the explanatory variable for this study.
The pre-processing of data generated numerous variables, which can indicate, what sort of online-behaviour influence the Indian prospects to submit the application dossier. There are ten behavioural features, which are extracted from pre-processed data which are list below and rest of the variables (country, continent, device type used and source) helps in further segmentation (micro-segmentation) to refine the targeting of advertisements.
All website visitors (Master)
Hierarchical clustering
K-Modes clustering
[image:26.595.96.502.201.244.2]Behavioural user-profiles
Figure 3: Demonstration of steps taken for first analysis
Indian website visitors (Master)
Hierarchical clustering
K-Modes clustering
Behavioural user-profiles
27 Osiris Application Submitted Education brochure request Question via web form
Managed CTA click Registration Open day Request student for a day
PDF download FAQs Eligibility check
Scholarship finder
28
4. Results
In this Chapter, the proposed framework for clustering of the categorical dataset and a model is implemented to analyse the behavioural profiles of the website visitors of the University of Twente. The outcome of the analysis is illustrated in the form of tables or figures. Furthermore, the discovered behavioural profiles of website visitors of the University of Twente who are interested in the master studies are described.
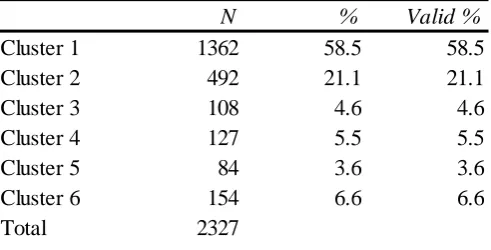
The pre-processed dataset has the behavioural attributes of 2327 users, who are keen in the master’s level of study. The range of behavioural attributes is one; this is because all categorical features are converted into binary features. Each binary feature has a minimum value of zero and the maximum value is one. The zero corresponds to the absence of a characteristic, and one corresponds to the presence of behavioural characteristic. There not much significance of minimum and maximum value in this descriptive statistics, besides it renders a warning if there is an error in data. Table 4 indicates that there is no irregularity in the dataset considering range, minimum and maximum values.
Dataset also contains four factors along which these behavioural attributes can be described more precisely, i.e. country, device type, program and source to the website (the origin of the website traffic, e.g. google.com). The mean of each behavioural attribute in Table 4 represents the frequency percentage of 2327 visitors dataset for instance approximately 28% went through managed CTA click, nearly 59% requested for education brochures, around 28% went through eligibility check, and roughly 3% went to frequently asked questions webpage which is nearly tantamount to 70 users.
Dolincar (2008) mentions that a number of variables that can be evaluated with a sample of a certain volume are limited and there is no particular rule for non-parametric techniques. However, a rule of thumb suggested by Formann (1984) renders some guidance: for the situation of the binary dataset, the minimum amount of observation must be 2k (K= number of variables), preferably 5*2k of observations. Since a number of behavioural attributes are 10, therefore, the number of observation as per minimum criteria is 1024 and as per the preferred 5120 criteria. Consequently, the size of data is voluminous enough to fulfil the
pre-N Range Minimum Maximum Mean
Managed_CTA_Display 2327 1 0 1 .81 Managed_CTA_Click 2327 1 0 1 .28
PDF_download 2327 1 0 1 .16
Scholarship_finder 2327 1 0 1 .11 Education_broucher_request 2327 1 0 1 .59 Registration_Open_Day 2327 1 0 1 .08
FAQs 2327 1 0 1 .03
Question via Webform 2327 1 0 1 .04 Request student for the day 2327 1 0 1 .09 Eligibility Check 2327 1 0 1 .28 Osiris_Application_Submitted 2327 1 0 1 .12 Valid N (listwise) 2327
Descriptive Statistics of pre-processed database
Behavioural Attributes