MASTER THESIS
HOW WOULD YOU TREAT YOUR
CUSTOMERS?
A starting point for the Social Richness Theory
M.S.J. Evertzen
August 31, 2018
FACULTY OF BEHAVIORAL, MANAGEMENT AND SOCIAL SCIENCES COMMUNICATION STUDIES CORPORATE AND ORGANIZATIONAL COMMUNICATION
EXAMINATION COMMITTEE
Dr. M. Galetzka
2
Pre-face
As a student with a background in Business Administration and currently studying Communication
Sci-ence I am interested in many domains. One of these has always been marketing. Therefore, the
combi-nation of marketing, communication, and B2B environments has been an obvious choice for this thesis.
This thesis is the final project for my Master Communication Studies at the University of Twente. Going
beyond the objective of graduating, this thesis adds to the B2B research field with the introduction of a
new theory. This theory could be used by managers to improve the interactions they have with their
customers.
This research could not have happened without the help of my graduating company Inextenzo, the
tele-com tele-company I where conducted my research (whom wishes to stay anonymous), and my supervisors
at the University of Twente: Dr. Mirjam Galetzka and Dr. Sjoerd de Vries.
I would like to start off with a thank-you to my supervisors. The hours of discussing my thesis with
Mirjam and Sjoerd must have been tiring, but they helped me move forward and design this study.
Without their help and feedback, this study would not have been a success.
Next, I would like to thank my colleagues at Inextenzo. They were very helpful by providing me with
feedback on my scenarios and the questionnaire. They helped professionalize the questionnaire and
sce-narios and provided a great deal of validity to this research.
Last, I would like to give my thanks to the telecom company I partnered with. The participants would
not have been recruited if the telecom company had not been there. They have hospitably let me into
their work space and helped my research. My thank goes out to them for their help, and of course also
to their customers who filled out my questionnaire.
Marloes Evertzen
August 31, 2018
3
ABSTRACT
OBJECTIVE Businesses have typically been interested in ideal ways to approach and interact with
customers. That is why this study proposes the “Social Richness Theory”. Prior research suggests
in-creasing so-called social richness in B2C customer interactions can boost customers’ overall evaluation
of the company and willingness to engage in word-of-mouth (WOM). It involves establishing rapport
and displaying personalization in customer-company interactions to increase the perceived quality of
these interactions. However, there is a lack of theories about service quality in B2B environments. It is
hypothesized that increasing social richness in B2B interactions also (directly) influences the overall
evaluation of the company and customers’ willingness to engage in WOM.
METHOD A 2x2 between subject experiment was set up by employing an online questionnaire
presenting four different scenarios of an e-mail exchange involving a service failure. Participants were
customers of a large telecom provider in the Netherlands (N = 81). 79% of respondents were male (n =
64), 21% was female (n = 17). Outcomes were measured by asking respondents about their perceived
interaction quality, their overall evaluation of the company, and their willingness to engage in WOM.
RESULTS Results indicate that including rapport elements in an e-mail conversation caused people
to be more inclined to engage in WOM and evaluate the company more favorably. However,
personal-ization worked negatively. People perceived the interaction as less valuably, evaluated the company less
favorably, and were less inclined to engage in WOM. One interaction effect was found. It indicated that
the willingness to share a message on social media decreases when rapport and personalization are
dis-played together.
CONTRIBUTION This research fills a gap in literature by researching rapport and personalization
in a B2B context through the introduction of the “Social Richness Theory”. This study provides a
start-ing point for said theory. Businesses can benefit from this research as it provides insights into the
effec-tiveness of rapport and personalization as factors to increase the social richness of their customer
inter-actions.
CONCLUSION While rapport is a useful factor to increase the social richness of a customer interaction,
personalization is ideally left out. Nevertheless, more research is needed to find other potential factors
increasing social richness and to expand the theory in general.
KEYWORDS
Rapport, personalization, B2B, social richness, perceived interaction quality, willingness to engage in
4
Table of contents
1. Introduction ... 7
2. Theoretical framework ... 9
2.1 Perceived quality of customer-company interaction ... 9
2.2. Rapport ... 10
2.2.1. Establishing rapport ... 11
2.3. Personalization ... 12
2.4. Overall evaluation of the company ... 14
2.5. Positive word-of-mouth engagement ... 14
3. Social Richness Model ... 16
4. Methodology ... 17
4.1. Procedure ... 17
4.2. Pre-test ... 17
4.3. Data collection ... 18
4.4. Method ... 18
4.4.1. Participants ... 18
4.4.2. Materials ... 19
5. Analysis ... 22
6. Results ... 24
6.1. Manipulation checks ... 24
6.2. Hypothesis testing ... 24
6.2.1. Interaction quality ... 26
6.2.2. Company evaluation ... 26
6.2.3. Willingness to engage in word-of-mouth ... 26
6.2.4. Willingness to share on social media ... 26
6.3. Mediation analysis ... 27
7. Conclusion ... 31
8. Discussion ... 32
8.1. Discussion of research results ... 34
8.2. Social richness theory ... 36
8.3. Limitations ... 36
8.3.1. Manipulation check results ... 36
8.3.2. Other limitations ... 37
8.4. Theoretical and practical implications ... 38
8.4.1. Theoretical implications ... 38
8.4.2. Practical implications ... 38
5 9. Overall conclusion ... 40
References ... 41
Appendices ... 46
A - Stimulus materials examples ... Fout! Bladwijzer niet gedefinieerd.
Condition 1: No rapport, no personalization ... Fout! Bladwijzer niet gedefinieerd.
Condition 2: No rapport, personalization ... Fout! Bladwijzer niet gedefinieerd.
Condition 3: Rapport, no personalization ... Fout! Bladwijzer niet gedefinieerd.
Condition 4: Rapport and personalization ... Fout! Bladwijzer niet gedefinieerd.
6
List of figures and tables
Table of Figures
Figure 1 – Overview of strategies to establish rapport (Gremler and Gwinner, 2008) ... 11
Figure 2 – Social Richness Model ... 16
Figure 3 – Example of stimulus materials ... 20
Figure 4 – Interaction effect of willingness to share on social media ... 27
Figure 5 – Mediation between PQI, Personalization, and CE ... 29
Figure 6 – Mediation between PQI, Personalization, and WOM ... 30
Figure 7 – Social Richness Model ... 32
Figure 8 – Revised Social Richness Model ... 34
List of tables Table 1 - Summary of the hypotheses ... 16
Table 2 – Overview of the experiment conditions ... 18
Table 3 – Overview of the constructs, items, and reliability (translated from Dutch) ... 22
Table 4 – Pearson’s correlations per construct ... 23
Table 5 – Manipulation check results ... 24
Table 6 - Results of the MANOVA and the univariate ANOVAs ... 25
Table 7 - Means and standard deviations for the willingness to share on social media ... 26
Table 8 – Univariate test of rapport and the willingness to share on social media ... 27
Table 9 – Mediation analysis results ... 28
Table 10 – Sobel’s Z test ... 28
Table 11 – Mediation analysis results ... 30
Table 12 – Sobel’s Z test ... 30
7
1. Introduction
All people deal with service frequently, whether good or bad. Good service is experienced when, for
example, the staff is friendly and knowledgeable, or go out of their way to satisfy a customer’s needs
(Parasuraman, Zeithaml, & Berry, 1985). More examples can be found in the extensive body of B2C
literature on the quality of service and how to measure it (e.g. Bitner, Booms, and Tetreault (1990),
Brady and Cronin Jr (2001), or Parasuraman, Zeithaml, and Berry (1988)).
This study adds to existing service literature by looking at a B2B environment in a service failure
con-text. Service quality or failure in combination with a B2B context has rarely been touched upon by
existing literature. However, research does suggest that service failure is an important reason for B2B
customers to switch suppliers (Naumann, Haverila, Sajid Khan, & Williams, 2010). When looking at
B2C contexts, service recovery strategies can have a positive impact on customer satisfaction (Ha &
Jang, 2009; Lastner, Folse, Mangus, & Fennell, 2016; Patterson, Cowley, & Prasongsukarn, 2006).
Whenever a service failure is recovered satisfactory, a customer displays higher levels of trust,
word-of-mouth, and loyalty than whenever a service is not recovered satisfactory. Dissatisfied customers are
more likely to engage in negative word-of mouth (Kau & Wan-Yiun Loh, 2006). Low, Lee, and Lian
(2013) concluded that interpersonal relationships between customer and company are important, as
strong ties increase the tolerance for service failure. All in all, there are many benefits when businesses
properly correct their mistakes and make sure to maintain service quality. That is why it is important to
research service quality and failure recovery in B2B environments as well.
This research specifically focusses on the interaction between customer and company and the perceived
quality of this interaction, as experienced by the customers. It takes the view that value is created in this
interaction. Research suggests that customer-employee relations can influence the evaluation of goods
and services in service environments (Gremler & Gwinner, 2000; Menon & O'Connor, 2007). The
per-ceived quality of the interaction is influenced by the “social richness” of the interaction. Social richness
is a new concept proposed in this study. It describes how “rich” a social interaction is. Another
widely-known theory that reflects upon richness is the Media Richness Theory (Daft & Lengel, 1986; Lengel
& Daft, 1989). However, where the Media Richness Theory describes the richness of a medium, the
“Social Richness Theory” analyzes the richness of an (electronic) customer-company interaction.
Addi-tionally, the Social Richness Theory focusses on electronic ways of interacting, which contrasts the
Media Richness Theory, as it diagnoses all types of communication, on- and offline. For this study, it is
important to reflect on the interaction and not the medium. That is why the Media Richness Theory is
regarded insufficient. Moreover, there is no overarching theory when it comes to interaction quality in
the B2B environment. That is why the Social Richness Theory is introduced.
In B2C contexts, “rapport” and “personalization” have shown effectiveness in the area of service quality
by improving customer satisfaction (Biedenbach, Bengtsson, & Wincent, 2011; Gremler & Gwinner,
8 (DeWitt & Brady, 2003; Worsfold, Worsfold, & Bradley, 2007). The friendly encounters customers
experience in B2C environments are often the results of rapport, personalization, or both. The employee
is establishing rapport with the customer by, e.g. illustrating what they know about a product, being
friendly or emphatic, or simply having an enjoyable conversation with a customer, going beyond the
objective of making a sale (Gremler & Gwinner, 2008). Examples of personalization can include
em-ployees remembering customers’ names, or talk about shared interests (Surprenant & Solomon, 1987).
Often, customers respond positively to rapport or personalization. That is why these two concepts are
explored as possible determinants for social richness.
This research hypothesizes that increasing social richness, in this case through establishing rapport and
displaying personalization, has positive effects on the perceived quality of the interaction a customer
has with a company. Additionally, rapport, personalization, and the perceived interaction quality could
influence customers’ overall evaluation of the company and their willingness to engage in positive
word-of-mouth. Insights into these relationships can be valuable for companies. However, little is known
about interactions in B2B environments. Therefore, the central research question of this study is:
“What is the influence of “social richness”, established through rapport and/or personalization, on the
perceived quality of customer-company interactions, customers’ overall company evaluation, and their
willingness to engage in positive word-of-mouth?”
The context of this study is a service failure of a large, Dutch telecom company. It takes a specific focus
by looking at the social richness of e-mail interactions between a customer that experiences a problem,
and a company that tries to solve that problem. This study is structured as follows: first, hypotheses to
support the main research question are formulated based on existing literature. This is followed by the
method section, explaining the research design and data collection. After that, results are presented
to-gether with statistical analyses of the manipulation of social richness through rapport and/or
personali-zation. The report ends with a conclusion, and a thorough discussion and reflection on the Social
Rich-ness Theory, as well as limitations, theoretical and practical implication, and suggestions for future
9
2. Theoretical framework
This chapter will introduce relevant concepts involving the Social Richness Theory. Additional
aca-demic literature is used to formulate the hypotheses. The hypotheses provide expectations regarding
rapport and personalization in interactions between customers and companies.
As mentioned in the introduction, rapport and personalization will be explored into further detail. It is
hypothesized that rapport and personalization influence customers’ overall evaluation of the company
and their willingness to engage in positive word-of-mouth. This influence could be direct, but it could
also be contingent on a customer’s perceived quality of the interaction. This chapter will first start with
a review of the perceived quality of the interaction.
2.1 Perceived quality of customer-company interaction
Increasing social richness in interactions could possibly increase the perceived quality of interactions.
However, the exact conceptualization of ‘interaction’ and ‘quality’ is still vague. This paragraph will
identify the meaning of the perceived quality of interactions by linking it to classic literature on service
quality.
B2C research suggests that it is beneficial to create value in interactions between customers and
com-pany, as it can influence the service quality perceptions of customers (Bitner, Booms, & Mohr, 1994;
Brady & Cronin Jr, 2001; Gremler & Gwinner, 2000; Menon & O'Connor, 2007). “Customers may
derive benefits not only from the core service provided by a firm, but also from the personal recognition
and social support resulting from their relationships with service staff” (p. 2498) (Worsfold et al., 2007).
Strong interpersonal relationships between customers and employees in service environments can lead
to more word-of-mouth engagement (Gremler, Gwinner, & Brown, 2001; Menon & O'Connor, 2007),
and every contact moment is an opportunity to create value for the customer (Menon & O'Connor, 2007),
which is beneficial for the company.
A customer can interact directly or indirectly with the company (Baxendale, Macdonald, & Wilson,
2015; Grönroos & Voima, 2013). As Grönroos and Voima (2013) state: “In direct interactions with the
customer, the firm may have an opportunity to engage with the customer’s value creation process and
take on the role of value co-creator.” (p. 141). For clarity, this research only considers contact wherein
the company is directly involved in the customer interaction. Indirect interactions, e.g. interaction with
a product or service at home, are not considered.
Now that is it clear what is meant by the ‘interaction’, it is necessary to also look at the ‘quality’
com-ponent of this concept. Parasuraman et al. (1988) have laid the foundation for service quality
determi-nants in their articles. When working on their service quality questionnaire, the SERVQUAL scale, they
10 1. “Tangibles: the physical facilities, equipment, and appearance of personnel.
2. Reliability: the ability to perform the promised service dependably and accurately.
3. Responsiveness: the willingness to help customers and provide prompt service.
4. Assurance: the knowledge and courtesy of employees and their ability to inspire trust and
con-fidence.
5. Empathy: the caring, individualized attention the firm provides its customers.”
For this research, only responsiveness, assurance, and empathy are relevant. Responsiveness is relevant,
since customers prefer to experience quick service. The other two dimensions, assurance and empathy,
contain elements that represent communication, credibility, courtesy, and understanding the customer
(Parasuraman et al., 1985, 1988), which are all important dimensions to keep in mind when researching
the perceived quality of the interaction. Responsiveness, assurance, and empathy are more closely
re-lated to the actual customer-company interaction than the other dimensions and could potentially
in-crease social richness when operationalized correctly. For this research, the dimension of tangibles is
irrelevant and the dimension involving reliability will be a given in the conversation used in the
experi-ment, as the problem will be solved satisfactory.
Taking the beforementioned and the insights from Parasuraman et al. (1988) together, one can conclude
that the perceived quality of the interaction between a customer and a company can be conceptualized
as follows: “the extent to which a customer experiences responsiveness, assurance, and empathy in an
interaction”.
2.2. Rapport
Rapport is interpreted differently among literature. For example, rapport can be understood as having a
‘click’ or ‘chemistry’ between two people (Gremler et al., 2001; Tickle-Degnen & Rosenthal, 1990).
LaBahn (1996) defined rapport as “the client’s perception that the personal relationships have the right
“chemistry” and are enjoyable” (p. 4). It can also be titled as “small talk” according to Hultgren (2011).
Furthermore, it is said that rapport is no personality trait, but something that exists between individuals
(Tickle-Degnen & Rosenthal, 1990). Rapport can help a company move forward in their relationship
with the customer (Campbell & Davis, 2006; Campbell, Davis, & Skinner, 2006). It also has a positive
influence on customer satisfaction and loyalty (Biedenbach et al., 2011; Gremler & Gwinner, 2008;
Worsfold et al., 2007). When employees genuinely want to help customers, there is a positive influence
on customer satisfaction (Keh, Ren, Hill, & Li, 2013). Customers can even experience social benefits
from their relationships with a company (Campbell et al., 2006; Kevin P. Gwinner, Gremler, & Bitner,
1998; Price & Arnould, 1999; Reynolds & Beatty, 1999). Finally, Hess, Ganesan, and Klein (2003)
found that relationships between the customer and employee can buffer negative effects of service
fail-ure. Worsfold et al. (2007) researched how rapport specifically influences customer attitudes towards
11 customer’s attitude. This finding was also supported by DeWitt and Brady (2003), who found that
rap-port can indeed buffer negative effects of service failures.
Further conceptualizing the concept of rapport, Gremler and Gwinner (2000) found that there are two
dimensions of rapport: (1) enjoyable interaction, and (2) personal connection. People have an enjoyable
interaction when they like each other (Gremler & Gwinner, 2000). Adding to this, Tickle-Degnen and
Rosenthal (1990) state that individuals exchange positivity and attractiveness cues if they are interested
or warmed by one another. An enjoyable interaction with an employee is brought about through
inter-personal interaction elements, such as language or by displaying positive emotions (Giebelhausen,
Robinson, Sirianni, & Brady, 2014; Gremler & Gwinner, 2000; Keh et al., 2013). People have a personal
connection when they bonded over something (Gremler & Gwinner, 2000; Gremler et al., 2001; Price
& Arnould, 1999). Tickle-Degnen and Rosenthal (1990) say that people are in harmony, or ‘in sync’.
When both an enjoyable interaction and a personal connection are present in the interactions, it has a
positive influence (Campbell et al., 2006) on, for example, word-of-mouth engagement (Gremler et al.,
2001).
Taking these insights into account, one can conceptualize rapport as follows: “the extent to which a
customer experiences an enjoyable interaction and personal connection during an interaction”. This
concept is operationalized through the rapport building behaviors mentioned below.
2.2.1. Establishing rapport
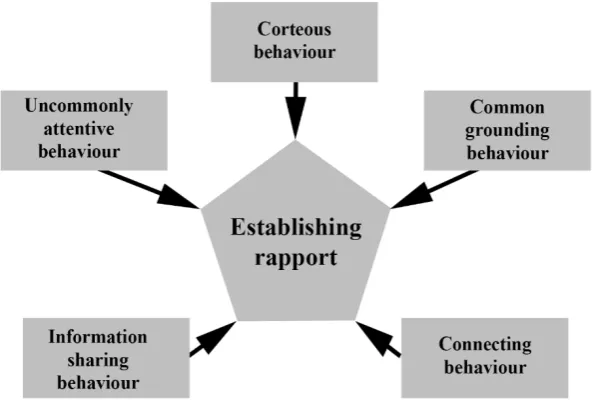
Rapport can be established by displaying several behaviors. These behaviors have been observed by
Gremler and Gwinner (2008) in their study on retail employees. To properly operationalize rapport,
[image:12.595.150.448.504.704.2]these behaviors are applied to the scenarios of the current study:
12 1. Uncommonly attentive behavior; an employee goes ‘above-and-beyond’ for the customer. This
category consists of atypical actions (going out of their way for a customer), personal
recogni-tion (knowing personal details about a customer, going beyond small talk), and intense personal
interest (employee is more concerned about the customer than making a sale). Campbell et al.
(2006) also emphasize that trust is important in forming a relationship with the customer.
2. Courteous behavior; the employee sees what he/she and the customer have in common. This
category consists of identifying mutual interests (identify common interests to keep the
conver-sation flowing) and finding other similarities (have smaller details in common, such as age).
Hultgren (2011) also mentions this in his observations of call-center employees.
3. Common grounding behavior; the employee demonstrates natural courteous behavior, as if it
was part of his/her personality. This category consists of unexpected honesty (the employee is
truthful and would even recommend another place than the own workplace), civility (the
em-ployee is helpful, pleasant, and friendly), empathy (the emem-ployee displays concern and care).
4. Connecting behavior; the employee wants to bond with the customer. This category consists of
using humor (making jokes), pleasant conversation (having an enjoyable conversation with the
customer), and friendly interaction (the employee is particularity friendly, or warm). Barrick et
al. (2012) mention this behavior too. They say that people connect by making light conversation,
e.g. about actualities or the weather.
5. Information sharing behavior; sharing or gathering information during an interaction. This
cat-egory consists of giving advice (making suggestions), imparting knowledge (the employee
demonstrates specialized knowledge and experience) and asking questions to understand
cus-tomer needs (help the employee gain a better understanding of his/her needs).
While this list includes five “clear-cut” examples of behavior, they almost never appear in isolation.
Often, two or more rapport behaviors are used together to be effective (Gremler & Gwinner, 2008).
As the quality of a service is influenced by dimensions such as responsiveness, assurance, and empathy
(Parasuraman et al., 1988), it is logical to propose that the perceived quality of a customer-company
interaction increases, when company representatives establish rapport in their interaction with the
cus-tomer. Therefore, the following hypothesis is tested:
H1: Establishing rapport increases the perceived quality of interactions, whereas not establishing
rap-port does not increase the perceived quality of interactions.
2.3. Personalization
Mittal and Lassar (1996) state that personalization is the social component of an interaction between a
customer and the company. The way employees speak to a customer can be different for each customer.
This is confirmed by Gwinner, Bitner, Brown, and Kumar (2005) who mention that knowledge about
13 advantages. For example, applying personalization in e-mails is beneficial to customer satisfaction
(Strauss & Hill, 2001). It was also found that personalization can positively influence patronage
deci-sions (Mittal & Lassar, 1996). K. P. Gwinner, Bitner, Brown, and Kumar (2005)
Surprenant and Solomon (1987) identified personalization when it comes to customer services. They
found that displaying personalization in interactions can have beneficial effects on customer satisfaction
and loyalty. In their analysis, they link service quality dimensions, as researched by Parasuraman et al.
(1985), to the delivery of service. These involve the dimension of courtesy, communication, credibility,
and understanding. These subdimensions are captured in the SERVQUAL dimensions of assurance and
empathy (Parasuraman et al., 1988) and can be linked to rapport and social richness.
Surprenant and Solomon (1987) mention programmed and customized personalization in their study. In
these types of personalization, one presents customers with the impression of a service tailored to them
personally by using information about that customer, e.g. demographic information or specific needs
and wants (Surprenant & Solomon, 1987). White, Zahay, Thorbjonsen, and Shavitt (2008) also mention
this as a way of personalizing messages in advertising. They state that companies could use personal
information, such as demographic information or preferences and interests, to add a more individualized
touch to the message. The more personal information used in the message, the more it is distinctively
personalized to that person. While this type of strategy does not work well for simple services, it
per-forms in a difficult setting. Therefore, it might be a useful strategy to explore when there is a service
failure.
Taking all these insights together, personalization in an interaction can be conceptualized as: “the extent
to which the customer feels the conversation is addressed to them personally”.
Seeing how personalization can have positive effects for companies, it is logical to assume that
display-ing personalization in interactions can contribute to social richness and with that increase the perceived
quality of interactions. Therefore:
H2: Displaying personalization increases the perceived quality of interactions, whereas not displaying
personalization does not increase the perceived quality of interactions.
While personalization is not the same as rapport, the two concepts are closely interrelated.
Personaliza-tion can seamlessly blend into the Social Richness Theory alongside rapport. Rapport and
personaliza-tion are means to the same end. Displaying the behaviors equals trying to influence certain outcomes,
such as the willingness to engage in word of mouth or the overall evaluation of the company. The
dif-ference between the two factors lies in the way they achieve these goals. Rapport could be applied to
customers in general: one could speak about the nice weather to anyone. However, comments about a
customer’s hobbies cannot be used in all conversations. Where rapport stops, personalization goes on,
14 is enjoyable, and if it is not enjoyable it could result in friction. The two concepts together enrich the
interaction even more. Because this statement has not been researched by other authors, it lays ground
for an additional hypothesis. Therefore:
H3: A combination of rapport and personalization increases a customer’s perceived quality of
interac-tion.
2.4. Overall evaluation of the company
According to Kardes, Cline, and Cronley (2011), an attitude is an “evaluative judgement, or rating of
how good or bad, favorable or unfavorable, or pleasant or unpleasant consumers find a particular
person, or issue” (p. 164). Since favorable attitudes can lead to purchase of a brand, companies know
consumer attitudes are important (Kardes et al., 2011), especially in a context where a service fails.
Taking these insights together, one can conclude that, in this study, the overall evaluation of the
com-pany can be summarized as: “the attitude a customer has of the company, after experiencing an
inter-action with it”.
Favorable attitudes can be traced back through many factors, such as customer loyalty. Customer loyalty
is a difficult concept that needs to be looked at from different points of view. Hennig-Thurau, Gwinner,
and Gremler (2002) define customer loyalty as “customer’s repeat purchase behavior that is triggered
by a marketer’s activities” (p. 231). Loyalty in turn results from customer satisfaction (Gronholdt,
Martensen, & Kristensen, 2000; Hallowell, 1996). When customers are satisfied, they often have
favor-able attitudes about a company. Research indicated that service recovery strategies can positively
influ-ence a customer’s satisfaction with the company patronize intentions (Smith & Bolton, 1998). However,
a customer’s state of mind, his or her mood, the involvement, and many other factors can influence one’s
attitudes of a company or product as well (Kardes et al., 2011). That is why it is relevant to research
whether social richness could positively influence a customer’s attitude. Therefore:
H4: Increasing social richness by (a) establishing rapport, and/or (b) displaying personalization
di-rectly positively influences the overall evaluation of the company.
H5: The effect of (a) rapport or (b) personalization and the overall evaluation of the company is
medi-ated by the perceived quality of interaction.
2.5. Positive word-of-mouth engagement
Word-of-mouth lives alongside customer attitudes. When customers do not think favorably about a
com-pany, they will not engage in word-of-mouth (Kardes et al., 2011). Positive word-of-mouth
communi-cation is defined as the informal communicommuni-cations between customers about the evaluation of goods and
services. These evaluations are about pleasant, vivid, or novel experiences, displaying the product, and
about recommending the product to others (Hennig-Thurau et al., 2002). Customers engaging in
word-of-mouth display true affection towards the company (Ranaweera & Prabhu, 2003). There is no
15 Word-of-mouth works because people consider it to be authentic and genuine. When a recommendation
comes from a friend or colleague, people are more inclined to believe it than when it comes from a
stranger or (celebrity) endorser (Kardes et al., 2011; Wirtz & Chew, 2002). Adding to this, people prefer
genuine word-of-mouth as opposed to word-of-mouth sparked by a monetary compensation (Van Hoye
et al., 2016).
Taking all these insights together, one can conclude that positive word-of-mouth engagement is
im-portant for companies. It can be conceptualized as follows: “the extent to which customers are willing
to share something positive about the company and/or interaction”.
Word-of-mouth influences brand consideration (Baxendale et al., 2015) and buying intentions of the
reader or listener (Baker, Donthu, & Kumar, 2016; Berger, 2014; Cheung & Thadani, 2012; Chevalier
& Mayzlin, 2006; Hennig-Thurau, Walsh, & Walsh, 2003). Word-of-mouth specifically engaged in
through online channels is also important and effective for companies (Li & Du, 2017; Tsao, Hsieh,
Shih, & Lin, 2015; Zhang, Zhao, & Gupta, 2018) as it could have similar benefits as offline
word-of-mouth. Satisfied customers engage more in word-of-mouth (Brown, Barry, Dacin, & Gunst, 2005; Dick
& Basu, 1994; Mohtasham, Sarollahi, & Hamirazavi, 2017; Ranaweera & Prabhu, 2003). Going beyond
customer expectations to positively influence word-of-mouth engagement is important and valuable for
businesses (Mohtasham et al., 2017; Popp & Woratschek, 2017).
It is assumed that customers are more willing to engage in positive word-of-mouth when they perceive
the interaction to be more valuable. However, it could also be the case that social richness directly
in-fluences word-of-mouth engagement. Therefore:
H6: Increasing social richness by (a) establishing rapport, and/or (b) displaying personalization
di-rectly positively influences the willingness to engage in word-of-mouth.
H7: The effect of (a) rapport or (b) personalization and the willingness to engage in word-of-mouth is
16
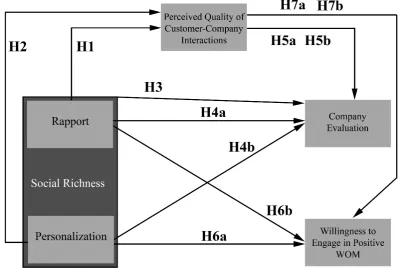
3. Social Richness Model
The beforementioned theory and hypotheses form the basis for the “Social Richness Model”:
Overview of hypotheses
Table 1 - Summary of the hypotheses
Hypothesis and description
H1 Establishing rapport increases the perceived quality of interactions
H2 Displaying personalization increases the perceived quality of interactions.
H3 A combination of rapport and personalization increases the perceived quality of interactions.
H4a Increasing social richness by establishing rapport directly positively influences the overall
evaluation of the company.
H4b Increasing social richness by displaying personalization directly positively influences the overall
evaluation of the company.
H5a The relationship between rapport and the overall evaluation of the company is
mediated by the perceived quality of interaction.
H5b The relationship between personalization and the overall evaluation of the company is mediated by
the perceived quality of interaction.
H6a Increasing social richness by establishing rapport directly positively influences the willingness to
engage in WOM.
H6b Increasing social richness by displaying personalization directly positively influences the willingness
to engage in WOM.
H7a The relationship between rapport and the willingness to engage in word-of-mouth is mediated by the
perceived quality of interaction.
H7b The relationship between personalization and the willingness to engage in
[image:17.595.98.501.117.385.2]word-of-mouth is mediated by the perceived quality of interaction.
17
4. Methodology
In this research the effects of rapport and personalization on perceived interaction quality, overall
com-pany evaluation, and willingness to engage in word-of-mouth are examined with a 2x2 between subject
experiment. Scenarios were used to simulate the interaction between the customer and the company.
The use of scenarios has been frequently used in service and word-of-mouth research (e.g. Hess et al.
(2003), Wentzel, Tomczak, and Henkel (2014), Cheema and Kaikati (2010), or Wirtz, Orsingher, Chew,
and Tambyah (2013)). Advantages hereof include completely controlled conditions and easy
manipula-tion, keeping the experiment clean. It also provides a standardized setting for each participant. Adding
to this, if participants were to be put into a real-life case, with them being unaware of the experiment,
the study might withhold them an interaction in which proper customer service and kind conversation
reflect. This is considered unethical. The data was collected via an online questionnaire, which are
fre-quently used and easy to administer methods in social research (Babbie, 2013; Kardes et al., 2011).
4.1. Procedure
Rapport and personalization are reflected in the ways the conversation is structured. The scenarios
dis-play a mock-up e-mail conversation regarding a telecom problem to test the manipulations (See Figure
3 on page 20). The scenarios are based on a real-life situation: a problem with the internet or phone
connection. They were pre-tested by discussing them with marketing- and telecom professionals to test
the realism of the scenario and script. For the participants, sessions took approximately 5 to 10 minutes.
The procedure is as follows:
1. Participants read an informed consent message.
2. If they consented, they were randomly assigned to one of the four conditions.
3. An introductory text explaining the procedure was presented.
4. Participants filled out demographic questions.
5. Participants read through the text in the scenarios.
6. Participants filled out the questionnaire.
7. Participants were thanked for their participation, signifying the end of the questionnaire.
4.2. Pre-test
A pre-test is a valuable method to determine if a questionnaire and/or stimulus materials can be
ade-quately used for the experiment (Hinkin, Tracey, & Enz, 1997). For this research, the objective of the
pre-test was three-fold. It (1) checked whether the chosen scenario was realistic, (2) made sure there
were no unclarities in the scenarios and/or questions, and (3) made sure other incongruencies were
fil-tered out before sending out the final questionnaire to the actual participants. The validity of the study
was assessed in a two-stage pre-test. First, the scenario was consulted with marketing professionals and
representatives of the telecom company. This ensured the scenarios were realistic and relatable for the
participants. Second, pre-testers were recruited to read through the final scenario and fill out the
18 The pre-test questionnaire yielded 40 responses. Of these 40 responses, six were not useful as these
people did not consent or finish the whole questionnaire (n = 34). The pre-test contained additional open
questions, so participants could type out exactly what was unclear or wrong about the questionnaire as
it was at that time. For example, questions like “Did you understand everything in this scenario, and if
no, what did you not understand?”, or “Was there anything unusual you noticed about this
question-naire?” were included.
After additional consulting with the telecom company, the service failure involving the connection
prob-lem was titled most realistic. This scenario was chosen since the is one of the most frequently occurring
problems customers experience, according to the company. That way, it was ensured that the participants
would be able to relate to the scenario, ensuring realism and reliability.
4.3. Data collection
Data for the final questionnaire was collected through an anonymized survey made in Qualtrics. A
con-scious decision was made to only e-mail and call people that were linked to one telecom company.
Because of the explorative nature of this study, it is desired to keep the type of industry constant. This
was achieved through this variant of purposeful sampling. The questionnaire was distributed and
avail-able via e-mail to customers of the telecom company from May 14 to 28, 2018. A sample of 489 Dutch
customers and partners of the company was e-mailed the link of the survey. Through a two-step
ap-proach of e-mailing followed up with telephone call, the survey yielded 123 responses. 42 of them were
invalid because the participant did not answer “yes” to the informed consent question, did not finish the
questionnaire, or something went wrong in any other way. In total, the survey yielded 81 valid responses.
4.4. Method
4.4.1. Participants
The participants (n = 81) were all connected to the telecom provider through their services. These
ser-vices are delivered to businesses and not end-customers. Participants either receive internet or telephone
from the company or are partners of the company. 19 participants are a partner of the company, 33 get
their telephone connection from the company, and 29 get their internet from the company. 64
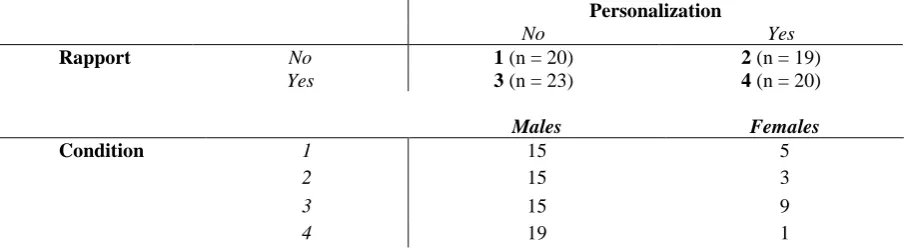
[image:19.595.72.526.630.755.2]partici-pants were male and 17 were female (see Table 2), a large share of them was aged between 36 and 55.
Table 2 – Overview of the experiment conditions
Personalization
No Yes
Rapport No 1 (n = 20) 2 (n = 19)
Yes 3 (n = 23) 4 (n = 20)
Males Females
Condition 1 15 5
2 15 3
3 15 9
19 4.4.2. Materials
Scenarios: A scenario describing a telecom connection problem was written up. It involved a
customer e-mailing the company and informing there is a problem with their internet or phone
connec-tion. The company responds, and the problem is solved in a total of five e-mailed messages back and
forth. Minimal changes in the script were made to fit the type of customer (receiving phone or internet)
that participated, but the overall storyline was the same. It is assumed participants can envision
them-selves in the scenario, since they all have experience in the B2B environment, and a problem with their
telephone or internet connections are situations that frequently occur in business, as well as their
per-sonal life. They were written in Dutch, as the telecom provider only has Dutch customers. All
partici-pants got into a conversation with a fictional man: Jan de Vries, the company representative of their
telecom company. The scenarios were all identical, except for the manipulation of the independent
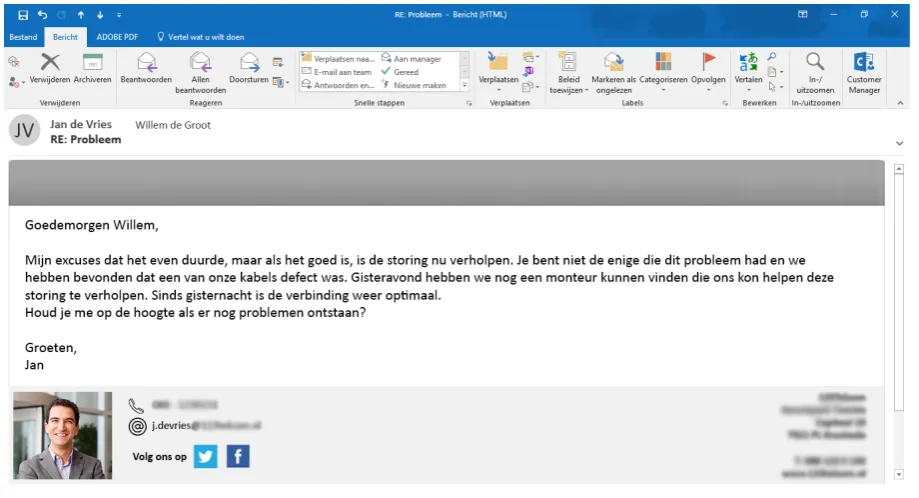
var-iables. An example can be seen in Figure 3.
Independent variables: Participants imagined they were a customer of a telecom company. They
had e-mailed the company because they had a problem with their telephone or internet connection. In
two of the scenarios, the company representative established rapport in building the conversation. In this
case, the company representative demonstrated empathy and compassion for the problem, apologized
for the inconvenience, provided more transparency when talking about the problem, and the
conversa-tion followed a friendly narrative. To be able to correctly measure the concepts menconversa-tioned in the Social
Richness Model (Figure 2), the operationalization for establishing rapport was drawn from the
previ-ously mentioned list of rapport building behaviors. (Barrick et al., 2012; Campbell et al., 2006; Gremler
& Gwinner, 2008; Hultgren, 2011). In the other two scenarios, personalization was displayed in the
conversation. Personalization is operationalized by calling the customer by his/her name, instead of just
using general pronouns (sir/madam) and paying extra attention to the needs or problem the customer
proposes. The company representative addressed the customer by his/her name and spoke about an
un-related matter in the end: an event they will both visit. Personalization was also displayed by having
“Jan de Vries” as the recipient, instead of “Customer Service”. Finally, a picture of Jan was provided in
the bottom left-hand corner (See Figure 3). This would provide the conversation with a more
individu-alized and knowledgeable touch. These behaviors are in line with the strategies from the article of
Surprenant and Solomon (1987) and White et al. (2008). The condition without any rapport or
person-alization was short and concise. No friendly tone was used, just a business-like tone, and no picture was
used to have customers identify with. In all four conditions, a Microsoft Outlook format was used as a
20 Figure 3 – Example of stimulus materials
* Blurred out words were visible for the participants, this is an anonymized version.
Rapport and personalization were manipulated as follows, the first sentence shows condition 1, which
displays neither of the two, the second sentence shows condition 4, which displays both rapport and
personalization. The messages were translated from Dutch to English. The overall message of the two
sentences is the same:
“Dear Madam,
We have resolved the problem and hope your
problem is hereby solved.
Yours sincerely,
Jan de Vries”
Good morning Hannah,
My apologies it took a whole, but if I am correct,
the disturbance is now fixed. You were not the
only one experiencing this problem and we have
found one of our cables to be broken. Yesterday
evening, we found a mechanic that could solve
the problem for is. Since last night, the
connec-tion should have been optimal again.
Will you let me when you still experience any
problems?
Kind regards,
21 Dependent variables: The dependent variables were measured using adaptations of existing
scales, completed with additional questions. The perceived quality of the interaction and the overall
evaluation of the company were measured by items based on SERVQUAL items, by Parasuraman et al.
(1988) and adjustments on SERVQUAL from Brady and Cronin Jr (2001). The construct “perceived
quality of interactions” was build up using questions measuring assurance, responsiveness, and empathy.
Sample items are: “Overall, I would say the quality of my interaction with John Carpenter is excellent”,
“I receive quick service from Jan de Vries”, or “I thought this conversation was sincere”. Willingness
to engage in word-of-mouth was measured by different items. A sample item is: “I would recommend
this company to others”. Overall evaluation of the company was measured with other items. A sample
items is: “I am satisfied with TelecomX”. Responses to all questions were rated on a 7-point Likert scale
ranging from 1 (strongly disagree) to 7 (strongly agree). The complete list of measurement items, in
Dutch, can be found in the Appendix.
Manipulation checks: The manipulation of all independent variables was checked using
multi-item scales. They were also measured on 7-point Likert scales with the same scale points. Rapport was
tested with a number of questions adopted from the rapport behaviors described by Gremler and
Gwinner (2008), for example: “Jan de Vries was friendly”. Questions involving the personalization
var-iable were developed for this study, such as: “I thought this interaction was personal”. The complete
list of measurement items, in Dutch, can be found in the Appendix. An overview in English can also be
22
5. Analysis
Principal component analyses with varimax and reliability measures were used to determine whether
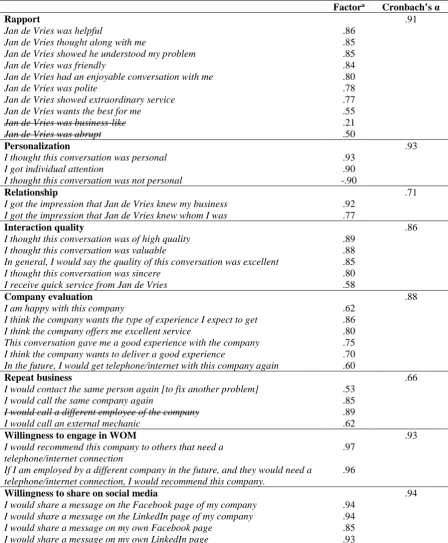
the measurement items corresponded with the constructs they were in. Table 3 provides an overview
[image:23.595.72.521.182.726.2]of the found values.
Table 3 – Overview of the constructs, items, and reliability (translated from Dutch)
Factora Cronbach’s α
Rapport .91
Jan de Vries was helpful .86
Jan de Vries thought along with me .85
Jan de Vries showed he understood my problem .85
Jan de Vries was friendly .84
Jan de Vries had an enjoyable conversation with me .80
Jan de Vries was polite .78
Jan de Vries showed extraordinary service .77
Jan de Vries wants the best for me .55
Jan de Vries was business-like .21
Jan de Vries was abrupt .50
Personalization .93
I thought this conversation was personal .93
I got individual attention .90
I thought this conversation was not personal -.90
Relationship .71
I got the impression that Jan de Vries knew my business .92
I got the impression that Jan de Vries knew whom I was .77
Interaction quality .86
I thought this conversation was of high quality .89
I thought this conversation was valuable .88
In general, I would say the quality of this conversation was excellent .85
I thought this conversation was sincere .80
I receive quick service from Jan de Vries .58
Company evaluation .88
I am happy with this company .62
I think the company wants the type of experience I expect to get .86
I think the company offers me excellent service .80
This conversation gave me a good experience with the company .75
I think the company wants to deliver a good experience .70
In the future, I would get telephone/internet with this company again .60
Repeat business .66
I would contact the same person again [to fix another problem] .53
I would call the same company again .85
I would call a different employee of the company .89
I would call an external mechanic .62
Willingness to engage in WOM .93
I would recommend this company to others that need a telephone/internet connection
.97
If I am employed by a different company in the future, and they would need a telephone/internet connection, I would recommend this company.
.96
Willingness to share on social media .94
I would share a message on the Facebook page of my company .94
I would share a message on the LinkedIn page of my company .94
I would share a message on my own Facebook page .85
I would share a message on my own LinkedIn page .93
23 The factor analysis resulted in the values that can be found in Table 3. The following constructs were
formed:
• Rapport: stayed the same (α = .91).
• Personalization: split into ‘Personalization’ (α = .93) and ‘Relationship’ (α = .71).
• Interaction quality: stayed the same (α = .86).
• Company evaluation: split into ‘Company Evaluation’ (α = .88) and ‘Repeat Business’ (α =
.66).
• Willingness to engage in WOM: split into ‘Willingness to engage in WOM’ (α = .93) and ‘Willingness to share on social media’ (α = .94).
All the items that were based on the SERVQUAL-scale questions ended up in the same construct.
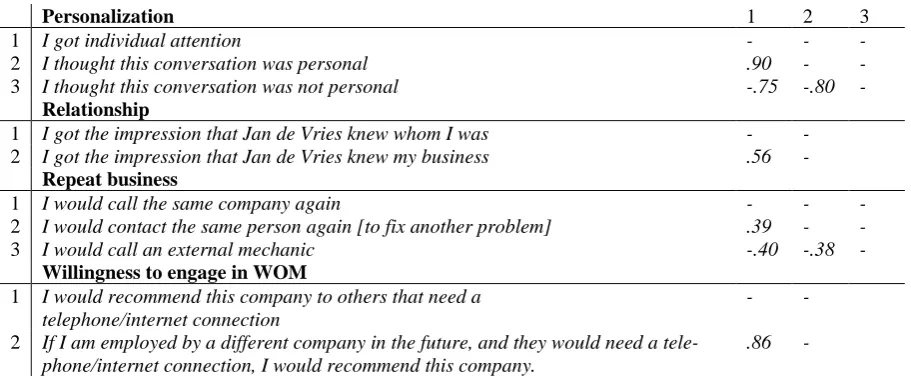
After dividing these variables and forming new constructs, reliability analysis on the scales was
per-formed. For constructs that existed out of 2 or 3 items, a correlation check was performed to strengthen
the analysis. For constructs with two items, the correlation was checked. For constructs with three items,
the intercorrelations were checked (see Table 4). All constructs were significant on the 0.01 level
[image:24.595.71.527.412.605.2](2-tailed).
Table 4 – Pearson’s correlations per construct
Personalization 1 2 3
1 I got individual attention - - -
2 I thought this conversation was personal .90 - -
3 I thought this conversation was not personal -.75 -.80 -
Relationship
1 I got the impression that Jan de Vries knew whom I was - -
2 I got the impression that Jan de Vries knew my business .56 -
Repeat business
1 I would call the same company again - - -
2 I would contact the same person again [to fix another problem] .39 - -
3 I would call an external mechanic -.40 -.38 -
Willingness to engage in WOM
1 I would recommend this company to others that need a
telephone/internet connection
- -
2 If I am employed by a different company in the future, and they would need a
tele-phone/internet connection, I would recommend this company.
.86 -
The scale for Repeat Business scored a Cronbach’s α of .66, and additional correlation analysis was significant. Therefore, nothing was changed about this scale. The Relationship scale scored a .71 α and was significantly correlated. The other scales were all good or excellently reliable with the lowest score
24
6. Results
This section presents the analysis of the results and with that explanations for the hypotheses. It starts
with a manipulation check, continues with MANOVA and ANOVA analyses, and ends with mediation
analyses.
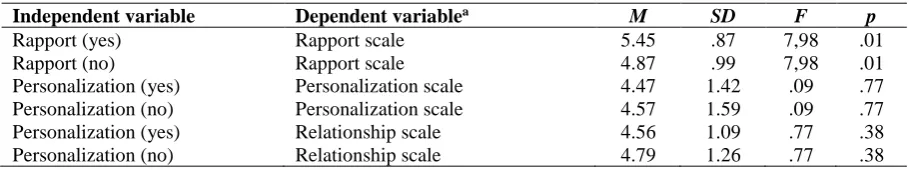
6.1. Manipulation checks
To check for manipulations, questions measuring the amount of rapport and personalization were asked
in the questionnaire. Three univariate ANOVAs were conducted to check whether the presence of
rap-port and/or personalization in the conditions caused people to score higher on the raprap-port and
[image:25.595.70.525.272.357.2]personal-ization questions respectively, Table 5 provides an overview.
Table 5 – Manipulation check results
Independent variable Dependent variablea M SD F p
Rapport (yes) Rapport scale 5.45 .87 7,98 .01
Rapport (no) Rapport scale 4.87 .99 7,98 .01
Personalization (yes) Personalization scale 4.47 1.42 .09 .77
Personalization (no) Personalization scale 4.57 1.59 .09 .77
Personalization (yes) Relationship scale 4.56 1.09 .77 .38
Personalization (no) Relationship scale 4.79 1.26 .77 .38
a. degrees of freedom = 79
The analysis for rapport demonstrates a main effect of rapport on the rapport manipulation scale, F(1,79)
= 7.98, p < .01. As can be seen in Table 5, rapport is experienced more in the rapport conditions (M =
5.45; SD = .86), than in the conditions rapport is not present (M = 4.87; SD = .99).
The analysis for personalization does not demonstrate a main effect of personalization on the
personal-ization scale, F(1,79) = .088, p = .77. It also does not reveal a main effect of personalization on the
relationship scale, F(1,79) = .769, p = .38. To check for individual manipulations per item, a separate
analysis was done per question. However, none of these checks turned out to be significant. This means
the manipulation check did not work the way it was supposed to work. Nevertheless, analyses are
con-tinued, because of the promising results of rapport. This point is reflected upon in the discussion.
6.2. Hypothesis testing
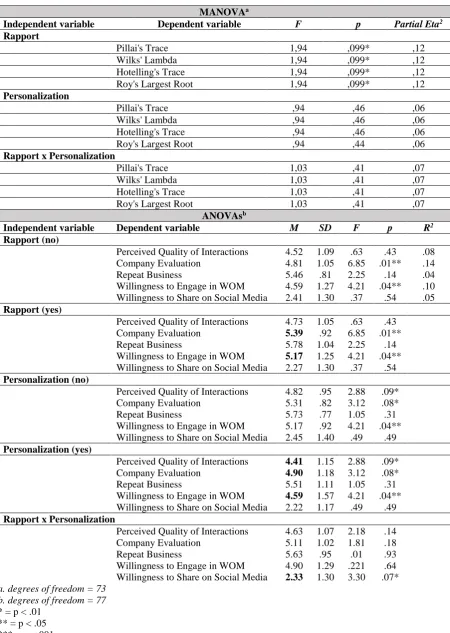
The analyses were started with a multivariate ANOVA, to see whether the results were significant.
However, only the influence of rapport revealed to be marginally significant F(1,77) = 1.94, p < .10
(see Table 6). Nevertheless, analyses for the other constructs was conducted using univariate ANOVAs,
because rapport revealed a promising result. In univariate analysis, three significant (0.01 < p < 0.05)
25 Table 6 - Results of the MANOVA and the univariate ANOVAs
MANOVAa
Independent variable Dependent variable F p Partial Eta2
Rapport
Pillai's Trace 1,94 ,099* ,12
Wilks' Lambda 1,94 ,099* ,12
Hotelling's Trace 1,94 ,099* ,12
Roy's Largest Root 1,94 ,099* ,12
Personalization
Pillai's Trace ,94 ,46 ,06
Wilks' Lambda ,94 ,46 ,06
Hotelling's Trace ,94 ,46 ,06
Roy's Largest Root ,94 ,44 ,06
Rapport x Personalization
Pillai's Trace 1,03 ,41 ,07
Wilks' Lambda 1,03 ,41 ,07
Hotelling's Trace 1,03 ,41 ,07
Roy's Largest Root 1,03 ,41 ,07
ANOVAsb
Independent variable Dependent variable M SD F p R2
Rapport (no)
Perceived Quality of Interactions 4.52 1.09 .63 .43 .08
Company Evaluation 4.81 1.05 6.85 .01** .14
Repeat Business 5.46 .81 2.25 .14 .04
Willingness to Engage in WOM 4.59 1.27 4.21 .04** .10
Willingness to Share on Social Media 2.41 1.30 .37 .54 .05
Rapport (yes)
Perceived Quality of Interactions 4.73 1.05 .63 .43
Company Evaluation 5.39 .92 6.85 .01**
Repeat Business 5.78 1.04 2.25 .14
Willingness to Engage in WOM 5.17 1.25 4.21 .04**
Willingness to Share on Social Media 2.27 1.30 .37 .54
Personalization (no)
Perceived Quality of Interactions 4.82 .95 2.88 .09*
Company Evaluation 5.31 .82 3.12 .08*
Repeat Business 5.73 .77 1.05 .31
Willingness to Engage in WOM 5.17 .92 4.21 .04**
Willingness to Share on Social Media 2.45 1.40 .49 .49
Personalization (yes)
Perceived Quality of Interactions 4.41 1.15 2.88 .09*
Company Evaluation 4.90 1.18 3.12 .08*
Repeat Business 5.51 1.11 1.05 .31
Willingness to Engage in WOM 4.59 1.57 4.21 .04**
Willingness to Share on Social Media 2.22 1.17 .49 .49
Rapport x Personalization
Perceived Quality of Interactions 4.63 1.07 2.18 .14
Company Evaluation 5.11 1.02 1.81 .18
Repeat Business 5.63 .95 .01 .93
Willingness to Engage in WOM 4.90 1.29 .221 .64
Willingness to Share on Social Media 2.33 1.30 3.30 .07*
a. degrees of freedom = 73 b. degrees of freedom = 77
26 6.2.1. Interaction quality
It was found that personalization had a marginally significant negative effect on the interaction quality
(M = 4.41; SD = 1.15), F(1,77) = 2.88, p = .09 (see Table 6). This means that participants judged the
interaction as less valuable when they were in a condition that displayed personalization.
6.2.2. Company evaluation
It was found that rapport has a direct significant effect on company evaluation (M = 5.39; SD = .92),
F(1,77) = 6.85, p= .01 (see Table 6). This means that the company was in general more favorably
judged when rapport was established in the scenario these participants were in.
It was also found that personalization had a direct marginally significant negative effect on company
evaluation (M = 4.90; SD = 1.18), F(1,77) = 3.12, p = .08 (see Table 6). This means that participants
in general judged the company less favorably when they were in a condition that displayed
personaliza-tion.
6.2.3. Willingness to engage in word-of-mouth
It was found that both rapport and personalization have a direct significant effect on the willingness to
engage in word-of-mouth. The following values were found for rapport (M = 5.17; SD = 1.27), F(1,77)
= 4.21, p = .04 (see Table 6). Establishing rapport does result in overall higher ratings. The following
values were found for personalization (M = 4.59; SD = 1.57), F(1,77) = 4.21, p = .04 (see Table 6).
This means that personalization negatively affects the willingness to engage in positive word-of-mouth.
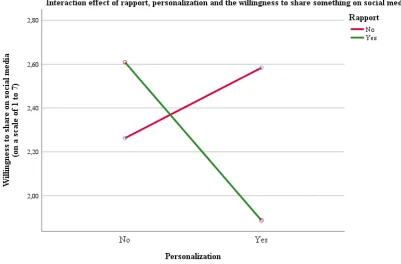
6.2.4. Willingness to share on social media
Lastly, it was found that there was a direct marginally significant interaction effect on the willingness
to share on social media F(1,77) = 3.30, p = .07 (see Table 6). In the condition in which rapport is
present, but personalization is not, the following values were found: M = 2.61; SD = 1.43. The condition
in which both personalization and rapport are present scores differently: M = 1.89; SD = 1.05. This
shows that the willingness decreases when both the factors are displayed. When performing a univariate
test on rapport, personalization, and the willingness to share on social media, this effect can be found in
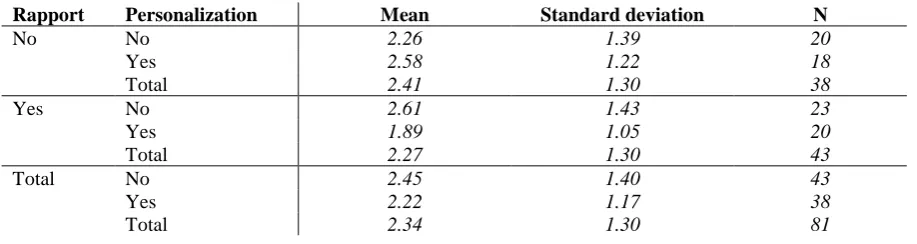
[image:27.595.70.529.615.737.2]the rapport variable, as can be seen in Table 7 and 8.
Table 7 - Means and standard deviations for the willingness to share on social media
Rapport Personalization Mean Standard deviation N
No No 2.26 1.39 20
Yes 2.58 1.22 18
Total 2.41 1.30 38
Yes No 2.61 1.43 23
Yes 1.89 1.05 20
Total 2.27 1.30 43
Total No 2.45 1.40 43
Yes 2.22 1.17 38
27 Table 8 – Univariate test of rapport and the willingness to share on social media
Rapport Sum of
squaresa
Degrees of Freedom
Mean2 F Significance Partial Eta2
No .98 1 .98 .59 .45 .01
Yes 5.56 1 5.56 3.36 .07 .04
Each F tests the simple effects of personalization within each level combination of the other effects shown. These
tests are based on the linearly independent pairwise comparisons among the estimated marginal means.
a. df = 77
This means that the willingness to share on social media decreases whenever rapport and personalization
are displayed together (see Figure 4).
Figure 4 – Interaction effect of willingness to share on social media
6.3. Mediation analysis
To test whether the Perceived Quality of Interaction (PQI) mediated the overall evaluation of the
com-pany and the willingness to engage in word-of-mouth, as hypothesized, additional analyses were done
with the SPSS extension PROCESS. Additional linear regression analyses were performed to check the
found significance.
Perceived quality of interaction and overall company evaluation
Rapport
When looking specifically at rapport as the independent variable, mediation analyses revealed that
[image:28.595.93.495.255.519.2]28 Therefore, the perceived quality of interaction does not mediate the relationship between rapport and
the overall evaluation of the company.
Personalization
When looking at personalization as the independent variable, other results came up with the PROCESS
analysis. It illustrated that Personalization is a marginally significant predictor of PQI (p = .08). It was
also found that personalization is a marginally significant predictor for CE (p = .08). Adding to this,
P|PQI is significant predictor of CE (p = .00). However, the reverse relationship, PQI|P is not significant,
meaning the effect of the independent variable, Personalization, is no longer significant in the presence
of a mediating variable. This confirms the full mediating effect of perceived quality of interaction on
the relationship of personalization and company evaluation. In this case, the effect size of the mediator is -.29, with a 95% confidence interval; meaning the effect was significantly greater than zero at α = .05. A Sobel test also confirmed the mediation. The results of the PROCESS and regression analyses can be
[image:29.595.72.527.356.417.2]found in Tables 9 and 10:
Table 9 – Mediation analysis results
Path β (Unstandardized) σ β (Standardized) Significance
C (Pers. to CE) -.40 .22 -.20 0.08
A (Pers. to PQI) -.42 .23 -.20 0.08
B (PQI to CE) .69 .08 .72 0.00
Cx(Pers. to CE) -.11 .16 -.06 0.48
Table 10 – Sobel’s Z test
Test Value σ Significance
-1.75 0.16 0.08
Figure 5 illustrates how the mediation works, the paths from Table 9 correspond with the paths in the
figure. It was found that PQI only mediated the relationship between personalization and CE. This means
29 Figure 5 – Mediation between PQI, Personalization, and CE
* = p < .10 ** = p < .05 *** = p <.001
For the repeat business dependent variable, similar mediation effects were found. It turns out that the
mediation effect of PQI between personalization and RB is marginally significant (p = .08). Analysis
reveals that personalization is a significant predictor of PQI (p = .03). However, it was found that
per-sonalization is not a significant predictor for RB (p = .30). Nevertheless, PQI is significant (p = .03).
The reverse, P|PQI, is no significant predictor of RB (p = .54). This does not confirm the mediating
effect of perceived quality of interaction on the relationship of personalization and repeat business.
Perceived quality of interaction and willingness to engage in word-of-mouth
Rapport
When having rapport as the independent variable, PROCESS mediation analyses revealed that Perceived
Quality of Interaction (PQI) did not mediate willingness to engage in word-of-mouth (WOM) or
will-ingness to share on social media (SM). Therefore, the perceived quality of interaction does not mediate
the relationship between rapport and these two variables.
Personalization
Again, having personalization as the independent variable results in marginally significant mediation
effects in the case of WOM (p = .08). This means that personalization is a significant predictor for PQI.
Personalization is also a significant predictor of WOM (p = .04). It turns out that P|PQI is a significant
predictor of WOM (p = .00), but PQI|P is not (p = .19). This confirms the full mediating effect of PQI
on the relationship of personalization and WOM. In this case, the effect size of the mediator is -.25, with a 95% confidence interval; meaning the effect was significantly greater than zero at α = .05.
Personalization (X)
Perceived Quality
of Interaction (M)
Company
Evaluation (Y)
(B) β
= .69***
(C
x) β
= -.11
(A) β
= -.42*
Personalization (X)
Company
Evaluation (Y)
30 Unfortunately, a confirming Sobel’s test resulted in non-significant results, which means the mediation
[image:31.595.66.534.139.200.2]is not significant after all. The results can be found in Tables 11 and 12.
Table 11 – Mediation analysis results
Path β (Unstandardized) σ β (Standardized) Significance
C (Pers. to WOM) -.58 .28 -.23 .04
A (Pers. to PQI) -.42 .23 -.20 .08
B (PQI to WOM) .60 .12 .49 .00
Cx(Pers. to WOM) -.33 .25 -.13 .20
Table 12 – Sobel’s Z test
Test Value σ Significance
[image:31.595.78.521.192.263.2] [image:31.595.75.527.377.600.2]-1.21 2.07 0.227
Figure 6 illustrates how the mediation works, the paths from Table 11 correspond with the paths in the
figure. It was found that perceived quality of interaction only mediated the relationship between
person-alization and willingness to engage in WOM. This means that personperson-alization lowers the PQI and with
that the willingness to engage in WOM.
Figure 6 – Mediation between PQI, Personalization, and WOM * = p < .10
** = p < .05 *** = p <.001
Similar effects are found for the relation between personalization and the SM (p = .08). This means that
personalization is a significant predictor for PQI. However, personalization is no significant predictor
for SM (p = .43). Nevertheless, it turns out personalization|PQI is a significant predictor (p = .02) for
SM, where PQI|personalization is not (p = .73). However, this does not confirm a mediating effect of
PQI between personalization and willingness to share on social media.