ORIGINAL RESEARCH
High-Resolution Contrast-Enhanced,
Susceptibility-Weighted MR Imaging at 3T in
Patients with Brain Tumors: Correlation with
Positron-Emission Tomography and
Histopathologic Findings
K. Pinker I.M. Noebauer-Huhmann I. Stavrou R. Hoeftberger P. Szomolanyi G. Karanikas M. Weber A. Stadlbauer E. Knosp K. Friedrich S. Trattnig
BACKGROUND AND PURPOSE:The purpose of this work was to demonstrate susceptibility effects (SusE) in various types of brain tumors with 3T high-resolution (HR)-contrast-enhanced (CE)-suscepti-bility-weighted (SW)-MR imaging and to correlate SusE with positron-emission tomography (PET) and histopathology.
MATERIALS AND METHODS: Eighteen patients with brain tumors, scheduled for biopsy or tumor extirpation, underwent high-field (3T) MR imaging. In all of the patients, an axial T1-spin-echo (SE) sequence and an HR-SW imaging sequence before and after IV application of a standard dose of contrast agent (MultiHance) was obtained. Seven patients preoperatively underwent PET. The fre-quency and formation of intralesional SusE in all of the images were evaluated and correlated with tumor grade as determined by PET and histopathology. Direct correlation of SusE and histopathologic specimens was performed in 6 patients. Contrast enhancement of the lesions was assessed in both sequences.
RESULTS: High-grade lesions demonstrated either high or medium frequency of SusE in 90% of the patients. Low-grade lesions demonstrated low frequency of SusE or no SusE. Correlation between intralesional frequency of SusE and histopathologic, as well as PET, tumor grading was statistically significant. Contrast enhancement was equally visible in both SW and SE sequences. Side-to-side comparison of tumor areas with high frequency of SusE and histopathology revealed that intralesional SusE reflected conglomerates of increased tumor microvascularity.
CONCLUSIONS:3T HR-CE-SW-MR imaging shows both intratumoral SusE not visible with standard MR imaging and contrast enhancement visible with standard MR imaging. Because frequency of intratumoral SusE correlates with tumor grade as determined by PET and histopathology, this novel technique is a promising tool for noninvasive differentiation of low-grade from high-grade brain tumors and for determination of an optimal area of biopsy for accurate tumor grading.
H
igh-resolution (HR) susceptibility-weighted (SW) MR imaging is a 3D gradient-echo imaging technique that is based on blood oxygen level-dependent (BOLD) induced-phase effects between venous blood and the surrounding brain parenchyma. HR-SW-MR imaging allows for noninvasive vi-sualization of small veins in the human brain at submillimeter resolution and, therefore, is used to depict venous architecture in normal, as well as pathologic, tissue.1-8Because the underlying contrast mechanism is associated with the magnetic susceptibility difference between oxygen-ated hemoglobin (diamagnetic) and deoxygenoxygen-ated hemoglo-bin (paramagnetic), differences in the state of the blood oxy-genation, such as in cerebral veins, result in differences in the bulk magnetic susceptibility of blood (static BOLD effect).
Consequently, the BOLD susceptibility-based contrast-to-noise ratio is increased at higher field strengths (B0). In addi-tion, higher field strength B0increases the intrinsic signal in-tensity-to-noise ratio (SNR), because SNR scales at least linearly with B0.1,4,9,10Thus, the application of a T1-reducing contrast agent raises the blood signal intensity fraction avail-able for signal intensity cancellation with adjacent brain pa-renchyma by inducing an extraphase shift.11Therefore, com-pared with 1.5T, high-field (3T) HR contrast-enhanced (CE)-SW-MR imaging allows for optimal susceptibility effects (SusE) at shorter measurement times.1,4,12
Clinical applications of 3T HR-CE-SW-MR imaging in-clude improved visualization of cerebral vascular tions, such as cavernous angiomas, arteriovenous malforma-tions, detection of developmental venous anomalies, cerebral venous thrombosis, and intracranial hemorrhage.12,133T HR-CE-SW-MR imaging of highly vascularized tumors also shows complex and variable venous patterns in various types of tu-mors and in different parts of the lesions,1which might be because of the increased blood supply and particular vascular patterns associated with fast-growing tumors.14Therefore, 3T HR-CE-SW-MR imaging seems to be a promising tool for advanced tumor evaluation, because it has the potential to noninvasively assess intratumoral microvascularity that is as-Received August 11, 2006; accepted after revision November 20.
From the MR Centre of Excellence, Department of Radiology (K.P., I.M.N.-H., P.S., M.W., K.F., S.T.), Department of Neurosurgery (I.S., E.K.), Institute of Neurology (R.H.), and Department of Nuclear Medicine (G.K.), Medical University Vienna, Vienna, Austria; Department of Neurosurgery (A.S.), University Erlangen-Nuremberg, Erlangen, Germany.
Abstract previously presented at: Annual Meeting of the Radiological Society of North America, November 26-December 1, 2006; Chicago, Ill.
Address correspondence to Siegfried Trattnig, MR Centre of Excellence, Department of Radiology, Medical University Vienna, Lazarettg 14, 1090 Vienna, Austria; e-mail: siegfried.trattnig@meduniwien.ac.at
sociated with fast-growing tumors and because it directly cor-relates with tumor grade.14-16
The first aim of this study was to visualize SusE in various types of brain tumors at 3T HR-CE-SW-MR imaging and to correlate intralesional SusE with positron-emission tomogra-phy (PET) and histopathology. The second aim was to evalu-ate the clinical potential of this method for noninvasive differ-entiation of low-grade from high-grade brain tumors and for determination of the optimal biopsy location for accurate tu-mor grading.
Materials and Methods
After obtaining local ethics committee approval, 18 patients (4 women and 14 men; 22–73 years old [mean age: 53.6 years] at the time of diagnosis) with a primary brain lesion suspicious for a malignant brain tumor diagnosed previously by standard (1.5T) MR imaging were included in this study. All of the patients gave written informed consent.
The patients included in this study were scheduled for either ste-reotactic biopsy or tumor resection in the Department of Neurosur-gery of the Medical University Vienna (MUV). Patients were in stable clinical condition without any known contraindications to MR imag-ing or intravenous application of standard MR imagimag-ing contrast agents. No patient had any surgical or local treatment of the lesion before the MR examination. All 18 of the patients underwent 3T HR-CE-SW-MR imaging at our institution. High-field MR images were acquired using a 3T Medspec 30/80 scanner (Bruker, Ettlingen, Ger-many) with a head birdcage transmit/receive coil and an actively shielded gradient system with a maximum gradient strength of 45 mT/m.
The optimal dose of paramagnetic contrast agent was determined with regard to SusE, image quality, and scan time in a previously performed volunteer study of 6 healthy volunteers.12The contrast
agent used was gadobenate-dimeglumine (MultiHance, Bracco Im-aging, Milan, Italy) with a proton magnetic relaxivity twice that of other available standard paramagnetic contrast agents.12A standard
dose of gadobenate-dimeglumine (0.1 mmol or 0.2 mL/kg of body weight) proved optimal to achieve an equivalent SusE and image quality, together with a considerable reduction in scan time compared with unenhanced 3T HR-SW-MR imaging.12All of the patients in our
study received the previously determined dose of 0.1 mmol/L (0.2 mL/kg of body weight) of IV gadobenate-dimeglumine administered as a bolus. The data acquisition for each examination was started after a standard delay (10 minutes) and completed within 1 hour after contrast agent application. The total imaging time for all of the se-quences was approximately 22 minutes.
MR imaging included the following sequences: standard axial T1-weighted spin-echo (SE) precontrast and postcontrast (TR/TE: 1000 ms/14 ms; FOV: 230⫻230 mm, 192⫻256 mm; 1 acquisition [NEX: 1]; L-R phase encoding and section thickness: 3 mm/0.3 mm: scan time: 3:13 minutes). HR-SW-MR imaging was performed with vari-ous TR/TE values for precontrast and postcontrast doses (FOV: 256⫻256 mm; precontrast TR/TE: 43 ms/25 ms; postcontrast TR/ TE: 36 ms/20 ms; matrix: 384⫻512; section thickness: 2 mm; slab thickness: 64 mm; flip angle: 20°; scan time precontrast: 9 minutes; and scan time postcontrast: 6 minutes).
Both magnitude and phase images were reconstructed from the raw datasets. To remove variations in the phase images caused by static magnetic field inhomogeneity effects, a homodyne
demodula-tion was used to correct these variademodula-tions.4,5A phase mask filter was
designed from corrected phase images, which was multiplied twice with the corresponding magnitude images to further improve the visibility of venous vasculature.
All of the MR images were evaluated by an experienced neurora-diologist and by 2 raneurora-diologists with previous experience with SW im-aging in consensus. We evaluated whether lesion size was equal in both HR-SW-MR and T1-SE images or if there was a difference in the general dimension of the tumors in the different imaging techniques. The presence of intralesional calcifications or intralesional hemor-rhage in the tumors on T1-SE images that could cause intralesional SusE and thus mimic intralesional vascularity was assessed.
Qualitative evaluation of presence and frequency, parameters that describe the frequency of intralesional SusE in precontrast and post-contrast HR-SW-MR images, was performed as visual assessment. Magnetic SusE in the neoplasm were defined as either tubular or nontubular foci of low signal intensity on HR-SW-MR images; the frequency of intralesional SusE was assessed and graded on a scale of 0 –3. Grade 0 was defined as no SusE, grade 1 as low frequency of SusE, grade 2 as medium frequency of SusE, and grade 3 as high frequency of SusE. The formations of intralesional SusE, a parameter for SusE configuration, were evaluated, and the radiologists determined whether conglomerates of SusE were detectable. Moreover, the visi-bility of individual enlarged or tortuous veins in the tumors on HR-SW-MR images was assessed. In addition, contrast enhancement of the lesions was evaluated and also graded as follows: 1) grade 0, no contrast enhancement; 2) grade 1, minimal contrast enhancement; 3) grade 2, moderate contrast enhancement; and 4) grade 3, marked contrast enhancement.
Seven of 18 patients preoperatively underwent combined [18F]
fluorodeoxyglucose (FDG) and11C-methionine (MET)-PET at the
Department of Nuclear Medicine of our institution (MUV). FDG-PET images were acquired 45 minutes after IV administration of FDG. MET-PET images were acquired after IV administration of MET. F-18-FDG-PET was mainly used for determination of the op-timal site for biopsy of lesions suspicious of glioma. MET-PET was used for assessment of grade of tumor malignancy, as well as lesion localization and extension. An experienced nuclear physicist evalu-ated FDG/MET-PET images. Metabolic activity was assessed by qual-itative comparison of tumor uptake to contralateral normal brain parenchyma. All of the lesions were graded on a scale of 0 –3. Grade 1 defined the neoplasm as a low-grade lesion, grade 2 as medium-grade lesion, and grade 3 as a high-grade lesion. Subsequently, all of the patients in this series underwent either stereotactic biopsy or subtotal/ total resection of the tumor at the Department of Neurosurgery, and every excised specimen was evaluated by an experienced histopathol-ogist from the Clinical Institute of Neurology (University Erlangen-Nuremberg, Erlangen, Germany). Tumors were graded according to the revised World Health Organization (WHO) classification.17
His-tologic features such as cell frequency, nuclear atypia, mitotic activity, necrosis, and vascular proliferation were evaluated on hematoxylin-eosin (H&E)-stained or anti-CD34-immunostained tissue sections, respectively. Vascular proliferation typically appeared as glomeruloid vascular, vascular garland, or vascular cluster. The histopathologic diagnosis was used as the standard of reference for statistical analysis. Subsequently, intralesional SusE were correlated with respect to tumor grade with histopathology and PET findings. In 6 patients, a total of 9 selected biopsies of tumor areas with pronounced SusE known from previous 3T HR-CE-SW-MR imaging was correlated with possible conglomerates of intralesional vascular proliferations
BRAIN
ORIGINAL
by using anatomic landmarks in the surrounding parenchyma for orientation to ensure section compatibility between MR imaging and sampling sites. Direct correlation between SusE and histopathologic findings was not possible in all of the patients, because the stereotactic biopsy was often directed toward the most accessible area and not necessarily the area of the highest frequency of SusE.
For statistical evaluation of the operated patient collective, we used SPSS 13.0 software (SPSS, Chicago, Ill). For statistical assess-ment of the correlation of intralesional SusE, PET and histopatho-logic finding cross-tabulations were calculated. For evaluation of sta-tistical significance, a Fisher-Holton-Freeman test was used. For measurement of agreement, acoefficient was used, and for correla-tion of SusE conglomerates and PET, as well as histopathologic tumor grading, a contingency coefficient was calculated.P⬍.05 was consid-ered significant.
Results
General dimensions of the detected brain lesions were equal in both HR-SW-MR and T1-SE images. No intralesional calcifi-cations or hemorrhage were visible on T1-SE images.
The imaging findings regarding frequency and formations of intralesional SusE findings on HR-SW-MR imaging, con-trast enhancement on T1-SE-MR imaging, and the his-topathologic findings from 18 patients with 22 brain lesions with 25 biopsies (1 patient had 4 biopsies taken from different parts of the lesion) are depicted in Table 1. HR-SW-MR im-aging demonstrated regular venous vasculature in the direct vicinity of the brain tumors, but no individual intralesional enlarged or tortuous veins could be detected. The intralesional SusE were not detectable with conventional SE images and accumulated in specific parts of the lesions but were refined
within the tumor borders depicted by both imaging techniques.
Histopathology determined 22 biopsies as high grade (Fig 1E,F), 1 as intermediate, and 2 as low grade (Fig 2D). In 7 patients with 12 biopsy samples (9 lesions), who preopera-tively underwent FDG/MET-PET, PET determined 8 lesions as high grade (Fig 1D), 1 as intermediate, and 3 as low grade (Fig 2C).
Correlation of tumor grade, SusE frequency, and conglom-erates is illustrated in Table 2. Correlation of SusE frequency and histopathologic tumor grading was statistically significant with aPof .01 and aof 0.324. Correlation of SusE conglom-erates and histopathologic tumor grading was also statistically significant, with aPof .004 and a contingency coefficient (CC) of 0.594.
Contrast enhancement, visible in T1-weighted SE se-quences (Fig 1Cand Fig 2B), was apparent in SW-MR imaging as well (Fig 1B, Fig 2A, Fig 3B). Fourteen of 17 high-grade lesions, all of which demonstrated either medium (Fig 3A) or high frequency of SusE (Fig 1A), demonstrated marked con-trast enhancement. One high-grade lesion demonstrated moderate contrast enhancement. Two high-grade lesions demonstrated no contrast enhancement but low frequency of SusE, and 2 high-grade lesions demonstrated minimal con-trast enhancement and medium frequency of SusE. In 1 lesion with minimal enhancement and medium frequency of SusE, formations of SusE conglomerates were detected. The lesion graded as intermediate by histopathology and low by PET demonstrated no contrast enhancement and low frequency of SusE.
All 3 of the lesions determined by both PET and histopa-Table 1: MR imaging and histopathologic findings
N Lesions,n Biopsy,n
SusE
CE
Histopathology Frequency Conglomerates Tumor Grade Diagnosis
1 1 1 3 1 3 High Glioblastoma IV
2 1 1 3 1 3 High Ependymoma II
2 2 2 3 1 3 High Ependymoma II
3 1 1 3 1 3 High Glioblastoma IV
3 2 1 3 1 3 High Glioblastoma IV
3 3 1 3 1 3 High Glioblastoma IV
4 1 1 2 1 1 High Oligodendroglioma III
5 1 1 1 0 0 Low Astrocytoma II
6 1 1 1 0 0 Intermediate Astrocytoma II-III
7 1 1 2 1 0 High Oligoastrocytoma III
8 1 1 3 1 3 High Glioblastoma IV
9 1 1 3 1 3 High Glioblastoma IV
10 1 1 3 1 3 High Glioblastoma IV
11 1 1 1 0 1 High Glioblastoma IV
12 1 1 1 0 0 Low Oligoastrocytoma II
13 1 1 3 1 3 High Glioblastoma IV
14 1 1 3 1 2 High Glioblastoma IV
15 1 1 3 1 3 High Glioblastoma IV
15 1 2 3 1 3 High Glioblastoma IV
15 1 3 3 1 3 High Glioblastoma IV
15 1 4 3 1 3 High Glioblastoma IV
16 1 1 1 0 0 High Astrocytoma III
17 1 1 2 1 3 High Glioblastoma IV
17 2 2 2 1 3 High Glioblastoma IV
18 1 1 3 1 3 High Glioblastoma IV
Note:—SusE indicates susceptibility effects. Frequency of SusE: low⫽1; medium⫽2; high⫽3. Formations of conglomerates of intralesional SusE: no⫽0; yes⫽1. Contrast
[image:3.585.55.535.61.338.2]thology as low grade demonstrated either no SusE or low fre-quency of SusE and no SusE conglomerates (Fig 2A). One lesion, which histopathology diagnosed as high grade and PET diagnosed as intermediate, displayed a medium frequency of SusE with formations of SusE conglomerates, whereas 7 of 8 high-grade lesions demonstrated high frequency of SusE, as well as SusE conglomerates (Fig 1A). Correlation of SusE fre-quency and PET tumor grading (Table 3)was statistically sig-nificant with aPof .004 and aof 0.84, reflecting very good agreement of diagnosis. Correlation of SusE conglomerates and PET tumor grading was also statistically significant, with a
Pof 0.018 and a CC of 0.634. In addition, correlation of tumor grading by PET and histopathology was assessed, and it dem-onstrated good correlation of both techniques with aPof .09 and aof 0.631. In 6 selected patients, 9 specimens of tumor areas with a high frequency of SusE were directly correlated with histopathologic specimens of the matching sampling ar-eas, and intratumoral SusE corresponded with conglomerates of abnormal vascular proliferations (Fig 1D, E).
Discussion
The accurate grading of brain lesions has important prognos-tic and therapeuprognos-tic implications, because high-grade lesions
are treated differently from low-grade lesions. Patients with high-grade lesions both resectable or unresectable receive ei-ther radiation ei-therapy or combined radiochemoei-therapy.18,19 Low-grade gliomas (WHO grades I and II) are amendable to (radio)surgical resection with curative intent, and adjuvant radiochemotherapy is only recommended for patients with incompletely resected grade II tumors or for patients older than age of 40 years regardless of the extent of resection.20,21In an effort to preoperatively differentiate between high-grade and low-grade lesions and to determine the optimal patient treatment, very often a stereotactic biopsy is performed pre-operatively.21Burger et al22found that, among histopatho-logic features such as cell frequency, nuclear atypia and mitotic activity, necrosis, and vascular proliferation, only vascular proliferation differentially predicted both the short- and long-term survival in patients with anaplastic astrocytomas. To date, the detection of vascular proliferations within a malig-nant brain lesion places a maligmalig-nant brain tumor in the WHO IV classification, and, typically, pathologic microvascularity is not uniform throughout a lesion.1,6,23-25Because critical por-tions of the malignant brain lesions are not always included in the biopsy area or are not delivered with the specimen to the pathologist, critical markers of tumor grade may be
over-Fig 1.A 36-year-old male patient with right temporomesial glioblastoma WHO IV.
A, Axial 3T HR-CE-SW-MR images demonstrated a brain lesion with high frequency of SusE. B, Axial 3T HR-CE-SW-MR images demonstrated a brain lesion with marked CE in HR-SW sequence. C, Axial 3T HR-CE-SW-MR images demonstrated a brain lesion with marked CE in T1-weighted SE sequence. D, FDG/MET-PET showed hypermetabolism temporal right (yellow arrow).
EandF,The lesion was determined by histopathology (H&E staining,⫻200) as a glioblastoma WHO IV.
[image:4.585.56.535.42.367.2]looked, leading to a potential undergrading of the lesion. Therefore, MR imaging of features suggestive of high tumor grade in malignant brain lesions, such as intralesional vascular proliferations,14could be an important noninvasive tool for accurate tumor grading.23,24,26,27Visualization of altered an-gioarchitecture in malignant gliomas gets feasible as tumor vessels become excessively convoluted and form masses that resemble renal glomerular tufts or are arranged in huge gar-lands of proliferative vessels and are, therefore, within the range of HR 3T imaging.24
In this study, 3T HR-CE-SW-MR imaging was used to as-sess the frequency of intralesional SusE, supposedly correlated with increased microvascularity, and to correlate intratumoral SusE with tumor grade as determined by both PET and histo-pathology. 3T HR-CE-SW-MR imaging demonstrated both tubular and nontubular intratumoral SusE, often forming conglomerates, which were thought to represent areas of in-creased microvascularity. We found a statistically significant correlation of frequency of intralesional SusE and tumor grade, as determined by both PET (P⫽.004) and histopathol-ogy (P⫽.01). Moreover, statistically significant correlation
between the presence of conglomerates of intralesional SusE and tumor grade as determined by both PET (P⫽.018) and histopathology (P⫽.004) was found. The contrast-enhance-ment behavior of all of the lesions in both sequences was also assessed and compared. In good agreement with Sehgal et al,28 the contrast enhancement of brain lesions, visible in SW-MR images, was equal to that of T1-weighted SE sequences. In our study, 3 high-grade lesions, which demonstrated either mini-mal or no contrast enhancement, showed at least a low fre-quency of intralesional SusE. In 1 of those high-grade lesions, SusE conglomerates were visible. The lesions, graded as inter-mediate, displayed no contrast enhancement but a medium frequency of intratumoral SusE. These findings indicate that HR-SW-MR is superior to dynamic gadolinium scanning in tumor grading. Because the detection of intralesional SusE is an indicator of tumor angiogenesis, which is associated with growing tumors and directly linked to tumor grade, it is a more sensitive marker for tumor malignancy, as contrast en-hancement can result from both the breakdown of the blood-brain barrier or increased lesion vascularity. Moreover, with 3T HR-CE-SW-MR, both contrast enhancement and
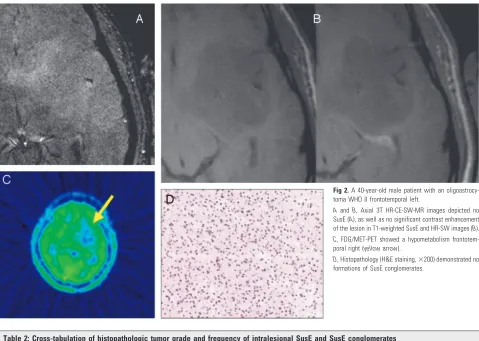
intrale-Fig 2.A 40-year-old male patient with an
oligoastrocy-toma WHO II frontotemporal left.
AandB, Axial 3T HR-CE-SW-MR images depicted no SusE (A), as well as no significant contrast enhancement of the lesion in T1-weighted SusE and HR-SW images (B). C, FDG/MET-PET showed a hypometabolism frontotem-poral right (yellow arrow).
[image:5.585.54.533.39.380.2]D, Histopathology (H&E staining,⫻200) demonstrated no formations of SusE conglomerates.
Table 2: Cross-tabulation of histopathologic tumor grade and frequency of intralesional SusE and SusE conglomerates
Histopathologic Tumor Grade
Frequency of SusE,n(%)
Conglomerates,n(%) Total,n(%) Low Medium High
Low count 2 (8) 0 0 0 2 (8)
Intermediate count 1 (4) 0 0 0 1 (4)
High count 2 (8) 4 (16) 16 (64) 20 (80) 22 (88)
Total count 5 (20) 4 (16) 16 (64) 20 (80) 25 (100)
Note:—SusE indicates susceptibility effects. Frequency and formation of conglomerates of intralesional SusE showed good correlation with histopathologic tumor grade. A medium- or
[image:5.585.55.533.388.452.2]sional SusE can be evaluated with 1 sequence. Another imag-ing technique used for tumor gradimag-ing that is based on the spatial distribution of metabolic changes in the brain is proton 1H-MR spectroscopic imaging. The results of recent studies
demonstrated that proton MR spectroscopic imaging (MRSI) with high spatial resolution, segmentation, and absolute quantification of metabolic changes provides information for preoperative grading of gliomas.29-31These findings suggest that a combination of both techniques, HR-SW-MR imaging and 1H-MR, in the preoperative assessment of malignant brain tumors might allow for a more accurate tumor grading than the combination of conventional MR imaging and MR spectroscopy, which has been routinely used to now.
In our study, in contrast to Sehgal et al,32we did not ob-serve a paradoxic signal intensity loss because of T2* effects caused by the IV application of contrast agent. This can be explained by the fact that, before patient examinations, a vol-unteer study was performed to determine the optimal dose of the contrast agent with known high relaxivity so as to achieve the best compromise between image quality and scan time for the clinical application of 3T HR-CE-SW-MR imaging.12In contrast to a previously conducted study by Barth et al,1which used a double dose of gadopentate-dimeglumine as a contrast agent, only a standard dose of gadobenate dimeglumine (Mul-tiHance) was required to achieve the optimal SusE and image quality at 3T, together with a reduced scan time.12
In 6 selected patients, a direct side-to-side correlation of histopathologic specimens from the lesions and intralesional MR-SusE was performed. Regions with high frequency of in-tralesional SusE corresponded with conglomerates of vascular proliferations. These findings agree quite well with those of Christoforidis et al.26
These investigators performed a postmortem in situ HR gradient-echo (GE) 8T MR imaging study of the brain in a 53-year-old woman with glioblastoma multiforme. Postmor-tem examination included HR MR imaging at a field strength
of 8T with a 2D Fourier transformation GE sequence and the evaluation of 10 histopathologic specimens in the region of the tumor bed by using H&E and reticulin stains. GE MR imaging and histopathologic findings were assessed and compared for microvascular size and frequency. Christoforidis et al24,26 found concurrence between both vascular frequency and vas-cular size as predicted by histopathologic analysis and 8T MR imaging in at least 7 of 9 biopsy samples and thus suggested that microvascularity in gliomas can be identified by high-field HR-SW-MR imaging.
The potential limitations of the current study included the high percentage of high-grade lesions in our patient collective and the relatively small number of patients who preoperatively underwent FDG/MET-PET examination. Moreover, 3T HR-CE-SW-MR imaging has a limited value in the diagnostic work-up of those patients in whom air/tissue boundaries caused severe susceptibility artifacts, for example, near the skull base and air spaces. In our study, the above-mentioned artifacts did not significantly compromise the regions of inter-est, and the visualization of intratumoral SusE was acceptable. Another limitation of our study was the relatively small sample size of specimens that could be directly compared, because stereotactic biopsy was often directed toward the most acces-sible area and not necessarily the area of the greatest SusE.
In our study, 3T HR-CE-SW-MR imaging demonstrated various patterns of SusE frequency, as well as formations in different parts of the lesions in various types of malignant brain tumors. The findings indicate that SusE reflect increased microvascularity or particular vascular patterns around fast-growing malignant tumors. In principle, it can be concluded that 3T HR-CE-SW-MR imaging has the potential to monitor intralesional vascular frequency14 or intralesional vascular proliferations and to identify increases or decreases of micro-vascularity during treatment and follow-up. As detection of increased microvascularity and conglomerates of vessel prolif-erations determine the grade of tumor malignancy, another
Fig 3.A 65-year-old male patient with glioblastoma
multi-forme (WHO IV).
[image:6.585.58.506.42.198.2]AandB, Axial 3T HR-CE-SW-MR imaging demonstrated medium frequency of intralesional SusE refined to the medial part of the lesion and formation of SusE conglomerates (A) and marked peripheral contrast enhancement (B).
Table 3: Cross-tabulation of PET tumor grade and frequency of intralesional SusE and SusE conglomerates
PET Tumor Grade
Frequency of SusE,n(%) Conglomerates,
n(%)
Total,
n(%) Low Medium High
Low count 3 (25) 0 0 0 3 (25)
Intermediate count 0 1 (8.33) 0 1 (8.33) 1 (8.33)
High count 1 (8.33) 0 7 (58.33) 7 (58.33) 8 (66.67)
Total 4 (33.33) 1 (8.33) 7 (58.33) 8 (66.67) 12 (100)
Note:—SusE indicates susceptibility effects; PET, positron-emission tomography. Frequency of intralesional SusE, as well as formation of conglomerates correlated directly with tumor grade
[image:6.585.53.534.221.287.2]potential application for 3T HR-CE-SW-MR imaging with an important diagnostic, as well as therapeutic, impact is the de-tection of an optimal site for tumor biopsy. Using this method, an accurate tumor grading will be possible. However, these findings should be addressed and further validated in future clinical studies. A larger series of patients with precisely lo-cated biopsies and standardized histopathologic data would yield more statistically significant results, as well as more in-formation on the various vascular patterns characteristic of different types of brain tumors. At this stage, 3T HR-CE-SW-MR imaging shows promise for the noninvasive grading of brain lesions; however, these findings should be addressed and further validated in future clinical studies.
Conclusions
3T HR-CE-SW-MR imaging shows intratumoral SusE that are not visible in other MR images, as well as contrast enhance-ment that is visible with standard MR imaging. As the fre-quency of intralesional SusE correlates with the grade of tu-mor malignancy determined by both PET and histopathology as the “gold standard,” this novel technique may be a promis-ing tool for the noninvasive differentiation of low-grade and high-grade brain tumors. Intralesional SusE reflect increased intratumoral microvascularity, and, therefore, the use of 3T HR-CE-SW-MR imaging makes it possible to determine the optimal location of a stereotactic biopsy for accurate tumor grading.
References
1. Barth M, Nobauer-Huhmann IM, Reichenbach JR, et al.High-resolution three-dimensional contrast-enhanced blood oxygenation level-dependent magnetic resonance venography of brain tumors at 3 Tesla: first clinical ex-perience and comparison with 1.5 Tesla.Invest Radiol2003;38:409 –14 2. Rauscher A, Sedlacik J, Barth M, et al.Magnetic susceptibility-weighted MR
phase imaging of the human brain.AJNR Am J Neuroradiol2005;26:736 – 42 3. Rauscher A, Sedlacik J, Fitzek C, et al.High resolution susceptibility weighted
MR-imaging of brain tumors during the application of a gaseous agent.Rofo
2005;177:1065– 69
4. Reichenbach JR, Barth M, Haacke EM, et al.High-resolution MR venography at 3.0 Tesla.J Comput Assist Tomogr2000;24:949 –57
5. Reichenbach JR, Essig M, Haacke EM, et al.High-resolution venography of the brain using magnetic resonance imaging.Magma1998;6:62– 69
6. Reichenbach JR, Haacke EM.High-resolution BOLD venographic imaging: a window into brain function.NMR Biomed2001;14:453– 67
7. Reichenbach JR, Jonetz-Mentzel L, Fitzek C, et al.High-resolution blood oxy-gen-level dependent MR venography (HRBV): a new technique. Neuroradiol-ogy2001;43:364 – 69
8. Reichenbach JR, Venkatesan R, Schillinger DJ, et al.Small vessels in the human brain: MR venography with deoxyhemoglobin as an intrinsic contrast agent.
Radiology1997;204:272–77
9. Haacke EM, Xu Y, Cheng YC, Reichenbach JR.Susceptibility weighted imaging (SWI).Magn Reson Med2004;52:612–18
10. Haddar D, Haacke E, Sehgal V, et al.Susceptibility weighted imaging. Theory and applications [in French]. J Radiol2004;85:1901– 08
11. Lin W, Mukherjee P, An H, et al.Improving high-resolution MR bold veno-graphic imaging using a T1 reducing contrast agent.J Magn Reson Imaging
1999;10:118 –23
12. Noebauer-Huhmann IM, Pinker K, Barth M, et al.Contrast-enhanced, high-resolution, susceptibility-weighted magnetic resonance imaging of the brain: dose-dependent optimization at 3 Tesla and 1.5 Tesla in healthy volunteers.
Invest Radiol2006;41:249 –55
13. Thong K.Susceptibility-weighted imaging (SWI) case reports.Magnetom Flash2006;32:70 –73
14. Tynninen O, Aronen HJ, Ruhala M, et al.MRI enhancement and microvascu-lar density in gliomas. Correlation with tumor cell proliferation.Invest Radiol
1999;34:427–34
15. Robinson SP, Howe FA, Rodrigues LM, et al.Magnetic resonance imaging techniques for monitoring changes in tumor oxygenation and blood flow.
Semin Radiat Oncol1998;8:197–207
16. Bagley LJ, Grossman RI, Judy KD, et al.Gliomas: correlation of magnetic sus-ceptibility artifact with histologic grade.Radiology1997;202:511–16 17. Kleihues P, Louis DN, Scheithauer BW, et al.The WHO classification of tumors
of the nervous system.J Neuropathol Exp Neurol2002;61:215–29
18. Butowski NA, Sneed PK, Chang SM.Diagnosis and treatment of recurrent high-grade astrocytoma.J Clin Oncol2006;24:1273– 80
19. Hsieh JC, Lesniak MS.Surgical management of high-grade gliomas.Expert Rev Neurother2005;5:S33–S39
20. Schramm J, Blumcke I, Ostertag CB, et al.Low-grade gliomas – current con-cepts.Zentralbl Neurochir2006;67:55– 66
21. Stieber VW.Low-grade gliomas.Curr Treat Options Oncol2001;2:495–506 22. Burger PC, Vogel FS, Green SB, et al.Glioblastoma multiforme and anaplastic
astrocytoma. Pathologic criteria and prognostic implications. Cancer
1985;56:1106 –11
23. Schad LR.Improved target volume characterization in stereotactic treatment planning of brain lesions by using high-resolution BOLD MR-venography.
NMR Biomed2001;14:478 – 83
24. Christoforidis GA, Grecula JC, Newton HB, et al.Visualization of microvascu-larity in glioblastoma multiforme with 8-T high-spatial-resolution MR imag-ing.AJNR Am J Neuroradiol2002;23:1553–56
25. Trattnig S, Pinker K, Ba-Ssalamah A, et al.The optimal use of contrast agents at high field MRI.Eur Radiol2006;16:1280 – 87
26. Christoforidis GA, Kangarlu A, Abduljalil AM, et al.Susceptibility-based im-aging of glioblastoma microvascularity at 8 T: correlation of MR imim-aging and postmortem pathology.AJNR Am J Neuroradiol2004;25:756 – 60
27. Ba-Ssalamah A, Nobauer-Huhmann IM, Pinker K, et al.Effect of contrast dose and field strength in the magnetic resonance detection of brain metastases.
Invest Radiol2003;38:415–22
28. Sehgal V, Delproposto Z, Haddar D, et al.Susceptibility-weighted imaging to visualize blood products and improve tumor contrast in the study of brain masses.J Magn Reson Imaging2006;24:41–51
29. Stadlbauer A, Gruber S, Nimsky C, et al.Preoperative grading of gliomas by using metabolite quantification with high-spatial-resolution proton MR spectroscopic imaging.Radiology2006;238:958 – 69
30. Yang D, Korogi Y, Sugahara T, et al.Cerebral gliomas: prospective comparison of multivoxel 2D chemical-shift imaging proton MR spectroscopy, echopla-nar perfusion and diffusion-weighted MRI.Neuroradiology2002;44:656 – 66 31. Law M, Yang S, Wang H, et al.Glioma grading: sensitivity, specificity, and
predictive values of perfusion MR imaging and proton MR spectroscopic im-aging compared with conventional MR imim-aging.AJNR Am J Neuroradiol
2003;24:1989 –98


![2 Chloro 3 chloromethylbenzo[h]quinoline](data:image/gif;base64,R0lGODlhAQABAIAAAP///wAAACH5BAEAAAAALAAAAAABAAEAAAICRAEAOw==)