ORIGINAL RESEARCH
Whole-Brain Histogram and Voxel-Based
Analyses of Apparent Diffusion Coefficient and
Magnetization Transfer Ratio in Celiac Disease,
Epilepsy, and Cerebral Calcifications Syndrome
R. Della Nave A. Magaudda R. Michelucci G. Capizzi A. Calabro` L. Guerrini C. Gavazzi S. Diciotti P. Riguzzi O. Daniele N. Villari C.A. Tassinari M. Mascalchi
BACKGROUND AND PURPOSE: Diffusion and magnetization transfer (MT) techniques have been applied to the investigation with MR of epilepsy and have revealed changes in patients with or without abnormalities on MR imaging. We hypothesized that also in the coeliac disease (CD), epilepsy and cerebral calcifications (CEC) syndrome diffusion and MT techniques could reveal brain abnormalities undetected by MR imaging and tentatively correlated to epilepsy.
MATERIALS AND METHODS:Diffusion and MT weighted images were obtained in 10 patients with CEC, 8 patients with CD without epilepsy and 17 healthy volunteers. The whole brain apparent diffusion coefficient (ADC) and MT ratio (MTR) maps were analyzed with histograms and the Statistical Parametric Mapping 2 (SPM2) software. We employed the non-parametric Mann-WhitneyUtest to assess differences for ADC and MTR histogram metrics. Voxel by voxel comparison of the ADC and MTR maps was performed with 2 tailst-test corrected for multiple comparison.
RESULTS: A significantly higher whole brain ADC value as compared to healthy controls was observed in CEC (P⫽0.006) and CD (P⫽0.01) patients. SPM2 showed bilateral areas of significantly decreased MTR in the parietal and temporal subcortical white matter (WM) in the CEC patients.
CONCLUSION:Our study indicates that diffusion and MT techniques are also capable of revealing abnormalities undetected by MR imaging. In particular patients with CEC syndrome show an increase of the whole brain ADC histogram which is more pronounced than in patients with gluten intolerance. IN CEC patients, voxel-based analysis demonstrates a localized decrease of the MTR in the parieto-temporal subcortical WM.
I
n the syndrome of celiac disease, epilepsy, and cerebral cal-cifications (CEC), epilepsy is not strictly associated with lo-cal deposit of lo-calcium.1 In fact, its onset can anticipate the appearance of calcifications on CT2,3and its severity and evo-lution toward an epileptiform encephalopathy are indepen-dent of the extent of calcifications.4,5MR imaging in patients with CEC syndrome does not show significant abnormali-ties.4,6,7 Diffusion and magnetization transfer (MT) tech-niques have been applied to the investigation with MR of ep-ilepsy and have revealed focal or diffuse changes in patients with or without focal abnormalities on MR imaging.8-12We hypothesized also that in CEC diffusion, MT techniques could reveal brain abnormalities undetected by MR imaging and tentatively correlated to epilepsy. To test this hypothesis we performed whole-brain histogram and voxel-based analyses of apparent diffusion coefficients (ADCs) and magnetization transfer ratio (MTR) maps in a group of patients with CEC syndrome and 2 control groups represented by patients with celiac disease without epilepsy or neurologic involvement and healthy volunteers.Materials and Methods
Patient Selection
Ten patients (7 women and 3 men; mean age, 29.6⫾5.8 years) with CEC syndrome on a gluten-free diet (GFD) gave their informed con-sent to participate in this prospective study, which was approved by our local Ethical Committee. Their neurologic and electroencepha-lography (EEG) findings are summarized in Table 1. Nine of them showed cerebral calcifications with a typical distribution in prior CT examinations and had diagnoses of celiac disease based on the results of jejunal biopsy or presence of anti-gliadin, anti-endomysium, or anti-transglutaminase antibodies in the serum. Because CT scans ob-tained 0 –16 years before MR imaging (mean, 8.5 years) were available for all patients, we did not repeat CT examination to avoid unneces-sary radiation exposure.
One control group comprised 8 (7 women and 1 man; mean age, 33⫾11.9 years) patients with celiac disease on a GFD without epi-lepsy or neurologic deficit, hereafter labeled as patients with CD. The other control group included 17 (7 women and 10 men; mean age, 34.2⫾9.1 years) healthy volunteers. Because patients with CD do not show increased frequency of brain calcifications5,13we did not submit
them to CT.
MR Examination Protocol
All examinations were performed on a 1.5T system equipped with 30 mT/m gradients. After scouts, 3-mm axial T2-weighted fluid attenu-ated inversion recovery (FLAIR) (TR, 6000 ms; TE, 100 ms; inversion recovery, 2100 ms; FOV, 230 mm; matrix size, 256⫻256; NEX, 2) turbo spin-echo images were obtained. For diffusion-weighted imag-ing, 24 contiguous axial sections were acquired with a double-shot, echo-planar imaging (EPI) sequence (TR, 1600 ms; TE, 102 ms, EPI Received April 19, 2006; accepted after revision June 1.
From the Sections of Radiodiagnostics (R.D.N., L.G., C.G., N.V., M.M.) and Gastroenterology (A.C.), Department of Clinical Physiopathology and Department of Electronics and Tele-communications (S.D.), University of Florence, Florence, Italy; Department of Neurology (A.M.), University of Messina, Messina, Italy; Division of Neurology (R.M. P.R., C.A.T.), Bellaria Hospital, University of Bologna, Bologna, Italy; Department of Child Neurology and Psychiatry (G.C.), University of Turin, Turin, Italy; and Institute of Neuropsychiatry (O.D.), University of Palermo, Palermo, Italy.
Address correspondence to Prof. M. Mascalchi, Radiodiagnostic Section, Department of Clinical Physiopathology, University of Florence, Viale Morgagni 85, 50134 Florence, Italy; e-mail: [email protected]
BRAIN
ORIGINAL
factor, 15 with peripheral pulse gating). The section thickness was 5 mm, the FOV was 230 mm, and the matrix was 100⫻256. Diffusion-sensitizing gradients were applied along the 3 orthogonal axes using a b-value of 0 and 1000 s/mm2. For MT imaging, 24 contiguous
sec-tions were acquired with a T2*-weighted gradient recalled-echo se-quence (TR, 640 ms; TE, 12 ms; flip angle, 20°; NEX, 2) with and without an off-resonance pulse (1.5-kHz; Gaussian envelope dura-tion, 16.4 ms; flip angle, 50°). The section thickness was 5 mm, the FOV was 256 mm, and the matrix 192⫻256.
Image Evaluation and Data Analysis
Visual Assessment.Two observers jointly rated the extent of cerebral calcifications in the CT of the patients with CEC by using a 4-point rating scale: 1, minimal, punctate, unilateral; 2, mild, punctate, bilateral; 3, moderate, punctate on one side and coarse on the other; and 4, severe, coarse, bilateral.
Moreover, they evaluated the FLAIR images of the patients and control subjects for possible areas of increased signal in-tensity, as well as the T2*-weighted gradient-echo images without MT pulse for possible areas of decreased signal inten-sity consistent with calcifications.
Data Analyses.MRIcro 1.38 (http://www.mricro.com)14 was used for image display and histogram analysis. ImageJ 1.32 (http://rsb.info.nih.gov/ij/) software was used for image display and MTR map calculation. Brain tissue extraction was performed using the Brain Extraction Tool (BET) (http://www .fmrib.ox.ac.uk/fsl/bet2/index.html).15SPM2 (http://www.fil .ion.ucl.ac.uk/spm/) was used for image segmentation16and voxel-based MTR and ADC analysis.10,12,17-19Brain tissue vol-ume, normalized for subject head size, was estimated by SIENAX (structural image evaluation, using normalization, of atrophy, single time-point version) method,20 part of FSL 3.2.21
Maps of the ADC were reconstructed for each diffusion-weighted image. MTR maps were calculated by a custom-made ImageJ plug-in applying the following equation, pixel by pixel, after automatic segmentation of brain from nonbrain tissue15: [(M0⫺Ms)/M0]⫻100, where M0 and Ms are the images obtained without and with the sequence with the MT saturation pulse, respectively.
Histogram Analysis
For each ADC and MTR map, 2 binary brain masks were created. The first, excluding nonbrain tissues and CSF, was obtained with the BET
software.15The second was created by SPM2 segmentation capability
as the union of gray matter (GM) and white matter (WM) SPM2-segmented images to exclude the remaining CSF, using the equation (i1⫹i2)⬎0.5 in the ImCalc function in SPM2, where i1 and i2 rep-resent the probability maps for GM and WM, respectively. The 2 masks were intersected obtaining a final brain mask that was applied in MRIcro for ADC or MTR voxel-by-voxel data extraction. After normalization for brain volume, the 25th, 50th (median), and 75th percentile values, skewness, and kurtosis of the whole-brain ADC and MTR histograms were computed using a custom-made Matlab (Mat-lab 6.5 R13; The MathWorks, Natick, Mass) program.
Brain Volume Analysis
To explore possible differences in brain atrophy between the subject and patients groups, SIENAX was applied to each subject T2*-weighted gradient-echo images without MT pulse to estimate the to-tal brain volume, normalized for subject head size.
Voxel-Based Analysis
The origin of all source images was set on the anterior commissure. To improve the quality of segmentation and normalization,22
custom-ized SPM2 templates were created for b0 EPI images and T2*-weighted gradient-echo images with MT saturation pulse using the whole sample of patients and control subjects. Spatial normalization parameters (12-parameter affine transformation, 16 nonlinear itera-tions) were estimated to match SPM2 EPI and T2 standard templates, respectively, and then applied to the original b0 EPI and T2* gradient-echo images. Normalized images were averaged and smoothed with a 8-mm Gaussian kernel to create the customized templates.23
For each b0 EPI image, normalization parameters were estimated with a 12-parameter affine and 16 nonlinear iterations using the cus-tomized b0 EPI template and then applied to the corresponding ADC map; the same procedure was applied to normalize MTR maps using T2*-weighted images and a T2*-customized template. Normalized ADC and MTR maps were smoothed with a 10-mm, full-width, half-maximum Gaussian kernel to improve normal distribution and in-crease signal-to-noise ratio (averaging out noise).
Statistical Analyses
We used the nonparametric Mann-WhitneyUtest to explore differ-ences between the patients with CEC, the patients with CD, and healthy control subjects for ADC and MTR histogram features and for normalized total brain volume. Significance was set atPⱕ.01.
Voxel-by-voxel whole-brain comparison based on the general
lin-Table 1: Clinical, EEG, and CT findings in 10 patients with CEC syndrome
Case/Age/ Sex
Age at Onset (Years)
Neurologic
Examination Seizure Type EEG
Brain Calcification Extent Score on
CT*
1/19/F 6 months Normal Partial occipital Focal parietal 1
2/27/F 13 Normal Partial occipital Multifocal 1
3/34/F 12 Mental retardation Epileptic encephalopathy Bilateral occipital 2
4/27/F 7 Mental retardation Epileptic encephalopathy Bilateral occipital, diffuse slow spike-wave complexes
3
5/36/M 3 Mental retardation Epileptic encephalopathy Diffuse slow spike-wave complexes 3
6/31/F 10 Normal Partial occipital Bilateral occipital with secondary generalization 2
7/36/M 24 Normal Partial occipital Bilateral occipital 4
8/32/F 6 Mental retardation Epileptic encephalopathy Diffuse slow spike-wave complexes 2
9/37/M 2 months Mental retardation Epileptic encephalopathy Diffuse and multifocal spike-wave complexes 3
10/35/F 6 Normal Partial occipital Posterior and diffuse spike-wave complexes 1
[image:2.585.52.541.64.203.2]ear model, and the theory of Gaussian random fields was performed using SPM2 for ADC and MTR normalized maps. In these instances, the 2-tailedttest was chosen for group comparisons. For multiple comparison correction, the False Discovery Rate method was used,24
set atPⱕ.05; moreover, an extent threshold of 63 contiguous voxels (0.5 cm3) was adopted. The correlation between the localized areas of
MTR changes in the brain (see below) and cerebral calcium extent score was assessed with SPM2 and a significance level ofP⬍.05. We applied the MNI (Montreal Neurologic Institute) space utility (http:// www.ihb.spb.ru/⬃pet_lab/MSU/MSUMain.html) to achieve a more accurate spatial localization of the significant clusters.
Results
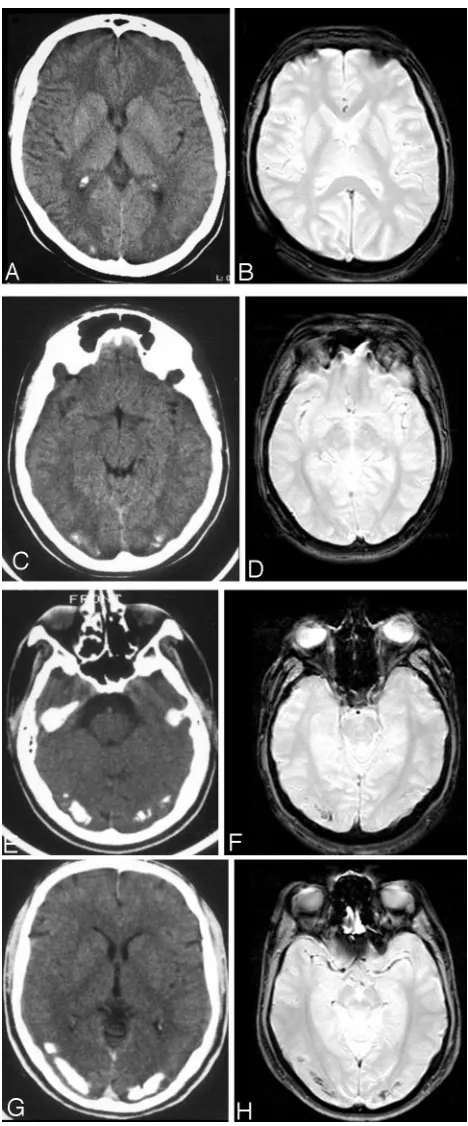
The extent of calcification in the patients with CEC was min-imal in 3 patients, mild in 3 patients, moderate in 3 patients, and severe in 1 patient (Fig 1). Cerebral calcifications appeared as areas lacking in signal intensity on T2*-weighted images in patients with CEC with moderate or severe extent of calcifica-tions (Fig 1). Few focal cerebral WM lesions appearing hyper-intense in FLAIR images were present in 5 (50%) of 10 patients with CEC, in 3 (37%) of 8 patients with CD, and in none of the healthy control subjects.
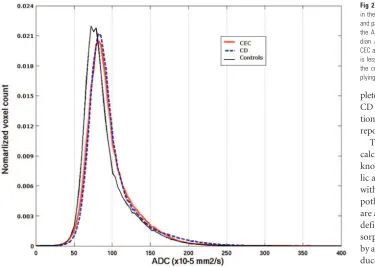
Table 2 details the results of the whole-brain histogram analyses of the ADC and MTR maps and of the normalized brain volume. A rightward shift of the ADC histogram with significantly higher value of the median ADC compared with healthy control subjects was observed in CEC (P⫽.006) and CD (P⫽.01) patients (Fig 2). Compared with healthy control subjects, patients with CEC also showed a significant increase in the 25th percentile value and a significant decrease of kur-tosis and skewness. No significant differences were observed between the 3 groups concerning the 75th percentile. The dif-ferences between the 3 groups of subjects for MTR metrics were mild and nonsignificant.
No significant difference of the normalized brain volume was observed among the 3 subject groups. No cluster of signif-icantly increased ADC was demonstrated in any of the 3 sub-ject groups by SPM2 analysis.
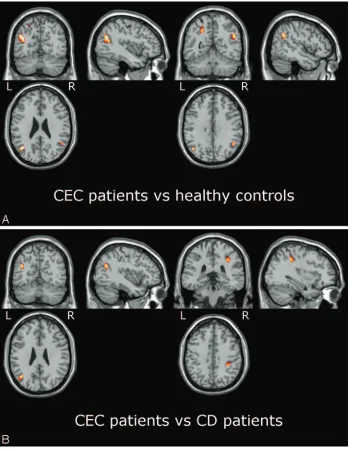
In the patients with CEC, compared with healthy subjects, SPM2 showed areas of significantly decreased MTR in the sub-cortical WM of the parietal lobe, bilaterally, and left temporal lobe (Fig 3Aand Table 3). Essentially the same areas of de-creased MTR were also identified when comparing patients with CEC and patients with CD (Fig 3B). In this instance, however, the difference did not reach the statistical threshold chosen for multiple comparison (Table 4). SPM2 revealed no significant differences between MTR maps of CD and healthy control subjects. The focal areas of decreased MTR in patients with CEC did not correlate with the cerebral calcium extent score.
Discussion
CD is an autoimmune disease characterized by chronic in-flammation in the wall of the small intestine caused by a per-manent intolerance to gluten protein. Epilepsy prevalence in CD ranges between 1.2% and 5% of all CD cases.5,25,26The CEC syndrome is a rare clinical condition; most cases are ob-served in Italy, Spain, and South America.3Whether CEC is the consequence of an untreated CD, a genetic syndrome, or both has yet to be established.3
Epilepsy in CEC is characterized by occipital seizures and has a variable evolution. In fact, seizures may respond well to treatment or may be drug-resistant. The condition can also evolve into an epileptic encephalopathy that is associated with
[image:3.585.300.534.40.603.2]mental deterioration.3,6EEG shows focal abnormalities local-ized over 1 or both occipital lobes or diffuse paroxysms.5,27
CT demonstration of cerebral calcifications is an impor-tant clue to the diagnosis of CEC and in epileptic patients should prompt investigation for CD.3 Typical calcifications are located in the occipital regions and appear as bilateral, linear, or flocculonodular, cortical or subcortical, roughly symmetrical or asymmetrical hyperdense areas.3,28There is no brain atrophy. Calcifications of CEC are generally stable.26 Al-though GFD may be effective in controlling epilepsy,3,5,29its usefulness in preventing or arresting brain calcifications in patients with CD with epilepsy has not been documented.
The possibility that some patients have an incomplete CEC triad is recognized.3Patients with epilepsy and cerebral calcifica-tions without CD are supposed to have CEC syndrome with silent or latent CD, and patients with CD and focal occipital epilepsy without cerebral calcifications are considered to have an
incom-plete form of CEC. Patients with CD and typical cerebral calcifica-tions without epilepsy were also reported.3
The mechanism underlying calcifications in CEC is un-known.3Low serum levels of fo-lic acid are common in patients with CEC.3 However, the hy-pothesis that the calcifications are a consequence of a folic acid deficiency because of malab-sorption, possibly exacerbated by antiepileptic drugs, which re-duce folic acid absorption,29is at variance with the observation that only a very small percentage of patients with CD without epilepsy have cerebral calcifications.5,13Hence, it has been hy-pothesized that calcifications might merely represent an epi-phenomenon of the underlying disease process.1
In line with prior reports4,6,30MR imaging in our patients with CEC demonstrated moderate or extensive calcifications as areas of hypointensity in T2*-weighted images. Moreover, it showed few small focal cerebral WM hyperintense areas in 50% of patients with CEC and 37% of patients with CD. In our opinion, these WM lesions are related to CD rather than CEC. In fact, taking into account that our patients with CEC and CD were adults, our findings are in line with the 20% prevalence of similar WM lesions demonstrated by MR imaging in pediatric patients with CD on GFD and assumed to be ischemic in ori-gin as a result of vasculitis or caused by inflammatory demyelination.13
ADC and MTR provide sensitive, quantitative, and
[image:4.585.55.535.60.212.2]reproduc-Fig 2.Averaged whole-brain ADC histograms in the 3 groups of subjects. Patients with CEC and patients with CD show a rightward shift of the ADC values, implying increase of the me-dian ADC value. In addition in patients with CEC and patients with CD, the histogram peak is less sharp, implying a reduced kurtosis, and the curve asymmetry is less pronounced, im-plying a reduced skewness.
Table 2: Whole-brain histogram analysis of the ADC and MTR maps and SIENAX results in the three groups of subjects
CEC (n⫽10) CD (n⫽8)
Healthy Subjects (n⫽17) ADC (⫻10⫺3mm2/s)
25th Percentile 0.75⫾0.02* 0.69⫾0.04 0.72⫾0.02
50th Percentile 0.88⫾0.04* 0.89⫾0.05† 0.83⫾0.03
75th Percentile 1.07⫾0.09 1.15⫾0.15 1.08⫾0.11
Kurtosis 3.88⫾0.46* 4.53⫾0.52 4.96⫾0.77
Skewness 0.99⫾0.25* 1.32⫾0.36 1.42⫾0.21
MTR
25th Percentile 46.44⫾2.94 48.55⫾2.09 48.55⫾2.16
50th Percentile 49.79⫾2.71 51.44⫾2.45 51.80⫾2.03
75th Percentile 52.61⫾2.60 54.03⫾2.60 54.86⫾2.07
Kurtosis 14.85⫾4.03 16.91⫾3.92 16.36⫾3.86
Skewness ⫺2.56⫾0.50 ⫺2.83⫾0.52 ⫺2.62⫾0.76
Normalized brain volume (mm3) 1,462,447⫾39,769 1,486,052⫾127,408 1,470,909⫾75,721
Note:—ADC indicates apparent diffusion coefficient; MTR, magnetization transfer ratio; SIENAX, structural image evaluation, using normalization of atrophy, single time-point version; CEC, celiac disease, epilepsy, and cerebral calcifications; CD, celiac disease.
[image:4.585.53.428.252.519.2]ible information about physicochemical properties of the brain, which is relatively independent from MR signal intensity changes.10-12,31,32
In our study, we evaluated whole-brain ADC and MTR maps with histogram and voxel-based analyses. The 2 types of analysis share the capability to examine the whole brain in an automatic way but have different advantages and drawbacks that make them complementary. In fact, a histogram provides a mea-surement of the global brain damage and might better assess the effect of gluten sensitivity on the brain, whereas voxel-based methods are suitable for evalua-tion of focal abnormalities possi-bly associated with epilepsy.
We observed a significant in-crease of the median ADC in pa-tients with either CD or CEC compared with healthy control subjects. The diffuse ADC ab-normality was more prominent in CEC, in which an increase of the 25th percentile and a de-crease of kurtosis and skewness of the ADC histogram compared with control subjects were also present, indicating a higher degree of damage. Similar changes of the ADC histogram metrics were reported in patients with mul-tiple sclerosis.32The discrepancy between ADC and MTR
[image:5.585.53.406.41.492.2]histo-Fig 3. SPM2 results showing areas of de-creased MTR in patients with CEC versus healthy control subjects (A) and versus patients with CD (B) superimposed on anatomic refer-ences. In patients with CEC, areas of signifi-cantly (PFDRcorr⬍0.05) decreased MTR com-pared with control subjects (A) include the white matter of the parietal lobe bilaterally (see Table 3; unthresholded statistical map is provided as supplemental Fig 2). Compared with patients with CD (B), the patients with CEC show areas of decreased MTR (Puncorr⬍ 0.001) in the white matter of the left temporal lobe and right parietal lobe (see Table 3).
Table 3: Coordinates of the clusters of reduced MTR in the patients with CEC versus healthy control subjects
Structure
MNI Coordinate (x y z)
P
(Uncorrected)
P(Corrected) Cluster Size
(mm3)
FWE FDR
Left temporal lobe middle temporal gyrus WM ⫺38⫺62 24 ⬍.001 .007 .015 2465
Left parietal lobe precuneus WM ⫺26⫺60 54 ⬍.001 .025 .015 1768
Right parietal lobe supramarginal gyrus WM 50⫺54 32 ⬍.001 .028 .015 1000
Note:—MTR indicates magnetization transfer ratio; CEC, celiac disease, epilepsy, and cerebral calcifications; FDR, false discovery rate; FWE, family-wise error; WM, white matter.
Table 4: Coordinates of the clusters of reduced MTR in the patients with CEC versus patients with CD
Structure
MNI Coordinate (x y z)
P
(Uncorrected)
P(Corrected) Cluster Size
(mm3)
FWE FDR
Left temporal lobe middle temporal gyrus WM ⫺40⫺62 26 ⬍.001 .136 .191 1160
Right parietal lobe inferior parietal lobule WM 34⫺38 40 ⬍.001 .162 .191 960
[image:5.585.52.532.570.627.2] [image:5.585.54.532.659.713.2]gram findings in our study might arise from the fact that, whereas ADC is sensitive to the microscopic structure, MTR reflects the bound-to-free water ratio and could be a less sensitive marker of tissue change.
Although the voxel-based analysis of ADC failed to show significant focal abnormalities in patients with CEC, voxel-based analysis of MTR maps demonstrated a localized bilateral decrease of the MTR in the parietal and temporal subcortical WM com-pared with healthy control subjects. Interestingly, the same areas of decreased MTR in the parietal and temporal subcortical WM were identified in comparing patients with CEC and patients with CD, suggesting that they could be correlated to epilepsy.
We hypothesize that the areas of localized decrease of the MTR correspond to areas of gliosis. In fact, in the few cases of CEC in which pathologic examination was available, gliosis variably combined with axonal loss, and wallerian degenera-tion was found in addidegenera-tion to cerebral calcificadegenera-tions.3,33-35 Moreover, a study in an experimental animal model36 indi-cated that gliosis is associated with a decrease of MTR.
Whether these areas of decreased MTR in the parietal and temporal subcortical WM are cause or consequence of epilepsy in the CEC syndrome is an open question. The following 2 argu-ments support the hypothesis that they may have a possible epi-leptogenic role. First, electroencephalographic abnormalities were documented outside the occipital lobes in 6 of our 10 pa-tients with CEC. Second, there is growing evidence that a focal decrease of MTR might be linked to epileptogenesis.12,37-39In particular, in patients with neurocysticercosis, a closer correlation of epilepsy with perilesional gliosis appearing as a focal area of decreased MTR rather than with calcification was reported.37-39
We recognize 2 limitations of our study. First, we did not obtain CT examinations concurrently with MR. Coregistra-tion of CT and MR examinaCoregistra-tion should be considered in fu-ture studies. Second, we did not examine patients with CD and epilepsy without calcifications. This would have improved our understanding of the relationship between the focal MTR ab-normalities and epilepsy.
Conclusion
Our study indicates that diffusion and MT techniques are also capable of revealing abnormalities undetected by MR imaging in patients with CEC. In particular, patients with CEC syndrome show an increase of the whole-brain ADC histogram, which is more pronounced than in patients with gluten intolerance. In patients with CEC, voxel-based analysis demonstrates a localized decrease of the MTR in the parieto-temporal subcortical WM, which might have a role beside cerebral calcifications in epilepto-genesis. Further studies including ADC and MTR evaluation in patients with CD and epilepsy without calcifications are worthy to elucidate CEC pathophysiology.
References
1. Taylor I, Scheffer IE, Berkovic SF.Occipital epilepsies: identification of specific and newly recognized syndromes.Brain2003;126:753– 69
2. Hernandez MA, Colina G, Ortigosa L.Epilepsy, cerebral calcifications and clinical or subclinical coeliac disease. Course and follow up with gluten-free diet.Seizure1998;7:49 –54
3. Gobbi G.Coeliac disease, epilepsy and cerebral calcifications.Brain Dev
2005;27:189 –200
4. Triulzi F.Neuroradiological findings in celiac disease, epilepsy and cerebral calcifications.In: Gobbi G, Andermann F, Naccarato S, et al, eds.Epilepsy and Other Neurological Disorders in Coeliac Disease. London: John Libbey & Co; 1997:187–94
5. Magaudda A, Dalla Bernardina B, Magazzu` G, et al.Bilateral occipital calcifi-cations, epilepsy and coeliac disease: report of 22 cases and prevalence study of calcifications in epilepsy and coeliac disease.In: Gobbi G, Andermann F, Naccarato S, et al, eds.Epilepsy and Other Neurological Disorders in Coeliac Dis-ease. London: John Libbey & Co; 1997:121–32
6. Magaudda A, Della Bernardina B, De Marco P, et al.Bilateral occipital calcifi-cation, epilepsy and celiac disease: clinical and neuroimaging features of a new syndrome.J Neurol Neurosurg Psychiatry1993;56:885– 89
7. Santos CH, Almeida IL, Gomes MD, et al.Bilateral occipital calcification, epilepsy and coeliac disease: case report.Arq Neuropsiquiatr2002;60:840 – 43
8. Ferini-Strambi L, Bozzali M, Cercignani M, et al.Magnetization transfer and diffusion-weighted imaging in nocturnal frontal lobe epilepsy.Neurology
2000;54:2331–33
9. Arfanakis K, Herman BP, Rogers BP, et al.Diffusion tensor MRI in temporal lobe epilepsy.Magn Reson Imaging2002;20:511–19
10. Rugg-Gunn FJ, Eriksson SH, Symms MR, et al.Diffusion tensor imaging of cryptogenic and acquired partial epilepsies.Brain2001;124:627–36 11. Eriksson SH, Rugg-Gunn FJ, Symms MR, et al.Diffusion tensor imaging in
patients with epilepsy and malformations of cortical development.Brain
2001;124:617–26
12. Rugg-Gunn FJ, Eriksson SH, Boulby PA, et al.Magnetization transfer imaging in focal epilepsy.Neurology2003;60:1638 – 45
13. Kieslich M, Errazuriz G, Posselt HG, et al.Brain white-matter lesions in celiac disease: a prospective study of 75 diet-treated patients.Pediatrics2001;108:E21 14. Rorden C, Brett M. Stereotaxic display of brain lesions. Behav Neurol.
2000;12:191–200
15. Smith S. Fast robust automated brain extraction. Hum Brain Map
2002;17:143– 45
16. Ashburner J, Friston K.Multimodal image co-registration and partitioning-a unified framework.Neuroimage1997;6:209 –17
17. Foong J, Symms MR, Barker GJ, et al.Neuropathological abnormalities in schizophrenia: evidence from magnetization transfer imaging. Brain
2001;124:882–92
18. Leung LH, Ooi GC, Kwong DL, et al.White-matter diffusion anisotropy after chemo-irradiation: a statistical parametric mapping study and histogram analysis.Neuroimage2003;21:261– 68
19. Bruno SD, Barker GJ, Cercignani M, et al.A study of bipolar disorder using magnetization transfer imaging and voxel-based morphometry. Brain
2004;127:2433– 40
20. Smith SM, Zhang Y, Jenkinson M, et al.Accurate, robust and automated lon-gitudinal and cross-sectional brain change analysis. NeuroImage
2002;17:479 – 89.
21. Smith SM, Jenkinson M, Woolrich MW, et al.Advances in functional and structural MR image analysis and implementation as FSL.NeuroImage
2004;23:208 –19.
22. Good CD, Johnsrude IS, Ashburner J, et al.A voxel-based morphometric study of ageing in 465 normal adult human brains.Neuroimage2001;14:21–36 23. Ashburner J, Friston KJ.Voxel-based morphometry-the methods.Neuroimage
2000;11:805–21
24. Nichols T, Hayasaka S.Controlling the family wise error rate in functional neuroimaging: a comparative review.Stat Methods Med Res2003;12:419 – 46 25. Luostarinen L, Pirttila T, Collin P.Coeliac disease presenting with neurological
disorders.Eur Neurol1999;42:130 –35
26. Chapman RWG, Laidlow JL, Colin-Jones DG, et al.Increased prevalence of epilepsy in celiac disease.BMJ1978;2:250 –51
27. Gobbi G, Sorrenti G, Cantucci M, et al. Epilepsy with bilateral occipital calcifications: a benign onset with progressive severity.Neurology1988;38:913–20 28. Longo M, Magaudda A, Dalla Bernardina B, et al.Sindrome delle calcificazioni occipitali bilaterali, epilessia e malattia celiaca. Diagnosi differenziale con la sindrome di Sturge-Weber. Studio multicentrico in 20 casi.In: Neuroradiolo-gia 1992. Scotti G, ed. Udine: Edizioni del Centauro; 1992:109 –12
29. Ambrosetto G, Antonini L, Tassinari CA.Occipital lobe seizures related to clini-cally asymptomatic celiac disease in adulthood.Epilepsia1992;23 Suppl 4: 476 – 81 30. Lea ME, Harbord M, Sage MR.Bilateral occipital calcification associated with celiac disease, folate deficiency, and epilepsy. AJNR Am J Neuroradiol
1995;16:1498 –500
31. Rovaris M, Iannucci G, Cercignani M, et al.Age-related changes in conven-tional, magnetization transfer, and diffusion-tensor MR findings: study with whole-brain tissue histogram analysis.Radiology2003;227:731–38 32. Cercignani M, Bozzali M, Iannucci G, et al.Magnetization transfer ratio and
mean diffusivity of normal appearing white and gray matter from patients with multiple sclerosis.J Neurol Neurosurg Psychiatry2001;70:311–17 33. Taly AR, Nagaraja D, Das S, et al.Sturge-Weber-Dimitri disease without facial
nevus.Neurology1987;37:1063– 64
34. Bye AME, Andermann F, Robitaille Y, et al.Cortical vascular abnormalities in the syndrome of celiac disease, epilepsy, bilateral occipital calcifications, and folate deficiency.Ann Neurol1993;34:399 – 403
35. Toti P, Balestri P, Cano M, et al.Celiac disease with cerebral calcium and silica deposits: x-ray spectroscopic findings, an autopsy study. Neurology
1995;46:1088 –92
diffuse axonal injury following experimental brain injury in the pig: charac-terization by magnetization transfer ratio with histopathologic correlation.
J Comput Assist Tomogr1996;20:540 – 46
37. Pradhan S, Kathuria MK, Gupta RK.Perilesional gliosis and seizure outcome: a study based on magnetizaztion transfer magnetic resonance imaging in pa-tients with neurocysticercosis.Ann Neurol2000;48:181– 87
38. Kumar R, Gupta RK, Husain M, et al.Magnetization transfer MR imaging in patients with post-traumatic epilepsy.AJNR Am J Neuroradiol2003;23: 218 –24
39. Agarwal A, Raghav S, Husain M, et al.Epilepsy with focal cerebral calcification: role of magnetization transfer MR imaging.Neurol India