ORIGINAL RESEARCH
Diffusion Anisotropy and Diffusivity of White
Matter Tracts Within the Temporal Stem in
Alzheimer Disease: Evaluation of the “Tract of
Interest” by Diffusion Tensor Tractography
T. Taoka S. Iwasaki M. Sakamoto H. Nakagawa A. Fukusumi K. Myochin S. Hirohashi T. Hoshida K. Kichikawa
PURPOSE:Our aim was to determine whether diffusion anisotropy and diffusivity of white matter tracts of the temporal stem in patients with Alzheimer (AD) can be evaluated independently by using diffusion tensor tractography.
MATERIALS AND METHODS: Subjects included 15 patients with AD (11 women and 4 men; mean age, 74 years) and 15 age-matched control subjects (11 women and 4 men; mean age, 72 years). Diffusion tensor images were acquired by using echo-planar imaging. We drew tractographies of the uncinate fasciculus, inferior occipitofrontal fasciculus, and Meyer’s loop, with diffusion tensor analysis software. We measured diffusion anisotropy, diffusivity, and the number of voxels along the “tracts of interest” and used the Studentttest to compare results between patients with AD and controls.
RESULTS: Values of diffusion anisotropy of the bilateral uncinate fasciculus and left inferior occipito-frontal fasciculus were significantly lower for patients with AD than for controls. Also, values of diffusivity in the bilateral uncinate fasciculus were significantly greater for patients with AD than for controls. There was no significant difference in diffusion anisotropy or diffusivity along Meyer’s loop between the 2 groups. There was no significant difference in the number of voxels included in all constructed tracts between patients with AD and controls.
CONCLUSION:White matter tracts of the temporal stem can be evaluated independently by using diffusion tensor tractography, which appears to be a promising technique for determining changes in white matter in degenerative diseases.
T
he temporal stem is a white matter region that bridges the temporal lobe and frontal lobe.1Studies indicate that Alz-heimer disease (AD) is associated with changes in the white matter of the temporal stem and increased diffusivity and de-creased diffusion anisotropy in the temporal stem.2,3How-ever, the temporal stem contains several white matter tracts, including the anterior commissure, uncinate fasciculus, infe-rior occipitofrontal fasciculus, and Meyer’s loop of the optic tract. Consequently, measuring diffusivity and diffusion an-isotropy of these tracts by positioning the region of interest on the temporal stem produces data that are of mixed value. In the present study, to evaluate diffusivity and diffusion anisot-ropy of specific “tracts of interest” within the temporal stem, we used diffusion tensor tractography to delineate tracts within the temporal stem, and measured mean diffusivity and diffusion anisotropy along the tracts. The tracts of interest we chose for evaluation were the uncinate fasciculus, inferior oc-cipitofrontal fasciculus, and Meyer’s loop. The uncinate fas-ciculus is believed to play a role in cognitive and memory function. Although the functional significance of the inferior occipitofrontal fasciculus is not well understood, it is believed to be involved in certain types of cognitive impairment.4The hypotheses of the present study were as follows: connectivity of white matter tracts (which is associated with cognitive func-tion) is impaired in cases of AD; changes in diffusion
anisot-ropy and diffusivity of the tract of interest can be effectively evaluated by diffusion tensor analysis; and the Meyer’s loop, which was included as a control, is not affected by the changes in white matter that are associated with AD.
Materials and Methods
Subjects
The subjects of this prospective study were patients with AD and age-matched controls. Nineteen patients who were clinically nosed with AD underwent MR imaging examinations. Clinical diag-noses of AD were based on DSM-IV criteria and examination of cog-nitive status. Informed consent for the imaging study was obtained from all patients or their families after the nature of the procedures had been fully explained. After the imaging examination, patients with unsatisfactory diffusion tensor results due to artifacts from pa-tient motion or metallic dental implants were excluded from the study population (3 patients). Patients with cortical infarctions on T2-weighted images were also excluded (1 patient), whereas patients with small lacunae in white matter (⬍5 lesions on T2-weighted im-ages) were included. Thus, a total of 15 patients with AD (11 women and 4 men) were included in the study. They ranged in age from 63 to 87 years (mean, 74 years) (Table 1). Fifteen age-matched controls (11 women and 4 men) were included, and they underwent the same imaging examination as the patients with AD. They ranged in age from 62 to 81 years (mean age, 72 years). The control group did not include patients with dementia or cortical infarctions on T2-weighted images. The clinical status of the control group was as follows: 5 pa-tients with small acoustic neurinoma (⬍1 cm in diameter) and 10 patients undergoing a screening examination for metastatic brain tu-mor (no tutu-mors were observed on MR images).
The cognitive status of each patient was evaluated by using a Mini-Received June 15, 2005; accepted after revision September 29.
From the Department of Radiology (T.T., M.S., H.N., A.F., K.M., S.H., K.K.), Nara Medical University; the Department of Radiology (S.I.), Higashiosaka City General Hospital; and the Department of Neurosurgery (T.H.), Nara Prefectural Nara Hospital, Nara, Japan.
Mental State Examination (MMSE) (Table 1). Twelve of the patients with AD also underwent examinations using the Alzheimer Disease Assessment Scale (ADAS). The MMSE scores of the patients with AD ranged from 4 to 22 (mean, 15.0), and the ADAS scores ranged from 15.0 to 59.7 (mean, 27.8).
Imaging and Data Analysis
A 1.5T clinical MR unit (Magnetom Sonata, Siemens, Erlangen, Ger-many) was used to obtain diffusion tensor images. Diffusion-weighted images were obtained by using echo-planar imaging (EPI, TR/TE, 2300/122 ms; b⫽1000 seconds/mm2; 6-axis encoding; field of view (FOV), 230 mm; matrix, 128⫻128; section spacing, 3.3 mm; section thickness, 3 mm; averaging, 6). We obtained 35 section im-ages, covering the entire brain. We also acquired regular structural T1-weighted (spin-echo; TR/TE, 500/20) and T2-weighted (turbo spin-echo; TR/TE, 3000/105) images.
Diffusion tensors were computed and fiber-tract maps were cre-ated by using a PC workstation with “dTV II” diffusion tensor imag-ing software developed by Masutani et al5(University of Tokyo, dif-fusion tensor visualizer, version 2, available at http://www.ut-radiology.umin.jp/people/masutani/dTV.htm).6Interpolation along thez-axis was performed to obtain isotropic data (voxel size, 0.89⫻ 0.89⫻0.89 mm). The eigenvector associated with the largest eigen-value or the principal axis was assumed to represent the local fiber direction. The tracking algorithm moved along the principal axis. The diffusion tensor at the next location was determined from the adja-cent voxels, and its principal axis was subsequently estimated. Track-ing lines were traced in this way and were propagated in antegrade and retrograde directions until the fractional anisotropy (FA) fell below an assigned threshold. FA threshold for tracking was set at 0.18, and stop length was set at 160 steps.
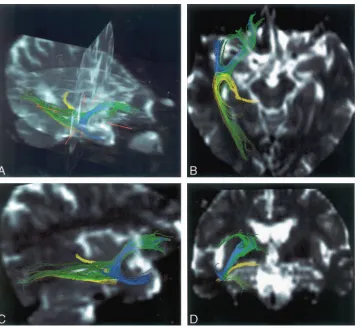
Tractographies of the uncinate fasciculus (blue in Fig 1) were ob-tained with the seed area in the white matter of the frontal lobe on coronal planes at the tip of the frontal horn of the lateral ventricle and with the target area in white matter on coronal planes at the tip of the inferior horn of the lateral ventricle in the ipsilateral temporal tip. Similarly, tractographies of the inferior occipitofrontal fasciculus (green in Fig 1) were obtained with the same seed area as the uncinate fasciculus and with the target area in the ipsilateral sagittal stratum on coronal planes at the level of the trigone. Tractographies of Meyer’s loop (yellow in Fig 1) were obtained with the seed area in the white
matter anterior to the lateral geniculate body and with the same target area as the inferior occipitofrontal fasciculus. The dTV II software has a function that calculates the mean FA and the apparent diffusion coefficient (ADC, seconds per square millimeter) along the structed tract and provides the number of voxels within the con-structed tract.We measured mean FA, ADC, and the number of the voxels along the bilateral uncinate fasciculus, inferior occipitofrontal fasciculus, and Meyer’s loop. First, to evaluate interobserver variation of FA, ADC, and the number of voxels within the constructed tracts, 2 neuroradiologists independently measured the values for the unci-nate fasciculus, inferior occipitofrontal fasciculus, and Meyer’s loop on both sides for 5 patients with AD and 5 controls. Correlation coefficients were evaluated between these 2 observers. Also, intraob-server variation was evaluated by 1 obintraob-server for the same subjects. Measurements were performed twice within a 6-month interval, and the correlation between both measurements was evaluated.
We measured the FA, ADC, and the number of voxels along the bilateral uncinate fasciculus, inferior occipitofrontal fasciculus, and Meyer’s loop for all 15 patients with AD and 15 controls. The Student ttest was used to compare the FA, ADC, and the number of voxels along the 3 tracts between control subjects and patients with AD.
To evaluate FA and ADC of the entire white matter—to eliminate the possibility that there were diffuse and non tract-specific FA or ADC changes—we used a medical image processing software (Dr. View Linux, Asahi-Kasei information systems, Tokyo, Japan) on a Linux workstation. We segmented the white matter by using the threshold of FA⫽0.3 and measured FA and ADC values of the entire white matter. The Studentttest was used to compare FA and ADC values between patients with AD and the control group.
Results
Tractographies of the bilateral uncinate fasciculus could be obtained as semicircular tracts connecting the frontal lobe and temporal tip in all patients with AD and controls. Similarly, tractographies of the inferior occipitofrontal fasciculus could be obtained as a linear tract connecting the frontal lobe and the occipital lobe, and tractography of Meyer’s loop could be ob-tained as a U-shaped tract connecting the lateral geniculate body and the occipital lobe in all patients with AD and con-trols (Fig 1).
Correlation coefficients between FA values by 2 observers were 0.88 for patients with AD and 0.86 for controls. For ADC values, the correlation coefficients were 0.78 for patients with AD and 0.88 for controls. For the number of voxels within constructed tracts, the correlation coefficients were 0.77 for patients with AD and 0.84 for controls. There were statistically significant correlations (P⬍.001) between the 2 observers for patients with AD and controls. Correlation coefficients be-tween FA values after 2 measurements by the same observers were 0.89 for patients with AD and 0.86 for controls. For the number of voxels within constructed tracts, the correlation coefficients were 0.81 for patients with AD and 0.89 for con-trols. Correlation coefficients between the numbers of voxels within constructed tracts were 0.79 for patients with AD and 0.82 for controls. There were also statistically significant cor-relations (P⬍.001) between both measurements.
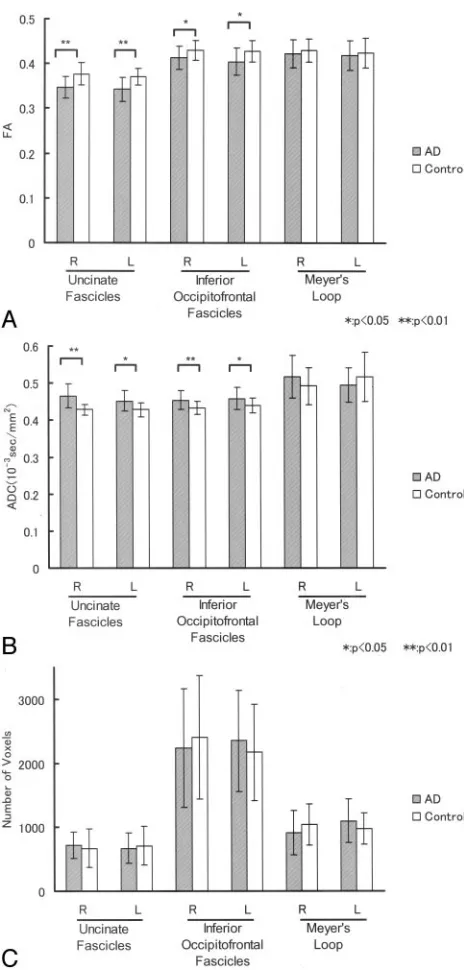
FA and ADC values of the uncinate fasciculus, inferior oc-cipitofrontal fasciculus, and Meyer’s loop for 15 patients with AD and 15 controls are shown in Fig 2. For patients with AD, mean FA values along the uncinate fasciculus were 0.35
(stan-Characteristics of the patients with Alzheimer disease
Patient No./
Age (y)/Sex ADAS MMSE
1/70/F 17.0 15
2/73/M 15.0 21
3/70/M N/A 19
4/73/M 21.7 14
5/72/F 59.7 4
6/70/F 39.6 8
7/76/F N/A 9
8/63/F 31.7 11
9/81/F 24.0 20
10/76/F 41.3 7
11/76/F N/A 22
12/87/F 29.0 20
13/68/M 17.0 21
14/75/F 17.0 19
15/76/F 29.0 15
Note:—MMSE indicates Mini-Mental State Examination; ADAS, Alzheimer disease as-sessment scale.
BRAIN
ORIGINAL
dard deviation [SD]⫽0.02) on the right side and 0.34 (SD⫽ 0.03) on the left side. For the control group, mean FA values along the uncinate fasciculus were 0.38 (SD⫽0.03) on the right side and 0.37 (SD⫽0.02) on the left side. On both sides of the uncinate fasciculus, patients with AD had significantly lower mean FA values (P⬍.01) than the control group. For patients with AD, mean ADC values along the uncinate fascic-ulus were 0.46⫻10⫺3seconds/mm2(SD⫽0.03⫻10⫺3
sec-onds/mm2) on the right side and 0.45⫻10⫺3seconds/mm2
(SD⫽0.03⫻10⫺3seconds/mm2) on the left side. For the
control group, mean ADC values along the uncinate fasciculus were 0.43⫻10⫺3seconds/mm2(SD⫽0.02⫻10⫺3seconds/
mm2) on the right side and 0.44⫻10⫺3seconds/mm2(SD⫽
0.02⫻10⫺3seconds/mm2) on the left side. For patients with
AD, the mean number of voxels included in the constructed tract of the uncinate fasciculus was 715.3 (SD⫽206.4) on the right side and 674.8 (SD⫽238.2) on the left side. For the control group, the mean number of voxels included in the uncinate fasciculus was 673.7 (SD⫽299.0) on the right side and 712.3 (SD⫽306.6) on the left side. On both sides of the uncinate fasciculus, there were no significant differences in the mean number of voxels between patients with AD and controls.
For patients with AD, mean FA values along the inferior occipitofrontal fasciculus were 0.41 (SD⫽0.03) on the right side and 0.40 (SD⫽0.03) on the left side. For the control group, mean FA values along the inferior occipitofrontal fas-ciculus were 0.43 (SD⫽0.02) on the right side and 0.43 (SD⫽ 0.02) on the left side. On both sides of the inferior occipito-frontal fasciculus, mean FA was significantly lower for the
pa-tients with AD than for the control group (P⬍.05). For pa-tients with AD, mean ADC values along the inferior occipitofrontal fasciculus were 0.45 ⫻ 10⫺3 seconds/mm2 (SD⫽0.02⫻10⫺3seconds/mm2) on the right side and 0.46⫻
10⫺3seconds/mm2(SD⫽0.03⫻10⫺3seconds/mm2) on the
left side. For the control group, mean ADC values along the inferior occipitofrontal fasciculus were 0.43⫻10⫺3seconds/ mm2(SD⫽0.02⫻10⫺3seconds/mm2) on the right side and
0.44⫻10⫺3seconds/mm2(SD⫽0.02⫻10⫺3seconds/mm2)
on the left side. On both sides of the inferior occipitofrontal fasciculus, there was no significant difference in mean ADC between patients with AD and controls.For patients with AD, the mean number of voxels included in the constructed tract of the inferior occipitofrontal fasciculus was 2238.9 (SD⫽ 921.2) on the right side and 2349.1 (SD⫽790.2) on the left side. For the control group, the mean number of voxels in-cluded in the inferior occipitofrontal fasciculus was 2406.9 (SD⫽959.5) on the right side and 2170.1 (SD⫽753.5) on the left side. On both sides of the inferior occipitofrontal fascicu-lus, there were no significant differences in the mean number of voxels between patients with AD and controls.
For patients with AD, mean FA values along Meyer’s loop were 0.42 (SD⫽0.03) on the right side and 0.42 (SD⫽0.03) on the left side. For the control group, mean FA values along Meyer’s loop were 0.43 (SD⫽0.03) on the right side and 0.42 (SD⫽0.03) on the left side. On both sides of Meyer’s loop, there was no significant difference in mean FA between pa-tients with AD and controls. For papa-tients with AD, mean ADC values along Meyer’s loop were 0.52⫻10⫺3seconds/mm2
(SD⫽0.06⫻10⫺3seconds/mm2) on the right side and 0.50⫻
[image:3.585.58.420.39.367.2]10⫺3seconds/mm2(SD⫽0.05⫻10⫺3seconds/mm2) on the
left side. For the control group, mean ADC values along Mey-er’s loop were 0.49⫻10⫺3seconds/mm2(SD⫽0.05⫻10⫺3
seconds/mm2) on the right side and 0.52⫻10⫺3 seconds/ mm2(SD⫽0.07⫻10⫺3seconds/mm2) on the left side. On
both sides of Meyer’s loop, there was no significant difference in mean ADC between patients with AD and controls. For patients with AD, the mean number of voxels included in con-structed tract of Meyer’s loop was 914.7 (SD⫽347.7) on the right side and 1096.5 (SD⫽339.2) on the left side. For the control group, the mean number of voxels included in Meyer’s
loop was 1038.4 (SD⫽323.6) on the right side and 976.8 (SD⫽249.2) on the left side. On both sides of Meyer’s loop, there were no significant differences in the mean number of voxels between patients with AD and controls.
FA of the entire white matter was 0.43 (SD⫽0.02) in pa-tients with AD and 0.43 (SD⫽0.03) in the control group. There were no statistically significant differences between groups. ADC of the entire white matter was 0.88⫻10 –3 sec-onds/mm2 (SD⫽0.05 ⫻10 –3 seconds/mm2) in patients with AD and 0.90⫻10 –3 seconds/mm2 (SD⫽0.05⫻10 –3 seconds/mm2) in the control group. There were also no sta-tistically significant differences between patients with AD and the control group.
Discussion
White matter loss in patients with AD has been well docu-mented.7In several recent studies, diffusion phenomena in the white matter of patients with AD has been measured.2,3,8 –11
Most of those studies show decreased diffusion anisotropy and increased diffusivity of white matter in patients with AD. Such changes in diffusion anisotropy and diffusivity reflect de-creased fiber attenuation, which can involve disruption and loss of axonal membranes or myelin.2This decreased fiber
attenuation may be secondary to the loss of neurons in the cortex. Takahashi et al10reported that reduced FA values in the
white matter of patients with AD reflected the distribution of neurofibrillary tangles, which may cause degeneration of pro-jection fibers in the white matter. Bozzali et al9reported that AD-associated microstructural white matter pathology in-volves certain white matter regions that are connected to the association cortices, such as the corpus callosum and white matter of the temporal, frontal, and parietal lobes, whereas white matter areas subserving motor or visual function are relatively unaffected by such pathology. These findings suggest that Wallerian degeneration of white matter fiber tracts sec-ondary to neuronal loss in the associative cortex is a major contributing factor of AD-associated changes in white matter. The temporal stem is the white matter bridge connecting the frontal lobe and temporal lobe. The anterior limit of the temporal stem is the amygdaloid body, and the posterior limit is the lateral geniculate body. The temporal stem contains the anterior commissure, inferior thalamic radiation, uncinate fasciculus, posterior occipitofrontal fasciculus, and Meyer’s loop.
The uncinate fasciculus is a white matter tract that connects the orbital gyrus in the frontal lobe and the anterior part of the temporal lobe. It is the largest of the fiber bundles connecting the frontal and temporal lobes and contains cholinergic fibers from the basal nucleus of Meynert that innervate cortical re-gions.12The uncinate fasciculus also contains fibers from the
amygdaloid body and the cortex of the anterior temporal lobe. The fibers merge in the white matter of the middle temporal lobe and pass over the lateral nucleus of the amygdaloid body on their way to the limen insula. After the fibers pass the ex-ternal capsule and extreme capsule, they reach the frontal lobe in a fanlike arrangement in the frontal-orbital white matter. An experimental study indicated that disruption of connec-tions in the uncinate fasciculus can cause severe memory im-pairment.4,13Another study suggested that disruption of
[image:4.585.53.285.38.523.2]bers in the uncinate fasciculus that connect the temporal and frontal lobes can cause posttraumatic retrograde amnesia.4,14
The inferior occipitofrontal fasciculus connects the occip-ital lobe and frontal lobe. It also contains fibers that connect the frontal lobe with the posterior part of the parietal and temporal lobes. Fan-shaped fibers from the cortex of the lat-eral aspect of the frontal lobe converge into a bundle that passes along the lateral inferior aspect of the lentiform nucleus at the inferior aspect of the claustrum and superior to the uncinate fasciculus. In the region of the extreme and external capsules, there is some merging of the uncinate fasciculus and inferior occipitofrontal fasciculus. The tract runs posteriorly in the temporal lobe and connects to the occipital lobe. The uncinate fasciculus and the inferior occipitofrontal fasciculus are involved in extratemporal lesions that trigger temporal lobe syndromes, such as visual hallucinations; lesions of the inferior occipitofrontal fasciculus and several other tracts re-portedly contribute to global aphasia.4
In the present study, we used Meyer’s loop as a control within the temporal stem. The ventral temporal loop of the optic tract fiber originates in the ventrolateral part of the lat-eral geniculate body and runs forward and latlat-erally to the tem-poral pole. This fiber forms a steep curve around the tip of the inferior horn of the lateral ventricle (Meyer’s loop) and runs backward through the sagittal stratum to terminate in the lower calcarine lip. The anterior part of Meyer’s loop contains fibers corresponding to the medial part of the upper quadrant visual field, and certain fibers in the posterior part of Meyer’s loop correspond to the lateral part of the upper quadrant vi-sual field.15,16
Previous studies have shown decreased diffusion anisot-ropy and increased diffusivity in the temporal stem of patients with AD.2,3In those studies, diffusion anisotropy and diffusiv-ity were measured by positioning regions of interest in the temporal stem. Such region-of-interest studies are useful be-cause they illustrate changes in diffusion status in the temporal stem of patients with AD, but they have certain limitations, one of which is that positioning a region of interest is a delicate procedure and reproducibility is not guaranteed unless stan-dardization or another preparation procedure is performed. In AD, the temporal stem is frequently atrophied, and inter-individual variation in the degree of atrophy increases the dif-ficulty and delicacy of positioning of a region of interest. In addition, positioning of an identical region of interest in fol-low-up studies is very difficult because of the difficulty in sec-tion posisec-tioning at the time of scanning. A second limitasec-tion is that when using the region-of-interest method in an atrophied brain, the partial volume effect of CSF, which has very high diffusivity and very low diffusion anisotropy, can affect mea-surements, especially if the brain is significantly atrophied.17A
third limitation is that the temporal stem includes various tracts, and the region-of-interest method, therefore, cannot isolate specific tracts for analysis. The values of diffusion an-isotropy and diffusivity acquired by using the region-of-inter-est method are summations of values for various tracts. There have been studies in which standardization methods such as Statistical Parametric Mapping (SPM) software (Wellcome Department of Cognitive Neurology, University College, Lon-don, UK) have been used for evaluation of diffusion tensor images of structural disorders such as epilepsy.18,19However,
standardization does not guarantee that identical spatial posi-tions correspond to identical neuronal tracts, especially when there is volume loss in the focal brain.
To overcome these limitations of region-of-interest meth-ods, we used a coregistered tractography method to measure diffusion anisotropy and diffusivity of tracts of interest within the temporal stem of patients with AD. The software we used (dTV II) provides a tracking-line voxelization function, which voxelizes the tracking line of the white matter tract in the orig-inal tensor image. We can measure mean diffusion anisotropy and diffusivity of coregistered voxels along the drawn tracking lines. Using this method, we can evaluate an isolated tract separately, even within the temporal stem, which contains var-ious fiber tracts oriented in varvar-ious directions in complicated conformations and can, thus, exclude effects of adjacent tracts on the tract of interest.
In the present study, in which we used the tract-of -interest method, mean FA was significantly lower for the patients with AD than for the controls at both sides of the uncinate fascicu-lus and at the left inferior occipitofrontal fascicufascicu-lus. Also, the patients with AD had significantly higher mean ADC than the controls at the left uncinate fasciculus and right inferior occip-itofrontal fasciculus. There were no significant differences in FA or ADC along Meyer’s loop. We could eliminate the pos-sibility that there is diffuse and non tract-specific FA or ADC changes by showing that there are no significant differences in FA and ADC of the entire white matter between patients with AD and controls. We were able to decrease the arbitrariness of the positioning of regions of interest in the temporal stem, exclude the influence of the partial volume effect of CSF, and obtain tract-specific measurements of the isolated white mat-ter tract of the temporal stem. We set the seed area and target area uniformly in this study. As a result, the interobserver and intraobserver variations are small and statistically significant agreement was shown. Another possible advantage of this method is that the FA and ADC of a tract of interest may indicate the degree of neuronal impairment in the corre-sponding cerebral cortex. Although the identical threshold (FA⫽0.18) for tracking was used and mean FA values were higher in the control cases in some tracts, there were no statis-tically significant differences in the number of voxels between patients with AD and controls. This finding is likely because the mean FA values ranged from 0.3 to 0.4 for each tract, which is much larger than those of the threshold, and SDs of the FA were not⬎0.04. Thus, the voxel numbers included by the threshold of FA⫽0.18 (ie, mean minus more than 3 SDs) did not have correlation with the mean FA of the constructed tracts.
groups, and the SD was very large. This finding may indicate that there is some instability in drawing tractography and that the constructed tract is not identical among subjects. Despite this instability in constructing the tract, FA and ADC values of the tract showed rather small SD values and stable results. Possible reasons for this discrepancy in findings are as follows: First, there are numerous fiber tracts in the real brain, and tensor tractography is one technique to extract part of them. Second, even when the constructed tract is not identical, as the tracts are extracted from another population with similar FA or ADC values, FA or ADC values in constructed or extracted tracts become stable.
In conclusion, by using the present tract-of-interest method, we were able to independently evaluate white matter tracts in the temporal stem. Results showed decreased anisot-ropy and increased diffusivity within the uncinate fasciculus and inferior occipitofrontal fasciculus in patients with AD. Although a relationship to functional impairment, such as im-paired connectivity, is not proved, this method can provide tract-specific information on anisotropy and diffusivity. The tract-of-interest method will be a promising technique for evaluating specific tracts in degenerative diseases such as AD.
References
1. Ebeling U, von Cramon D.Topography of the uncinate fascicle and adjacent temporal fiber tracts.Acta Neurochir (Wien)1992;115:143– 48
2. Hanyu H, Sakurai H, Iwamoto T, et al.Diffusion-weighted MR imaging of the hippocampus and temporal white matter in Alzheimer’s disease.J Neurol Sci
1998;156:195–200
3. Kantarci K, Jack CR Jr, Xu YC, et al.Mild cognitive impairment and Alzheimer disease: regional diffusivity of water.Radiology2001;219:101– 07
4. Kier EL, Staib LH, Davis LM, et al.MR imaging of the temporal stem: anatomic dissection tractography of the uncinate fasciculus, inferior occipitofrontal fasciculus, and Meyer’s loop of the optic radiation.AJNR Am J Neuroradiol
2004;25:677–91
5. Masutani Y, Aoki S, Abe O, et al.MR diffusion tensor imaging: recent advance and new techniques for diffusion tensor visualization.Eur J Radiol2003;46: 53– 66
6. Kunimatsu A, Aoki S, Masutani Y, et al.Three-dimensional white matter trac-tography by diffusion tensor imaging in ischaemic stroke involving the corti-cospinal tract.Neuroradiology2003;45:532–35
7. Lee BC, Mintun M, Buckner RL, et al.Imaging of Alzheimer’s disease.J Neu-roimaging2003;13:199 –214
8. Yoshiura T, Mihara F, Ogomori K, et al.Diffusion tensor in posterior cingulate gyrus: correlation with cognitive decline in Alzheimer’s disease.Neuroreport
2002;13:2299 –302
9. Bozzali M, Falini A, Franceschi M, et al.White matter damage in Alzheimer’s disease assessed in vivo using diffusion tensor magnetic resonance imaging.
J Neurol Neurosurg Psychiatry2002;72:742– 46
10. Takahashi S, Yonezawa H, Takahashi J, et al.Selective reduction of diffusion anisotropy in white matter of Alzheimer disease brains measured by 3.0 Tesla magnetic resonance imaging.Neurosci Lett2002;332:45– 48
11. Head D, Buckner RL, Shimony JS, et al.Differential vulnerability of anterior white matter in nondemented aging with minimal acceleration in dementia of the Alzheimer type: evidence from diffusion tensor imaging.Cereb Cortex
2004;14:410 –23
12. Highley JR, Walker MA, Esiri MM, et al.Asymmetry of the uncinate fasciculus: a post-mortem study of normal subjects and patients with schizophrenia.
Cereb Cortex2002;12:1218 –24
13. Gaffan D, Easton A, Parker A.Interaction of inferior temporal cortex with frontal cortex and basal forebrain: double dissociation in strategy implemen-tation and associative learning.J Neurosci2002;22:7288 –96
14. Levine B, Black SE, Cabeza R, et al.Episodic memory and the self in a case of isolated retrograde amnesia.Brain1998;121(Pt 10):1951–73
15. Hughes TS, Abou-Khalil B, Lavin PJ, et al.Visual field defects after temporal lobe resection: a prospective quantitative analysis.Neurology1999;53:167–72 16. Taoka T, Sakamoto M, Iwasaki S, et al.Diffusion tensor imaging in cases with visual field defect after anterior temporal lobectomy.AJNR Am J Neuroradiol
2005;26:797– 803
17. Bozzali M, Franceschi M, Falini A, et al.Quantification of tissue damage in AD using diffusion tensor and magnetization transfer MRI.Neurology2001;57: 1135–37
18. Rugg-Gunn FJ, Eriksson SH, Symms MR, et al.Diffusion tensor imaging of cryptogenic and acquired partial epilepsies.Brain2001;124:627–36 19. Eriksson SH, Rugg-Gunn FJ, Symms MR, et al.Diffusion tensor imaging in
patients with epilepsy and malformations of cortical development.Brain