RESEARCH ARTICLE
Sirtuins regulate proteomic responses near thermal tolerance
limits in the blue mussels
Mytilus galloprovincialis
and
Mytilus trossulus
M. Christina Vasquez, Michelle Beam, Shelley Blackwell, Marcus J. Zuzow and Lars Tomanek*
ABSTRACT
The blue mussels Mytilus galloprovincialis and M. trossulus are
competing species with biogeographical ranges set in part by environmental exposure to heat and hyposalinity. The underlying cellular mechanisms influencing interspecific differences in stress tolerance are unknown, but are believed to be under regulation by
sirtuins, nicotinamide adenine dinucleotide (NAD+)-dependent
deacylases that play a critical role in the cellular stress response. A
comparison of the proteomic responses ofM. galloprovincialisand
M. trossulusto an acute heat shock in the presence and absence of
the sirtuin inhibitor suramin (SIRT1, 2 and 5) showed that sirtuins affected molecular chaperones, oxidative stress proteins, metabolic enzymes, cytoskeletal and signaling proteins more in the heat-sensitiveM. trossulusthan in the heat-tolerantM. galloprovincialis. Interactions between sirtuin inhibition and changes in the abundance of proteins ofβ-oxidation and oxidative stress inM. trossulussuggest a greater role of sirtuins in shifting metabolism to reduce the
production of reactive oxygen species near thermal limits.
Furthermore, RNA-binding proteins initiating and inhibiting
translation were affected by suramin in M. galloprovincialis and
M. trossulus, respectively. Western blot analysis showed that the
levels of mitochondrial sirtuin 5 (SIRT5) were generally three times higher and increased with acute heat stress in response to sirtuin inhibition inM. trossulusbut not inM. galloprovincialis, suggesting a possible feedback response in the former species and a greater reliance on SIRT5 for its stress response. Our findings suggest that SIRT5 plays an important role in setting interspecific differences in stress tolerance inMytilusby affecting the stress proteome.
KEY WORDS: Acylation,β-oxidation, Heat shock, Oxidative stress, RNA-binding proteins, Suramin, Proteomics
INTRODUCTION
Climate change is altering sea surface and air temperatures and seawater pH, and is predicted to increase precipitation, which will alter seawater salinity (IPCC, 2014). Most vulnerable to changing climate conditions will be species at the edge of their tolerance limits and ranges (Tomanek, 2010, 2012). In blue mussels (genusMytilus) along the Pacific coast, species range shifts are already being observed in response to a changing climate and according to species-specific stress
tolerances (Braby and Somero, 2006a,b; Lockwood et al., 2015).
Mytilusoccur worldwide from subtropical to cold-temperate latitudes on intertidal rocky substrates. As abundant filter feeders, they are keystone species in coastal ecosystems (Gosling, 1992). The MediterraneanMytilus galloprovincialisinvaded southern California during the last century and replaced the nativeMytilus trossulusfrom its southern range to San Francisco Bay, likely because of temperature increases due to climate change (Sarver and Foltz, 1993). Previous studies and current biogeographic distribution indicate that
M. galloprovincialisis the more heat-tolerant species but is unable to withstand fluctuations in seawater salinity, whileM. trossulus is more cold tolerant and is able to withstand hypo-saline conditions (Braby and Somero, 2006a; Lockwood et al., 2015; Tomanek et al., 2012). Mytilusphysiological responses and adaptations have been characterized for various environmental conditions; however, understanding the underlying cellular mechanisms regulating an organism’s ability to adapt to and withstand environmental stress is lacking.
Recent studies have shown widespread occurrence of acetylation and succinylation (or more generally acylation) of internal lysine residues of non-histone proteins involved in a wide range of cellular processes (Choudhary et al., 2014; Kim et al., 2006; Park et al., 2013; Rardin et al., 2013; Zhao et al., 2010). Deacylation of non-histone proteins is catalyzed by sirtuins (SIRT1–7), or class III lysine deacetylases (KDAC), using NAD+as a cofactor (Bheda et al., 2016).
While sirtuins are implicated in the regulation of cellular stress, genomic stability and energy metabolism (Houtkooper et al., 2012), their potential role in coping with environmental stress is largely unexplored.
To date, only histones and heat shock proteins (HSPs) have shown a response to deacylation by sirtuins during heat shock. For example, KDAC inhibitors increased the expression of heat shock genes upon heat treatment duringXenopusdevelopment (Ovakim and Heikkila, 2003). Additionally, inhibition of deacylases induces HSP90 acetylation and decreases its activity (Bali et al., 2005). Finally, deacetylation of heat shock factor 1 (HSF1) by SIRT1 extends the time HSF1 is bound to the HSP70 promoter, thereby increasing HSP70 transcription (Westerheide et al., 2009).
Our prior proteomic study found significant protein abundance changes in a number of non-HSPs involved in proteolysis, energy metabolism, scavenging of reactive oxygen species (ROS), cytoskeletal maintenance and cell signaling in Mytilus mussels during heat shock (Tomanek and Zuzow, 2010). These findings suggested that heat shock may induce shifts in metabolic pathways in
Mytilus to increase nicotinamide adenine dinucleotide phosphate
(NADPH) levels to scavenge ROS (Tomanek, 2015; Tomanek and Zuzow, 2010). In addition, mitochondrial SIRT5 and two electron transport system (ETS) proteins known to interact with sirtuins decreased in abundance simultaneously with heat shock, suggesting a Received 6 April 2017; Accepted 9 October 2017
California Polytechnic State University, Department of Biological Sciences, Center for Coastal Marine Sciences, Environmental Proteomics Laboratory, 1 Grand Avenue, San Luis Obispo, CA 93407-0401, USA.
*Author for correspondence (ltomanek@calpoly.edu)
L.T., 0000-0002-9188-8038
Journal
of
Experimental
role for sirtuins in setting thermal tolerance limits inMytilus, possibly by regulating the response to the increased production of ROS during heat stress. Similarly, in the intertidal limpetCellana toreumaexposed to a heat ramp up to 40°C, gene expression of SIRT1 increased at 30° C, indicating an influence of heat shock on cellular energy homeostasis and a shift towards catabolic metabolism (Han et al., 2013).
To assess the role of sirtuin-dependent deacylation during heat shock on a proteomic scale, the current study compared the effects of suramin, an inhibitor of SIRT1, 2 and 5 (Lawson et al., 2010), on the heat shock responses of two marine mussel species of the genus Mytilus with different thermal tolerances. We acclimated
M. galloprovincialisandM. trossulusmussels to 13°C under constant submersion, after which we excised gill tissue and exposed it to a range of stressful temperatures for 1 h. Tissues were subsequently placed into 13°C seawater for a 24 h recovery (chosen for its comparability to natural in situ recovery; Hofmann and Somero, 1996), and protein abundance changes were analyzed using 2D gel electrophoresis. Suramin was applied to half of the tissues under each temperature treatment for the duration of the experiment. Based on our previous work, we hypothesized that sirtuin inhibition by suramin would affect changes in the abundance of key cellular stress-response proteins (molecular chaperones and antioxidants), and that the effect would be different between the twoMytiluscongeners. Our study is the first of its kind to use a known sirtuin inhibitor to investigate the role sirtuins may play in regulating the cellular stress response in organisms with different stress tolerances. Our findings reveal
significant relationships between sirtuins and molecular chaperones, antioxidants, proteins involved in metabolic regulation and cell signaling, which vary in Mytiluscongeners with different thermal tolerances. These data suggest a potential key regulatory function for sirtuins in the adaptation to thermal stress inMytilusmussels.
MATERIALS AND METHODS
Animal collection, maintenance and experimental design
Specimens of M. galloprovincialisLamarck 1819 were collected subtidally from Santa Barbara, CA, USA (34°24′15″N, 119°41′30″ W) and those ofM. trossulusGould 1850 from Newport, OR, USA (44°38′25″N, 124°03′10″W). In a separate study, PCR was used to confirm that each site was occupied by only a single species (i.e. there were no hybrids present; Lockwood et al., 2010). Following acclimation to 13°C and full-strength (32 psu) seawater for 4 weeks, mussel gill tissue was dissected and individually placed in a 15 ml conical tube (constantly aerated) and heated at 6°C h−1to the target
temperatures of 28, 32 or 35°C [henceforward, heated treatments are referred to as HS (heat shock)], with 35°C being close to the thermal limit of Mytilus mussels (Braby and Somero, 2006b). Control mussel gill was left at the control temperature of 13°C and not heated. Exposure temperature duration was 1 h. Afterwards, gill tissues within tubes were brought back to the control temperature and left at 13°C for 24 h (under constant aeration and without a loss of ciliary activity), mimicking a recovery response from heat exposure in the intertidal zone. Half of the samples were kept in seawater with 100μmol l−1of suramin (inhibitor of SIRT1, 2 and 5)
from the beginning of the experiment (henceforward, suramin treatments are referred to as HS+suramin) (Lawson et al., 2010). At the end of the experiment, gill tissue was immediately frozen using liquid nitrogen (N=6 per species for each treatment). Tissues were subsequently kept at−80°C until homogenization.
Sample preparation and analysis for proteomics
Sample preparation for proteomic analysis followed procedures outlined previously, as described briefly below (Fields et al., 2012; Serafini et al., 2011; Tomanek et al., 2012, 2011).
Homogenization
Frozen gill tissue was lysed by homogenization using an ice-cold ground-glass homogenizer and protein conformation was disrupted using a urea (7 mol l−1)-based buffer with 0.5% immobilized pH 4–7
gradient (IPG) buffer (GE Healthcare, Piscataway, NJ, USA). Proteins were subsequently precipitated using 10% trichloroacetic acid in acetone and protein concentration was determined with a 2D Quant kit (GE Healthcare), following the manufacturer’s instructions.
Two-dimensional gel electrophoresis (2DGE)
Proteins were separated by isoelectric point using immobilized pH gradient (IPG) strips (pH 4–7, 11 cm; GE Healthcare). For second-dimension SDS-PAGE electrophoresis, IPG strips were placed on top of an 11.8% SDS-polyacrylamide gel, which was run (Criterion Dodeca; BioRad, Hercules, CA, USA) for 55 min. Gels were subsequently stained with colloidal Coomassie Blue (G-250) overnight and destained for 48 h. The resulting gel images were scanned for image analysis of protein abundance changes.
2D-gel image analysis of protein abundance
Digitized images of 2D gels were analyzed using Delta2D (version 3.6; Decodon, Greifswald, Germany) (Berth et al., 2007). Spots were detected on gels by fusing all images from one species into a composite image (Fig. 1). The relative amount of protein in each
List of symbols and abbreviations
2DGE two-dimensional gel electrophoresis
ALDH aldehyde dehydrogenase
BDH D-3 hydroxybutyrate dehydrogenase
c/mMDH cytosolic/mitochondrial malate dehydrogenase
DAZAP DAZ-associated protein
EHHADH enoyl CoA hydratase
ER endoplasmic reticulum
ERK extracellular signal-regulated kinase
ETF electron transport flavoprotein
ETS electron transport system
GDI GDP dissociation inhibitor
GLM generalized linear model
GST glutathioneS-transferase
HS heat shock
HSC heat shock cognate
HSF heat shock factor
HSP heat shock protein
IDH isocitrate dehydrogenase
IPG immobilized pH gradient
KDAC lysine deacetylase
NAD nicotinamide adenine dinucleotide
NADP/NADPH nicotinamide adenine dinucleotide phosphate
NHERF1 Na+/H+exchange regulatory factor
OAT ornithine aminotransferase
PC principal component
PCA principal component analysis
PDI protein disulfide isomerase
PPP pentose phosphate pathway
PRX peroxiredoxin
PTM post-translational modification
ROS reactive oxygen species
SDH succinate dehydrogenase
sHSP small heat shock protein
SIRT sirtuins
SOD superoxide dismutase
TBST Tris-buffered saline with Tween
TCP1 T-complex protein 1
Journal
of
Experimental
spot (i.e. spot volume) was quantified by normalizing against total spot volume of all proteins in the gel image.
Mass spectrometry
All proteins detected were excised from gels and digested with trypsin (Promega, Madison, WI, USA). Digested proteins were extracted, concentrated and spotted on an Anchorchip™target plate (Bruker Daltonics Inc., Billerica, MA, USA). We obtained peptide mass fingerprints (PMFs) using a matrix-assisted laser desorption ionization tandem time-of-flight (MALDI-ToF-ToF) mass spectrometer (Ultraflex II; Bruker Daltonics Inc., Billerica, MA, USA). To identify proteins, we combined PMFs and tandem mass spectra in a search against two databases, using Mascot (v2.2; Matrix Science Inc., Boston, MA, USA): (1) an NCBI-EST library limited to Mytilus that contained approximately 407,000 entries (May 2011), and (2) an NCBI dataset of non-redundant metazoan sequences (1,041,948 sequences; April 2011) (Table S1).
Protein acetylation
To confirm that changes in protein acetylation occurred during heat shock and differed between species, we conducted 2DGE and western analysis with acetyl-lysine antibodies.
Acetyl-lysine protein visualization
Following 2DGE, we transferred proteins to an 8.5×13.5 cm nitrocellulose membrane at 100 V for 30 min, using a Criterion Blotter (BioRad, Hercules, CA, USA). Transfer buffer ( pH 8.8) consisted of 25% methanol, 0.2 mol l−1 glycine and 0.1% SDS.
Membranes were blocked by rotating at 30 rpm at 18°C in 5% (w/v) bovine serum albumin (BSA) in Tris-buffered saline with Tween (TBST; 0.88% (w/v) sodium chloride, 0.25% Tris (w/v) and 0.6% Tween-20) for 1 h immediately following transfer. Then, the membrane was rinsed in TBST 4 times for 5 min. Following the rinses, membranes were incubated with a 1:500 solution of anti-acetylated lysine antibody (SPC-157F, Stressmarq Bioscience Inc., Victoria, BC, Canada) in 2.5% TBST with rotation at 30 rpm at 4°C for 17 h. The membranes were rinsed in TBST 4 times for 5 min. A secondary antibody was not necessary as the antibody was conjugated with horseradish peroxidase. Finally, we incubated membranes with ECL Plus (GE Healthcare) for 5 min at low light before they were scanned with a blue fluorescent laser at 430 and 200μm resolution.
Western analysis of SIRT5
Protein samples (5μg) were separated by one-dimensional SDS-PAGE with an 11.8% separating and a 4% stacking gel (0.5 mol l−1
Tris-HCl, pH 6.8) for 45 min at 200 V (Criterion, BioRad) and subsequently transferred to nitrocellulose membrane as described above for acetyl-lysine protein visualization. After blocking with 5% BSA in TBST, membranes were incubated for 1 h first with a primary antibody against SIRT5 (BML-SA464, Enzo Life Sciences, Inc., Farmingdale, NY, USA) diluted to 1:2500 with TBST and, subsequently, with a secondary antibody (goat anti-rabbit IgG; ADI-SAB-300, Enzo Life Sciences, Inc.) diluted at 1:5000 with TBST, with four 5 min washes with TBST following each incubation. The internal standard used was a recombinant human SIRT5 (5 ng; BML-SE555, Enzo Life Sciences, Inc.). The protocol followed all other steps and used reagents as described in the protocol for acetyl-lysine protein visualization.
Statistical analysis
Proteomics
To determine which proteins changed in volume significantly in response to HS+suramin treatment, we used an analysis of variance (two-way permutation ANOVA;P≤0.02) within each species and with HS and suramin treatment as the two main effects. We generated a null distribution for the two-way ANOVA (1000 permutations) to account for the unequal variance and non-normal distribution of some of the response variables. We chose aP-value of 0.02 to limit type I error.Post hoctesting to compare treatments was conducted using Tukey’s analysis (P≤0.05), using MiniTab (version 15; State College, PA, USA), to support conclusions about differences in single protein abundance profiles.
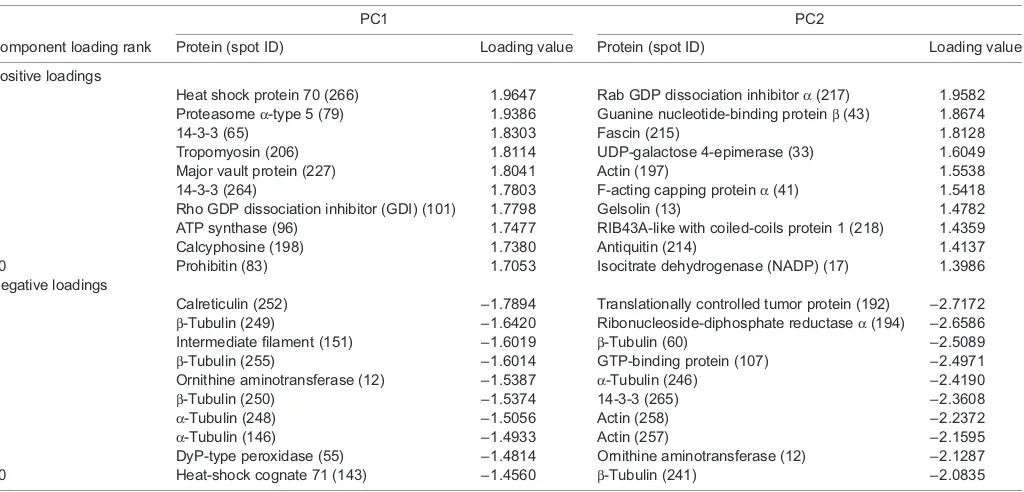
To associate proteins with similar abundance patterns across samples, we employed hierarchical clustering with average linking (Delta2D), using a Pearson correlation metric. The resulting clusters are specific to each heat map only and were used to characterize associated or complementary changes in protein abundance within a protein functional category. To further assess the importance of specific proteins in differentiating the proteomes of mussels exposed to different temperatures and affected by the treatment with suramin, we also employed principal component analyses (PCA; Delta2D). Component loadings, which quantify the contribution of each protein in the separation of samples along a given component, were used to compare changes in protein abundance (Tables 1 and 2).
pH 7
A
97.4 pH 4
45.0
31.0
21.5
kDa 14.4 66.2
97.4
45.0
31.0
21.5
kDa 14.4 66.2
[image:3.612.49.301.58.423.2]B
pH 4 pH 7Fig. 1. Composite gel images ( proteome map) for gill tissue from each blue mussel species.(A)Mytilus galloprovincialis, depicting 233 protein
spots. (B)Mytilus trossulus, depicting 294 protein spots. The proteome maps
represent average pixel volumes for each protein spot from all gels within each species. All numbered spots have been identified (for identifications, see Table S1).
Journal
of
Experimental
Western analysis of SIRT5
One-dimensional gels stained with a SIRT5-specific antibody were analyzed using TotalLab TL120 (version 2006f; Nonlinear Dynamics, Inc., Durham, NC, USA). The background noise was subtracted (‘rolling ball’method). Bands were detected, identified and labeled relative to the control band. Corresponding bands in each lane were matched and calibrated based on the concentration of the known standard in the reference lane (average of three reference lanes). Band 2 was identified as the most comparable to the reference
[image:4.612.49.566.78.323.2]band while band 1 was located slightly above and band 3 slightly below the reference lane. Both bands 1 and 3 may represent post-translational modification (PTM) of SIRT5 but were not present in all samples. We focused our quantitative analysis on band 2, which was present in all samples. We used a three-factor generalized linear model (GLM) with species, heat shock and suramin set as fixed effects to determine differences in band 2 concentration (P≤0.05). Comparisons between treatments were conducted with apost hoc Tukey multiple comparisons test (P≤0.05).
Table 1. Positive and negative loadings for principal components (PC) 1 and 2 forMytilus galloprovincialisgill exposed to heat shock and suramin (inhibitor of SIRT1, 2 and 5)
PC1 PC2
Component loading rank Protein (spot ID) Loading value Protein (spot ID) Loading value
Positive loadings
1 Profilin (172) 1.8013 Na+/H+exchange regulatory cofactor (176) 2.2536
2 Peroxiredoxin 4 (137) 1.6060 Soma ferritin (157) 1.8714
3 Cdc42 (chain A) (155) 1.5397 α-Tubulin (28) 1.8266
4 UDP-galactose 4-epimerase (96) 1.5192 α-Tubulin (181) 1.7205
5 T-complex protein 1 (chaperonin) (33) 1.4619 Cu-Zn superoxide dismutase (167) 1.7068
6 Heat-shock protein 22 (229) 1.2449 DAZ-associated protein (173) 1.6542
7 Chromosome 15 ORF 26 (111) 1.1265 Heat-shock cognate 70 (30) 1.6389
8 Major vault protein (6) 1.1000 Heat-shock cognate 70 (29) 1.5444
9 DyP-type peroxidase (113) 1.0909 Translationally controlled tumor protein (154) 1.4864
10 Persulfide dioxygenase (126) 1.0707 Proteasomeα-type 5 (136) 1.4068
Negative loadings
1 α-Tubulin (57) −2.0126 Adenosylhomocysteinase (80) −2.3745
2 α-Tubulin (197) −1.9909 α-Enolase (67) −2.1400
3 Actin (85) −1.9888 Fascin (55) −1.8084
4 β-Tubulin (189) −1.9301 Mitochondrial dihydrolipoyl dehydrogenase (53) −1.7780
5 α-Tubulin (182) −1.8715 Major vault protein (3) −1.6782
6 β-Tubulin (187) −1.8698 Major vault protein (7) −1.5945
7 β-Tubulin (186) −1.8671 Citrate synthase (70) −1.5630
8 ATP synthaseβ(190) −1.8298 Cytochromecreductase (ubiquinol) (76) −1.4667
9 β-Tubulin (205) −1.8088 β-Tubulin (223) −1.3562
10 Actin (87) −1.7473 Cu-Zn superoxide dismutase (163) −1.3147
Table 2. Positive and negative loadings for principal components (PC) 1 and 2 forMytilus trossulusgill exposed to heat shock and suramin (inhibitor of SIRT1, 2 and 5)
PC1 PC2
Component loading rank Protein (spot ID) Loading value Protein (spot ID) Loading value
Positive loadings
1 Heat shock protein 70 (266) 1.9647 Rab GDP dissociation inhibitorα(217) 1.9582
2 Proteasomeα-type 5 (79) 1.9386 Guanine nucleotide-binding proteinβ(43) 1.8674
3 14-3-3 (65) 1.8303 Fascin (215) 1.8128
4 Tropomyosin (206) 1.8114 UDP-galactose 4-epimerase (33) 1.6049
5 Major vault protein (227) 1.8041 Actin (197) 1.5538
6 14-3-3 (264) 1.7803 F-acting capping proteinα(41) 1.5418
7 Rho GDP dissociation inhibitor (GDI) (101) 1.7798 Gelsolin (13) 1.4782
8 ATP synthase (96) 1.7477 RIB43A-like with coiled-coils protein 1 (218) 1.4359
9 Calcyphosine (198) 1.7380 Antiquitin (214) 1.4137
10 Prohibitin (83) 1.7053 Isocitrate dehydrogenase (NADP) (17) 1.3986
Negative loadings
1 Calreticulin (252) −1.7894 Translationally controlled tumor protein (192) −2.7172
2 β-Tubulin (249) −1.6420 Ribonucleoside-diphosphate reductaseα(194) −2.6586
3 Intermediate filament (151) −1.6019 β-Tubulin (60) −2.5089
4 β-Tubulin (255) −1.6014 GTP-binding protein (107) −2.4971
5 Ornithine aminotransferase (12) −1.5387 α-Tubulin (246) −2.4190
6 β-Tubulin (250) −1.5374 14-3-3 (265) −2.3608
7 α-Tubulin (248) −1.5056 Actin (258) −2.2372
8 α-Tubulin (146) −1.4933 Actin (257) −2.1595
9 DyP-type peroxidase (55) −1.4814 Ornithine aminotransferase (12) −2.1287
10 Heat-shock cognate 71 (143) −1.4560 β-Tubulin (241) −2.0835
Journal
of
Experimental
[image:4.612.53.565.491.737.2]RESULTS
Based on proteome maps, we detected 233 and 294 protein spots in
M. galloprovincialis and M. trossulus, respectively (Fig. 1;
Table S1). Of these, suramin affected the heat shock-induced abundance changes in 19% of the proteins inM. galloprovincialis and in 52% of the proteins inM. trossulus.
PCA
We conducted PCA to assess the variation in protein abundance patterns based on statistical significance for HS, sirtuin inhibition by suramin or interaction effects (HS+suramin) using a two-way permutation ANOVA (P≤0.02), and identified protein candidates involved in the treatment response (Fig. 2). PCA of these abundance changes for the first two principal components (PCs) for the interaction effects (PCAs for main effects are not shown) in
M. galloprovincialissuggests that PC1 and PC2 represent the effect
of HS alone and HS+suramin, respectively (Fig. 2A). A clear separation between suramin treatments was notable only in
M. trossulus at 35°C along PC2 (Fig. 2B). These results suggest
that the effect of sirtuin inhibition by suramin (implicating SIRT1, 2 and 5) was strongest at the highest HS, and was particularly strong near the upper thermal limits ofM. trossulus. When the 35°C HS treatment was removed from theM. trossulusPCA, there was a clear gradient from 13°C to 28°C to 32°C HS moving from left to right across PC1 (Fig. S1). Furthermore inM. trossulus, 32°C HS+suramin was separated along PC2 from all other treatments, indicating a unique interaction that was only observed at 32°C HS (Fig. S1). Thus,
the effect of sirtuin inhibition started at 32°C and continued to increase up to 35°C inM. trossulus (Fig. 2B; Fig. S1). PCs that separated the treatments were analyzed further by identifying proteins that contributed the most to the separation based on their component loading values.
Mytilus galloprovincialis
For M. galloprovincialis, the first PC separated the effect of
increasing HS from left to right along thex-axis and accounted for 16.6% of the variation in protein abundance (Fig. 2A). Proteins representing actin binding ( profilin), oxidative stress ( peroxiredoxin, DyP-type peroxidase), stress signaling (Cdc42, major vault protein), energy metabolism (UDP-galactose 4-epimerase) and molecular chaperones (chaperonin, HSP22) showed the most positive loadings for PC1 (Table 1). Proteins contributing highly negative loadings mainly consisted of cytoskeletal proteins (α- and β-tubulin, actin) with the addition of one energy metabolism protein (ATP synthaseβ) (Table 1).
PC2, which accounted for 8.2% of the variation in protein abundance, separated the effect of HS+suramin from that of HS alone along they-axis but in a manner that was dependent on the temperature of the HS (Fig. 2A). For example, 35°C HS was located below 35°C HS+suramin, while 32°C HS was located above 32°C HS+suramin (Fig. 2A). The observed effect is opposite depending on the HS treatment, detailing the complexity of the HS and sirtuin inhibition interaction occurring in M. galloprovincialis at thermal extremes. Proteins related to iron binding/oxidative stress (ferritin), cytoskeleton (α-tubulin), oxidative stress [Cu-Zn superoxide dismutase (SOD)], mRNA binding [DAZ-associated protein (DAZAP)], proteostasis [heat shock cognate (HSC)70, proteasome α-type 5] showed the most positive loadings for PC2 (Table 1). Proteins related to amino acid metabolism (adenosylhomocysteinase), the pay-off phase of glycolysis (α-enolase), Krebs cycle (citrate synthase and dihydrolipoyl dehydrogenase) and the electron transport system (cytochrome c reductase), actin filament bundling (fascin), stress signaling (major vault protein), cytoskeleton (β-tubulin) and oxidative stress (Cu-Zn SOD) contributed the most negative loadings for PC2 (Table 1).
Mytilus trossulus
For M. trossulus, PC1 separated the effect of 35°C HS+suramin
from all other treatments along the x-axis and accounted for 23.5% of the variation in protein expression (Fig. 2B). Proteins representing proteostasis (HSP70, prohibitin, proteasomeα-type 5), signaling (14-3-3, major vault protein, Rho GDP dissociation inhibitor, calcyphosine) and energy metabolism (ATP synthase) showed the most positive loadings for PC1 and contributed to the separation of 35°C HS+suramin from the remaining treatments (Table 2). Proteins contributing highly negative loadings mainly consisted of molecular chaperones (calreticulin, HSC71), cytoskeletal proteins (β-tubulin, intermediate filament,α-tubulin), amino acid metabolism (ornithine aminotransferase) and oxidative stress (DyP-type peroxidase), suggesting that the specific functions of these proteins generally decreased the most with the addition of suramin during HS (Table 2).
PC2 separated the effect of 35°C HS alone from all other treatments along they-axis and accounted for 11.1% of the variation in protein abundance (Fig. 2B). Proteins related to signaling (Rab GDP dissociation inhibitorα, guanine nucleotide binding proteinβ), actin binding (fascin, F-actin capping protein α, gelsolin), energy metabolism [UDP-galactose 4-epimerase, antiquitin (or ALDH7A1, an aldehyde dehydrogenase), NADP-isocitrate dehydrogenase] and the cytoskeleton (actin, RIB43A) showed the most positive loadings PC1 (23.5%)
PC2 (11.1%)
B
PC1 (16.6%)
PC2 (8.2%)
A
[image:5.612.52.299.378.684.2]13°C 13°C Suramin 28°C 28°C Suramin 32°C 32°C Suramin 35°C 35°C Suramin
Fig. 2. Principal component analysis (PCA) of the effect of suramin during heat shock.(A)Mytilus galloprovincialis. (B)Mytilus trossulus. Data include all
protein spots. Each symbol represents a single mussel gill sample (N=6 per
species for each treatment). Percentages indicate the total variation in the
dataset accounted for by principal component (PC)1 and PC2.
Journal
of
Experimental
for PC2, meaning that they generally decreased with 35°C HS (Table 2). Proteins related to microtubule stabilization (translationally controlled tumor protein), DNA/RNA synthesis (ribonucleoside-diphosphate reductaseα), the cytoskeleton (β- andα-tubulin, actin), signaling (GTP-binding protein and 14-3-3) and amino acid metabolism (ornithine aminotransferase, OAT) showed the most negative loadings for PC2 contributing to the separation of 35°C HS from all other treatments (Table 2).
Analysis of acetylated proteins and western blot analysis of SIRT5
2DGE and western blotting with an acetyl-lysine antibody showed that 10% (of 48 spots total) and 27% (of 52 spots) of acetylated proteins were affected during HS (up to 35°C) by suramin in
M. galloprovincialis and M. trossulus, respectively (two-way
ANOVA,P≤0.05; Fig. 3). While both detection methods showed that∼2.7 times as many spots were affected by suramin during HS
inM. trossuluscompared withM. galloprovincialis, the number of
acetylated spots that changed using the acetyl-lysine antibody was much lower than the number detected with the total protein stain.
The most abundant SIRT5 band (band 2) was ∼3 times more abundant inM. trossulusthan inM. galloprovincialis(species main effect; GLM,χ2=50.4, d.f.=1,P≤0.0001; Fig. 4A). InM. trossulus
without suramin, the SIRT5 band abundance was significantly greater at 35°C than at either 28°C (Tukeypost hoccomparison;
P=0.002) or 32°C (Tukey post hoc comparison; P=0.0005)
(Fig. 4B). The interaction of HS and suramin was statistically significant only in M. trossulus (GLM, χ2=7.7, d.f.=3, P=0.05),
leading to higher levels of SIRT5 during inhibition at 28 and 32°C than in the non-inhibited control groups. However, pairwise comparisons showed that the SIRT5 abundance was greater at 35°C HS+suramin than at 32°C HS without suramin only, in
M. trossulus(Tukeypost hoccomparison;P=0.03) (Fig. 4B).
DISCUSSION
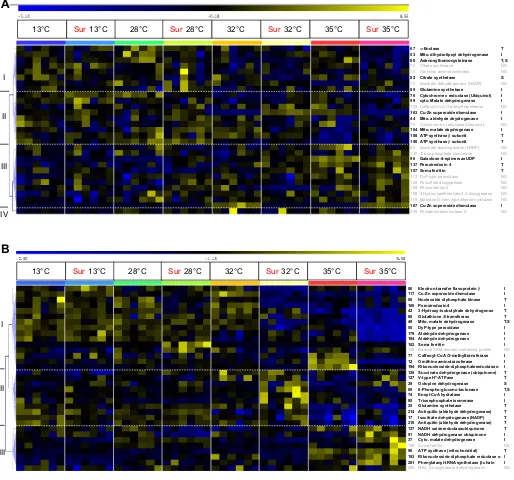
Protein chaperoning and degradation ( proteostasis)
A comparison of identified proteins by functional categories showed that changes in the abundance of molecular chaperones in response to HS were more affected by sirtuin inhibition (henceforth referred to as an interaction effect) in M. trossulusthan inM. galloprovincialis (Figs 5 and 6). In general, molecular chaperones function to maintain protein conformation while proteins related to the proteasome function in degradation (Ciechanover, 2005; Glickman and Ciechanover, 2002; Kim et al., 2013). InM. galloprovincialis, we identified two HSP/HSC70s, one isoform of the chaperonin T-complex protein 1 (TCP1), which catalyzes the folding of cytoskeletal proteins (Sternlicht et al., 1993), one endoplasmic reticulum (ER) chaperone (malectin) and one proteasome subunit, all of which were significant for interaction effects (Figs 5A and 6A). Three other chaperones, a chaperonin (spot 33) isoform, and small heat shock protein (sHSP)21/22 functioning specifically in cytoskeletal stability (Benndorf et al., 2001; Haslbeck et al., 2005; Sternlicht et al., 1993), showed only a temperature effect (Figs 5A and 6A). However, one small HSP (HSP22), two mitochondrial chaperones ( prohibitin and HSP60), three constitutively expressed HSC70s, two ER chaperones ( protein disulfide isomerase PDI), and three proteasome isoforms were identified but did not change significantly (Fig. 5A). The protein abundance changes of molecular chaperones and proteasome isoforms may indicate partial disruption of the gill tissue cytoskeleton upon HS to 35°C, which is consistent with a previous proteomic study (Tomanek and Zuzow, 2010), but given the non-significance of the changes, it seems likely that the disruption of proteostasis was only partial and did not expand to the mitochondria inM. galloprovincialis.
Of the proteins inM. trossulusshowing interaction effects, 11 were molecular chaperones (HSP/HSC70s, two isoforms of TCP1, three sHSPs, HSP40, HSP90, the ER PDI and calreticulin; Figs 5B and 6B). Changes in only one HSP70 and two proteasome isoforms were non-significant (Figs 5B and 6B). While the majority of these chaperones are involved in stabilizing denaturing proteins and facilitating the proper formation of protein aggregates (Kim et al., 2013; Tyedmers et al., 2010), PDI and calreticulin play a role in the maturation of secreted ER proteins (Araki and Nagata, 2012). Several chaperones showed a decrease in one isoform at 35°C HS+suramin (cluster I) while other chaperones simultaneously showed an increase under the same conditions (cluster III) inM. trossulus but not in
M. galloprovincialis(Fig. 5). Specifically, two HSC70s decreased
while two HSP70s increased at 35°C HS+suramin in comparison to 35°C HS alone, and they were significant for interaction effects (Figs 5B and 6B). In comparison, only one HSC70 decreased at 28°C with sirtuin inhibition in M. galloprovincialis, a much lower temperature. In general, sirtuin inhibition (indicated through an interaction) affected HSP70 and HSC70 equally in both species (one HSC70 out of two and two HSC70 out of four HSC/P70 isoforms in
M. galloprovincialisandM. trossulus, respectively) (Figs 5 and 6). We interpret the increases in protein abundance observed in cluster III in comparison to cluster I inM. trossulusas indicating the cellular response of gills to compensate for the loss of the cellular
A
B
pH 4pH 4 pH 7
[image:6.612.49.300.375.685.2]pH 7
Fig. 3. Two-dimensional gel images of acetyl-lysine proteins using an acetyl-lysine antibody.(A)Mytilus galloprovincialis. (B)Mytilus trossulus. In M. galloprovincialisandM. trossulus, 10% (5 of 48 spots) and 27% (14 of 52 spots) of the acetylated proteins were affected by suramin during heat shock,
respectively (two-way ANOVA,P≤0.02).
Journal
of
Experimental
stress response under sirtuin inhibition. This is evident in the increase in protein abundance of proteasomeα-type 5 (spot 79) and the two HSP70s in cluster III, which showed an interaction effect (Figs 5B and 6B). This corresponds to the compensatory response as a consequence of sirtuin inhibition seen for SIRT5 levels in
M. trossulus(Fig. 4). Conversely, the lack of a difference in protein abundance with and without suramin inM. galloprovincialismay indicate that sirtuins play a less important role in its stress response. Alternatively, the signal for inducing sirtuin activity on the proteostasis proteome may not have yet been triggered at 35°C HS inM. galloprovincialis, although this is unlikely. Interestingly, SIRT1 is known to regulate the inducible heat shock response and transcription of HSP70 by deacetylating HSF1, which prolongs its binding to the heat shock promoter element in humans (Westerheide et al., 2009). Our findings indicate that the gill proteome is highly heat sensitive and that sirtuins play a global role in regulating molecular chaperones and protein degradation, and therefore protein homeostasis during heat shock, more so in M. trossulus than in
M. galloprovincialis.
mRNA binding
Sirtuin inhibition during HS treatment also affected mRNA processing and translation (Figs 5 and 7). We identified two isoforms of the translation initiation activator DAZAP (Smith et al., 2011) and the elongation factor eIF5a in M. galloprovincialis mussels as showing interaction effects under 35°C HS+suramin (Figs 5A and 7A). Interestingly, while one isoform of DAZAP (spot 175) increased in protein abundance under HS, another isoform (spot 174) increased in protein abundance almost 10 times under 35°C HS+suramin compared with 35°C HS alone, suggesting a direct role of sirtuins in regulating translation initiation in
M. galloprovincialis(Figs 5A and 7A).
In M. trossulus, we identified two isoforms of Musashi1, a
translation inhibitor (Gunter and McLaughlin, 2011), and serine/ arginine (SR)-rich protein, a splicing repressor during HS (Shi and Manley, 2007), both of which also showed interaction effects under 35°C HS+suramin (Figs 5B and 7B). SR-rich protein (cluster II) clustered with other chaperones found to increase in abundance under 32°C HS+suramin (Figs 5B and 7B). RNA-binding protein G1 G2 G3 G4 G5 G6
hSIR
T5 32°C, no suramin
M. galloprovincialis
M. trossulus
hSIR
T5
hSIR
T5
G1 G2 G3 G4 G5 G6 32°C, 100 μmol l–1 suramin
Band 1 Band 2 Band 3
A
–1 0 1 2 3 4 5 6
0 2 4 6 8 10 12 14
13 28 32 35
Temperature (°C)
Normalized volume (relative to hSIR
T5)
Mytilus galloprovincialis
Mytilus trossulus
B
Suramin No suramin
[image:7.612.70.552.49.427.2]13 28 32 35
Fig. 4. Western blot analysis and abundance changes of SIRT5 isoforms.(A) Detection of three different sirtuin 5 isoforms (bands 1, 2 and 3) with a
SIRT5-specific antibody (with human SIRT5 as a control) in gill tissue (G1–G6) in the absence and presence of 100 µmol l−1suramin (a SIRT1, 2 and 5 inhibitor).
(B) Abundance changes of band 2 during heat shock and sirtuin inhibition by 100 µmol l−1suramin inM. galloprovincialisandM. trossulus. Band 2 was overall 3
times greater inM. trossulus(species main effect; GLM,χ2=50.4, d.f.=1,P≤0.0001), increased at 35°C (temperature main effect; GLM,χ2=22.5, d.f.=3,
P≤0.001) and showed an interaction effect inM. trossulusonly (GLM,χ2=7.7, d.f.=3,P=0.05). Band 1 was not present in enough samples to analyze volume
changes with a logistic regression model (data not shown). Band 3 was more likely to be present inM. galloprovincialisthan inM. trossulus(logistic regression
model,P=0.009, odds ratio of 101.62), and was more likely to be present without than with suramin (P=0.037, odds ratio of 20.84), and while the effect of
temperature was significant (P=0.012), the odds ratio (1.89) indicated that temperature did not affect the abundance of band 3 (data not shown).
Journal
of
Experimental
Musashi (spot 159; cluster I) showed decreased protein abundance under 35°C HS+suramin while an additional isoform (spot 119) showed increased protein abundance under the same treatment in cluster III (Figs 5B and 7B). The occurrence of two isoforms with complementary patterns at the same temperature may represent a
direct effect of sirtuins on Musashi1 and thus a difference in how sirtuins affect the proteomic responses to acute HS differently in the
two Mytilus congeners. Specifically, sirtuin inhibition affected
translation initiation in M. galloprovincialis while it affected translation inhibition and splicing inM. trossulusduring HS.
61 Protein disulfide isomerase NS 161 Eukaryotic translation initiation factor 5a I
59 Calreticulin T
203 Protein disulfide isomerase NS 206 40S ribosomal protein(SA) T 27 Heat shock cognate I 52 T-complex protein 1 I 106 Proteasome α-type 1 S
114 Malectin-A I
26 Heat shock cognate 71 NS 29 Heat shock cognate 70 NS 30 Heat shock cognate 70 NS 40 Heat shock protein 60 NS 207 Cathepsin-D T
231 Prohibitin NS
15 Heat shock protein 70 T 19 Heat shock protein 70 I 20 Heat shock protein 70 T 115 Heat shock protein 22 NS 211 Heat shock protein 21 T 136 Proteasome α-type 5 NS 154 Translationally controlled tumor protein NS
222 Pur-α T
228 Heat shock protein 22 NS 229 Heat shock protein 22 T 33 Chaperonin β-subunit 2 T 128 Proteasome α-type 6 NS 173 DAZ-associated protein T 174 DAZ-associated protein I 175 DAZ-associated protein I 123 Proteasome α-type 3 NS 233 Proteasome α-type 4 I
13°C Sur 13°C 28°C Sur28°C 32°C Sur32°C 35°C Sur35°C
II
III I
IV
A
99 Proteasome β-type 4 NS 97 Translocon-associated protein β T, S 159 RNA binding protein Mushashi I 93 Proteasome α-type 2 I 192 Translationally controlled tumor protein I 245 40S ribosomal protein SA NS 24 Heat shock protein 40 I 164 Mitochondrial-processing peptidase β T 142 Heat shock cognate 71 I 147 Heat shock protein 60 I 140 Heat shock protein 71 NS 139 Heat shock cognate 71 I 143 Heat shock cognate 71 T,S 145 Heat shock cognate 71 T,S 252 Calreticulin I 63 Heat shock protein 21 I 71 Heat shock protein 22 I 162 Proteasome α-type 1 NS 202 RNA recognition motif (RRM)-containing T,S 54 Serine-arginine (SR)-rich protein I 66 Heat shock protein 25 I 239 Protein disulfide isomerase I 128 Heat shock protein 70 T 125 Heat shock protein 70 T 280 Heat shock protein 70 T 195 Translationally controlled tumor protein I 205 Ribosomal protein SA I 276 Heat shock protein 70 T 279 Heat shock protein 70 T 130 T-complex protein 1 I 233 Protein disulfide isomerase I 268 Heat shock protein 70 I 211 Protein disulfide isomerase T
83 Prohibitin T
119 RNA binding protein Mushashi-1 T 231 Heat shock protein 90 I 79 Proteasome α-type 5 I 266 Heat shock protein 70 I 283 T-complex protein 1 I
13°C Sur 13°C 28°C Sur28°C 32°C Sur32°C 35°C Sur35°C
II
[image:8.612.55.562.63.580.2]III I
B
Fig. 5. Hierarchal clustering of changes in abundance of proteins involved in chaperoning, degradation and mRNA binding ( proteostasis).(A)Mytilus galloprovincialis. (B)Mytilus trossulus. Pearson’s correlation in response to acute heat shock under sirtuin inhibition with suramin (Sur) in mussel gill tissue. Blue coloring represents a lower than average protein abundance (standardized volume), whereas yellow represents greater than average protein abundance. The
columns show individual mussel gill tissue, organized according to treatment (N=6). The rows represent the standardized abundance of proteins, which are
identified on the right. Statistical significance is given for each of the two main effects (S, suramin; T, temperature) or an interaction effect (I) to the right of the
protein name (two-way permutation ANOVA,P≤0.2). Hierarchal clusters are indicated on the left for reference to the text. Gray indicates proteins that showed
non-significant changes (NS). For detailed information about protein identification, see Table S1.
Journal
of
Experimental
100 0 35 32 28 13 35 32 28 13 100 0 35 32 28 13 35 32 28 13 100 0 35 32 28 13 35 32 28 13 100 0 35 32 28 13 35 32 28 13
Sur μmol l–1
Temp. (°C) 100 0 35 32 28 13 35 32 28 13 100 0 35 32 28 13 35 32 28 13 100 0 35 32 28 13 35 32 28 13 100 0 35 32 28 13 35 32 28 13 100 0 35 32 28 13 35 32 28 13 100 0 35 32 28 13 35 32 28 13 100 0 35 32 28 13 35 32 28 13 100 0 35 32 28 13 35 32 28 13 100 0 35 32 28 13 35 32 28 13 100 0 35 32 28 13 35 32 28 13 100 0 35 32 28 13 35 32 28 13 100 0 35 32 28 13 35 32 28 13 100 0 35 32 28 13 35 32 28 13 100 0 35 32 28 13 35 32 28 13 100 0 35 32 28 13 35 32 28 13 100 0 35 32 28 13 35 32 28 13 100 0 35 32 28 13 35 32 28 13 100 0 35 32 28 13 35 32 28 13 100 0 35 32 28 13 35 32 28 13 100 0 35 32 28 13 35 32 28 13 100 0 35 32 28 13 35 32 28 13 100 0 35 32 28 13 35 32 28 13 100 0 35 32 28 13 35 32 28 13 100 0 35 32 28 13 35 32 28 13 0.9 0.8 0.7 0.6 0.5 0.4 0.3 0.2 0.1 0 b,c b,c a b,c c b,c b,c b
(19) Heat shock protein 70 (I)
A
0.5 0.4 0.3 0.2 0.1 0 b a c c b b,c b,c b,c(27) Heat shock cogate 71 (I)
0.8 0.7 0.6 0.5 0.4 0.3 0.2 0.1 0 b,c a a,b c,d b,c,d d b,c b,c,d
(52) T-complex protein 1 (I)
1.0 0.8 0.6 0.4 0.2 0 a,b a,b b a a,b a,b b a,b
(33) T-complex protein (chaperonin) (T)
0.25 0.20 0.15 0.10 0.05 0 a,b b a,b a a a a,b a
(233) Proteasome beta-type 4 (I)
0.4 0.3 0.2 0.1 0 a b b b b b b b
Normalized spot volume
Normalized spot volume
(114) Malectin-A (I)
1.2 1.0 0.8 0.6 0.4 0.2 0 b a,b a,b a a,b a,b a,b a,b
(229) Heat shock protein 22 (T)
1.2 1.0 0.8 0.6 0.4 0.2 0 b a,b a,b a a,b a,b a,b a,b
(229) Heat shock protein 22 (T)
1.6 1.4 1.2 1.0 0.8 0.6 0.4 0.2 0 a a a a a a a a
(211) Heat shock protein 21 (T)
B
1.4 1.2 1.0 0.8 0.6 0.4 0.2 0 b b b b b a b b 1.0 0.8 0.6 0.4 0.2 0 a b,c c b,c b c c b,c(79) Proteasome alpha type 5 (I)
0.25 0.20 0.15 0.10 0.05 0 c b,c b,c a,b a a,b,c a,b,c a,b,c
(93) Proteasome alpha type 2 (I)
0.4 0.3 0.2 0.1 0 b b b b a b b b
(192) TCTP (I)
0.7 0.6 0.5 0.4 0.3 0.2 0.1 0 b a a a a,b a,b a,b a,b 0.6 0.5 0.4 0.3 0.2 0.1 0 b a a a a,b a a,b a 1.2 1.0 0.8 0.6 0.4 0.2 0 b a a a a a a a 6 5 4 3 2 1 0 c a,b a a,b b a a a,b 0.7 0.6 0.5 0.4 0.3 0.2 0.1 0 b b a,b b b a a,b a,b 1.4 1.2 1.0 0.8 0.6 0.4 0.2 0 b a b b b b b b 2.0 1.5 1.0 0.5 0 b a a,b b a,b b b b 0.8 0.7 0.6 0.5 0.4 0.3 0.2 0.1 0 a a a a a a a a 0.8 0.7 0.6 0.5 0.4 0.3 0.2 0.1 0 a b b b b b b b 1.6 1.4 1.2 1.0 0.8 0.6 0.4 0.2 0 a d a,b,c a,b c,d a,b,c,d b,c,d a,b,c 0.6 0.5 0.4 0.3 0.2 0.1 a b b b b b b b
(24) Heat shock protein 40 (I)
(142) Heat shock cognate 71 (I) (147) Heat shock protein 60 (I) (252) Calreticulin (I) (63) Heat shock protein 21 (I)
(71) Heat shock protein 22 (I) (66) Heat shock protein 25 (I) (239) Protein disulfide isomerase (I) (195) TCTP (I)
(266) Heat shock protein 70 (I) (268) Heat shock protein 70 (I) (231) Heat shock protein 90 (I)
0.5 0.4 0.3 0.2 0.1 0 0 b a a,b a,b a a,b a a
(139) Heat shock cognate 71 (I)
0.25 0.20 0.15 0.10 0.05 0 a,b a,b a b a,b a,b a,b a
(130) T-complex protein 1 (I)
3.0 2.5 2.0 1.5 1.0 0.5 0 b a a a a a a a
(233) Protein disulfide isomerase (I)
0.35 0.30 0.25 0.20 0.15 0.10 0.05 0 b a a a a a a a
(283) T-complex protein 1 (I) Sur μmol l–1
Temp. (°C)
Sur μmol l–1
Temp. (°C)
Sur μmol l–1
Temp. (°C)
Sur μmol l–1
Temp. (°C)
Sur μmol l–1
Temp. (°C)
Sur μmol l–1
[image:9.612.53.568.57.686.2]Temp. (°C)
Fig. 6. Abundance of protein chaperoning and degradation ( proteostasis) proteins in gill tissue in response to temperature and suramin treatment. (A)Mytilus galloprovincialis. (B)Mytilus trossulus. Abundance was obtained by taking the spot volume and normalizing it against the volume of all proteins
(means±1 s.e.m.,N=6). Spot number, identification and significance for temperature (T), suramin (S) or the interaction of temperature and suramin (I) are given
above the graphs. Treatments that are statistically indistinguishable share the same letter (two-way permutation ANOVA; TukeyP≤0.05).
Journal
of
Experimental
Energy metabolism
Several enzymes of glycolysis, the pentose phosphate pathway (PPP), Krebs cycle, the ETS, oxidative phosphorylation and fatty acidβ-oxidation responded to HS and suramin treatment in species-specific patterns.
In the more heat-tolerant M. galloprovincialis, we identified metabolic proteins that showed an interaction effect but without a general trend of how HS+suramin affected protein abundance (Fig. 8A). The changes involved cytosolic and mitochondrial isoforms of malate dehydrogenase (c/mMDH), dihydrolipoyl dehydrogenase, which is part of the pyruvate dehydrogenase complex, and cytochromecreductase (Figs 8A and 9A). In contrast, UDP-galactose 4-epimerase showed a significant increase in protein abundance under 35°C HS in comparison to lower temperatures, but a decrease under 35°C HS+suramin relative to 35°C HS alone, suggesting a role for sirtuins in regulating its abundance (Figs 8A and 9A). UDP-galactose 4-epimerase functions in the conversion of UDP-galactose to UDP-glucose in the Leloir pathway (Frey, 1996), and the observed protein abundance changes in this species suggest that a greater energy demand is fulfilled by glycolysis under HS, or a shunting towards the PPP for the production of NADPH for ROS scavenging (Chandel, 2015). As changes in the glycolytic triose phosphate isomerase were non-significant and enolase showed a significant decrease with increasing temperature, we can probably rule out an increase in the rate of glycolysis and infer that the shunting towards the production of reducing equivalents in the form of NADPH via the PPP was up-regulated instead (Figs 8A and 9A).
In M. trossulus, proteins with decreased abundance under HS
+suramin (cluster I) included amino acid metabolism proteins caffeoyl-CoA O-methyltransferase, ornithine aminotransferase (OAT), and the DNA/RNA synthesis protein ribonucleoside-diphosphate reductase α (spot 194) (Figs 8B and 9B). OAT functions as an enzyme in ornithine degradation of the urea cycle and studies have shown that there is a functional ornithine cycle in bivalves (Andrews and Reid, 1972; Meijer et al., 1990). Interestingly, SIRT5 is known to deacetylate and thereby activate the first enzyme of the urea cycle (carbamoyl phosphate synthetase 1) (Nakagawa et al., 2009). Therefore, the decrease in protein abundance of OAT observed under 35°C HS+suramin is most likely linked to inhibition of deacetylase activity of SIRT5 with respect to
carbamoyl phosphate synthetase 1, which thereby down-regulates urea cycling and ornithine synthesis. Proteins with a general increase in abundance under HS+suramin (cluster III) included phenylalanyl-tRNA synthetase β, the malate–aspartate shuttle protein cMDH, and the ETS protein NADH dehydrogenase (Figs 8B and 9B). Finally, SIRT5 is known to hypersuccinylate lysine residues in proteins involved in the metabolic pathway for β-oxidation (Rardin et al., 2013), and we identified two proteins representingβ-oxidation [electron transfer flavoproteinβ(ETF) and enoyl CoA hydratase (EHHADH)] that showed an interaction and one [D-3 hydroxybutyrate dehydrogenase (BDH)] that showed a temperature effect inM. trossulus(Figs 8B and 9B).
The identification of an isoform of ATP synthase inM. trossulus (cluster III) that had a temperature main effect with increased abundance under 35°C HS and 35°C HS+suramin may indicate an increase in the activity of the fermentation of glucose to succinate and propionate, especially in combination with a sirtuin-dependent increase in NADH dehydrogenase and cMDH (Fig. 8B, cluster III).
Mytilusanaerobic energy metabolism relies on malate dismutation and cMDH to reduce malate to succinate, which is further converted to propionate (Müller et al., 2012). Furthermore, the reducing equivalents produced during the dismutation of malate can be oxidized by NADH dehydrogenase and the resulting proton gradient can be used by ATP synthase to produce ATP (Müller et al., 2012). These protein changes thus represent the alternative metabolic pathway occurring during hypoxia under aerial emersion and prolonged anaerobiosis inMytilus (Fields et al., 2014; Müller et al., 2012). This could suggest that
M. trossulusrelies more on this alternative anaerobic pathway with
increasing HS thanM. galloprovincialisand that sirtuins are involved in the regulation of this pathway during heat shock.
NADP-isocitrate dehydrogenase (IDH), which contributes to ROS scavenging by producing NADPH to reduce glutathione and thioredoxin (Go and Jones, 2008; Tomanek, 2015), and succinate dehydrogenase (SDH) showed only a temperature effect in
M. trossulus(cluster II) (Figs 8B and 9B). Both NADP-IDH and
SDH may have shown a temperature effect only because the sirtuin that most likely affects their acetylation (SIRT3) is not inhibited by suramin (Guan and Xiong, 2011); however, SIRT5 is also known to affect SDH through desuccinylation (Rardin et al., 2013). Phospho-glucono-lactonase, an enzyme of the PPP, which can contribute
0.8 0.7 0.6 0.5 0.4 0.3 0.2 0.1
b b
a,b
c b
a
a,b a,b
0.4
0.3
0.2
0.1
0 0
0 0
a
a,b
a,b a,b
b
b b
b
(175) DAZ-associated protein (I)
100 0
35 32 28 13 35 32 28 13
100 0
35 32 28 13 35 32 28 13
100 0
35 32 28 13 35 32 28 13
100 0
35 32 28 13 35 32 28 13
100 0
35 32 28 13 35 32 28 13
100 0
35 32 28 13 35 32 28 13 100
0
35 32 28 13 35 32 28 13 1.0
0.8
0.6
0.4
0.2
0
a
b
b,c b,c
c
c c c
(174) DAZ-associated protein (I)
A
0.4
0.3
0.2
0.1
a,b,c a,b,c
b,c b,c
c c a
a,b
(159) RNA-binding protein Musashi (I) 0.6
0.5
0.4
0.3
0.2
0.1
0
b,c b,c
c c c
a a
a,b
(119) RNA-binding protein Musashi (T)
Normalized spot volume
B
0.7 0.6
0.5 0.4 0.3 0.2
0.1
a
a,b
b b
b b
b b
0.20
0.15
0.10
0.05
a,b a,b
a,b a,b b a,b a
a,b
(161) eIF5a (I)
(54) Serine-arginine-rich protein (I) (205) Ribosomal protein SA (I)
Sur μmol l–1
Temp. (°C)
Sur μmol l–1
Temp. (°C)
[image:10.612.50.564.58.256.2]0
Fig. 7. Abundance of mRNA binding proteins in gill tissue in response to temperature and suramin treatment.(A)Mytilus galloprovincialis. (B)Mytilus trossulus. For more details, see Fig. 6.
Journal
of
Experimental
NADPH for ROS scavenging, showed individual temperature and suramin main effects but not an interaction effect inM. trossulus (Fig. 8B). These data suggest that there is a greater demand for NADPH to reduce ROS and limit oxidative damage during acute heat shock, which is consistent with previous findings inMytilus (Tomanek, 2015; Tomanek and Zuzow, 2010).
Suramin-dependent changes in EHHADH, an enzyme that catalyzes the first reaction of fatty acid β-oxidation, and ETF, the flavoprotein that carries reducing equivalents (FADH2) to
coenzyme Q of the ETS, were only observed in M. trossulus (Figs 8B and 9B). However, while sirtuin inhibition increased the abundance of EHHADH relative to the 32°C HS control, ETF levels decreased (Figs 8B and 9B). A metabolite of β-oxidation, acetoacetyl-CoA, can be converted first to acetoacetate and then
to β-hydroxybutyrate. It is known that β-hydroxybutyrate is an inhibitor of histone deacetylases which provides protection against oxidative stress (Shimazu et al., 2013), and we observed a protein abundance decrease with HS (Figs 8B and 9B). Although the two β-oxidation enzymes showed opposite effects in response to sirtuin inhibition, ETF and BDH clustered together (cluster I) (Fig. 8B). Given that all three enzymes are part of the two connected β-oxidation and ketone synthesis pathways, it may be interesting to ask how the combination of these pathways may contribute to ameliorating heat stress. We offer the following possibility. Based on studies assessing the production of ROS in isolated mitochondria with different substrates and inhibitors, the transfer of reducing equivalents (FADH2) produced during β-oxidation by ETF to
coenzyme Q produces significantly fewer ROS at complex I
80 Electron transfer flavoprotein β I 117 Cu-Zn superoxide dismutase I 90 Nucleoside diphosphate kinase T 100 Peroxiredoxin 4 I 42 3-Hydroxy-isobutylrate dehydrogense T 88 Glutathione S-transferase T 49 Mito. malate dehydrogenase T,S 55 DyP-type peroxidase I 179 Aldehyde dehydrogenase I 184 Aldehyde dehydrogenase I 102 Soma ferritin I 129 Radical SAM domain-containing protein NS 77 Caffeoyl-CoA O-methyltransferase I 12 Ornithine aminotransferase I 194 Ribonucleoside-diphosphatereductase α I 126 Succinate dehydrogenase (ubiquinone) T 127 V-type H+-ATPase T 29 Octopine dehydrogenase S 69 6-Phospho-glucono-lactonase T,S 74 Enoyl-CoA hydratase I 85 Triosephosphate isomerase I 25 Glutamine synthetase T 214 Antiquitin (aldehyde dehydrogenase) T 17 Isocitrate dehydrogenase (NADP) T 216 Antiquitin (aldehyde dehydrogenase) T 137 NADH oxidoreductaseubiquinone T 91 NADH dehydrogenase ubiquinone I 37 Cyto. malate dehydrogenase I
196 Soma ferritin NS
96 ATP synthase (mitochondrial) T 193 Ribonucleoside-diphosphate reductase α I 281 Phenylalanyl-tRNA synthetase β chain I 286 Mito. 2-oxoglutarate dehydrogenase NS
13°C Sur 13°C 28°C Sur28°C 32°C Sur32°C 35°C Sur35°C
II
III I
B
67 α-Enolase T
53 Mito. dihydrolipoyl dehydrogenase I 80 Adenosylhomocysteinase T, S 70 Citrate synthetase NS 73 Ornithine aminotransferase NS 82 Citrate synthetase S 75 Isocitrate dehydrogenase (NADP) NS 89 Glutamine synthetase I 76 Cytochrome c reductase (Ubiquinol) I 99 cyto. Malate dehydrogenase I 133 Caffeoyl-CoA O-methyltransferase NS 163 Cu-Zn superoxide dismutase I 44 Mito. aldehyde deydrogenase I 79 Cytochrome c reductase(Ubiquinol) NS 104 Mito. malate deydrogenase I 188 ATP synthase β subunit T 190 ATP synthase β subunit T 86 Isocitrate deydrogenase (NADP) NS 135 Triose phosphate isomerase NS 96 Galactose-4-epimersae UDP I 137 Peroxiredoxin 4 T 157 Soma ferritin T 113 DyP-type peroxidase NS 126 Persulfide dioxygenase NS
159 Peroxiredoxin 5 NS
108 3-Hydroxyanthranilate 3,4-dioxygenase NS 118 Esterase D-formylglutathione hydrolase NS 167 Cu-Zn superoxide dismutase I
13°C Sur 13°C 28°C Sur28°C 32°C Sur32°C 35°C Sur35°C
II
III I
IV
A
[image:11.612.53.567.61.541.2]230 Phosphomannomutase 2 NS
Fig. 8. Hierarchal clustering of changes in abundance of proteins involved in energy metabolism and oxidative stress.(A)Mytilus galloprovincialis. (B)Mytilus trossulus. Pearson’s correlation in response to acute heat shock under sirtuin inhibition with suramin in mussel gill tissue. For more details, see Fig. 5.
Journal
of
Experimental
(NADH dehydrogenase) compared with when FADH2 enters the
ETS through SDH and succinate is the substrate, possibly because of reverse electron transfer (Schönfeld et al., 2010). Given the greater loss of an oxidative stress response with increasing temperatures in M. trossulus (Tomanek and Zuzow, 2010), and the suramin-dependent response of oxidative stress proteins to heat in thisMytiluscongener (see below), we think a shift from succinate to fatty acids (carnitine esters) as the main substrate for energy metabolism, possibly regulated by sirtuins, could reduce the production of ROS in this species as a last-ditch effort to avoid greater oxidative damage. We postulated a similar role for SIRT5 in switching from pro-oxidant NADH-producing pathways to anti-oxidant NADPH-producing pathways previously (Tomanek and Zuzow, 2010). The occurrence of a temperature effect without a suramin interaction effect for SDH may be explained by the fact that suramin does not affect SIRT3 (but see Rardin et al., 2013). Thus, we hypothesize that, in M. trossulus, the mitochondrial SIRT5 may be partly responsible for a shift in energy metabolism (e.g. β-oxidation versus Krebs cycle), mainly to reduce ROS production from the ETS. In contrast,M. galloprovincialisseems to respond more robustly to HS, and this may be best shown by its different strategy of responding to oxidative stress.
Oxidative stress
Several oxidative stress proteins, including two Cu-Zn SOD isoforms and one ALDH showed interaction effects inM. galloprovincialis (Figs 8A and 9A). Cu-Zn SOD may reside in the intermembrane space of the mitochondria (Tomanek, 2015) and we identified two isoforms (spots 163 and 167) that showed complementary and opposite abundance changes with the addition of suramin (Figs 8A and 9A). These two isoforms differ in isoelectric point by 0.08 pI units and molecular mass by 2 kDa (Table S1A), which suggests a PTM, possibly several lysine-acylations, which have been shown to affect the activity of Mn SOD (Tao et al., 2010). Therefore, while one isoform decreased in protein abundance (spot 163) the other (spot 167) increased and these changes were related to the interaction of suramin with HS at 35°C and the resulting inhibition of SIRT1, 2 and 5 (Figs 8A and 9A). A switch in abundance between two isoforms of Cu-Zn SOD with increasing heat stress was shown for
M. galloprovincialisin a prior study (Tomanek and Zuzow, 2010).
InM. galloprovincialis, peroxiredoxin 4 (PRX4), which reduces
hydrogen peroxide in the cytosol and ER to prevent ROS-induced cellular damage (Hanschmann et al., 2013), showed a temperature effect with increasing abundance under 35°C HS in comparison to the control temperature (Figs 8A and 9A). Given the steady increase 100 0 35 32 28 13 35 32 28 13 0.35 0.30 0.25 0.20 0.15 0.10 0.05 0 a,b,c a,b,c b,c b,c b,c c a a,b
(137) Peroxiredoxin 4 (T)
A
100 0 35 32 28 13 35 32 28 13 0.7 0.6 0.5 0.4 0.3 0.2 0.1 0 a,b a,b b a,b a a,b a,b a,b(99) Cytosolic malate dehydrogenase (I)
100 0 35 32 28 13 35 32 28 13 0.6 0.5 0.4 0.3 0.2 0.1 0 a,b a,b a
b a,b a
a,b a,b
(104) Mito. malate dehydrogenase (I)
100 0 35 32 28 13 35 32 28 13 1.2 1.0 0.8 0.6 0.4 0.2 0 a,b a a b
a,b a,b a,b
b
(188) ATP synthase b (T)
100 0 35 32 28 13 35 32 28 13 1.6 1.4 1.2 1.0 0.8 0.6 0.4 0.2 0 a,b a b,c c b,c a b,c b,c
(190) ATP synthase b (T)
100 0 35 32 28 13 35 32 28 13 0.25 0.20 0.15 0.10 0.05 0 d d c,d a c,d b,c b b
(96) UDP-galactose 4-epimerase (I)
100 0 35 32 28 13 35 32 28 13 0.5 0.4 0.3 0.2 0.1 0 a,b a b a,b b b a,b b 100 0 35 32 28 13 35 32 28 13 0.8 0.7 0.6 0.5 0.4 0.3 0.2 0.1 0 a,b,c a c,d c,d a,b b,c,d c,d c 100 0 35 32 28 13 35 32 28 13 0.9 0.8 0.7 0.6 0.5 0.4 0.3 0.2 0.1 0 a,b a a,b a,b a,b a,b b b 100 0 35 32 28 13 35 32 28 13 0.9 0.8 0.7 0.6 0.5 0.4 0.3 0.2 0.1 0 a a,b a,b b b b c c 100 0 35 32 28 13 35 32 28 13 0.8 0.7 0.6 0.5 0.4 0.3 0.2 0.1 0 a a b b b b b b 100 0 35 32 28 13 35 32 28 13 1.8 1.6 1.4 1.2 1.0 0.8 0.6 0.4 0.2 0 a,b a,b a,b b a,b a a,b a,b 100 0 35 32 28 13 35 32 28 13 0.7 0.6 0.5 0.4 0.3 0.2 0.1 0 a a a a a a a a
(53) Mito. dihydrolipoyl dehydrogenase (I) (76) Cytochrome c reductase (I)
(67) a-Enolase (T) (44) Mito. aldehyde dehydrogenase (I) (89) Glutamine synthetase (I) (163) Cu-Zn superoxide dismutase (I)
(167) Cu-Zn superoxide dismutase (I)
Normalized spot volume
Sur μmol l–1
Temp. (°C)
Sur μmol l–1
Temp. (°C)
Sur μmol l–1
Temp. (°C)
Sur μmol l–1
[image:12.612.52.564.60.453.2]Temp. (°C)
Fig. 9.continued on next page.
Fig. 9. Abundance of metabolic and oxidative stress proteins in gill tissue in response to temperature and suramin treatment.(A)Mytilus galloprovincialis. (B)Mytilus trossulus. For more details, see Fig. 6.
Journal
of
Experimental
of PRX4 with increasing HS, it is likely to be the main inducible antioxidant during HS exposure inM. galloprovincialis.With the addition of suramin under HS, increased protein abundance of a Cu-Zn SOD isoform indicates use of an additional antioxidant in conjunction with PRX4, possibly through a PTM, illustrating the ability ofM. galloprovincialisto utilize Cu-Zn SOD as a second line of defense in addition to the already present PRX4. These findings are consistent with previous work identifying antioxidants as a method to combat ROS-induced cellular damage during heat shock and interspecific differences betweenMytilus species (Lockwood et al., 2010; Tomanek and Zuzow, 2010). Interestingly, changes in the mitochondrial PRX5 were not significant, possibly suggesting that mitochondrial ROS production did not increase significantly or that it was sufficiently controlled by Cu-Zn SOD in
M. galloprovincialis(Fig. 8A).
Mytilus trossulusshowed interaction effects for Cu-Zn SOD,
DyP-type peroxidase, two ALDHs and PRX4 (Figs 8B and 9B; cluster I). Soma ferritin, which binds iron to prevent the Fenton reaction with hydrogen peroxide and the subsequent formation of hydroxyl radicals (Tomanek, 2015), showed an interaction effect inM. trossulusbut only a temperature effect inM. galloprovincialis(Figs 8B and 9B). In
M. trossulus, proteins in cluster I (Fig. 8B) showed a trend towards decreasing abundance when under 32°C HS+suramin and 35°C HS with and without suramin, indicating the upper thermal limit of an antioxidant response in this species, which is consistent with previous
findings (Tomanek and Zuzow, 2010). We observed a greater decrease in abundance of Cu-Zn SOD under 35°C HS+suramin in comparison to abundance under 13°C and suramin, or 32°C HS +suramin, and this was observed for PRX4, DyP-type peroxidase and ALDH (Figs 8B and 9B). Additionally, glutathione S-transferase (GST; cluster I) showed a temperature effect with protein abundance decreasing under 35°C HS (Figs 8B and 9B). Our data suggest that in
M. trossulus, the main inducible antioxidants under 32°C HS are
GST, PRX4 and Cu-Zn SOD. The lower induction temperature of these proteins in comparison to findings for M. galloprovincialis parallels the lower thermal tolerance in M. trossulus. In addition, under 35°C HS+suramin, we did not observe increased protein abundance of complementary isoforms of Cu-Zn SOD, as we did in
M. galloprovincialis.
DyP-type peroxidase, a possible scavenger of peroxynitrite in the peroxisome (Trujillo et al., 2008), showed a decrease in abundance under 35°C HS+suramin compared with 35°C HS alone in
M. trossulus(Figs 8B and 9B). These data suggest a decrease in
protein abundance of DyP-type peroxidase is influenced by increasing acute HS (mainly at 35°C) while the addition of suramin further enhances this response (Figs 8B and 9B).
Of the proteins related to oxidative stress that were identified, only SOD and ALDH are known to have a relationship with sirtuins. Specifically, Mn SOD, a SOD distantly related to Cu-Zn SOD, is deacetylated by SIRT3, which enhances the antioxidant activity of 100 0 35 32 28 13 35 32 28 13 1.4 1.2 1.0 0.8 0.6 0.4 0.2 0 a,b a a,b a a a b a,b (17) NADP Isocitrate dehydrogenase (T)
100 0 35 32 28 13 35 32 28 13 0.4 0.3 0.2 0.1 0 a b b b c b b b
(12) Ornithine aminotransferase (I)
100 0 35 32 28 13 35 32 28 13 1.4 1.6 1.2 1.0 0.8 0.6 0.4 0.2 0 a a a,b,c a,b,c a,b,c b,c a,b c
(214) Antiquitin aldehyde dehydrogenase (T) 100 0 35 32 28 13 35 32 28 13 0.7 0.6 0.5 0.4 0.3 0.2 0.1 0 a a a a a a a a
(77) Caffeoyl-CoA O-methyltransferase (I)
100 0 35 32 28 13 35 32 28 13 0.30 0.25 0.20 0.15 0.10 0.05 0 b b b b a b b b
(194) Ribonucleoside-diphosphate reductase (I)
100 0 35 32 28 13 35 32 28 13 0.30 0.25 0.20 0.15 0.10 0.05 0 a a,b a,ba,b,c a,b,c
a,b,c
b,c c
(216) Antiquitin aldehyde dehydrogenase (T) 100 0 35 32 28 13 35 32 28 13 0.25 0.20 0.15 0.10 0.05 0 a,b b a
a a a a a (88) Glutathione S-transferase (T)
100 0 35 32 28 13 35 32 28 13 0.20 0.15 0.10 0.05 0 b b a,b a
a,ba,ba,b
a,b (91) NADH dehydrogenase ubiquinone (I)
Normalized spot volume
100 0 35 32 28 13 35 32 28 13 2.0 1.5 1.0 0.5 0 a c b c b,c b,c b b,c
(37) Cytosolic malate dehydrogenase (I)
100 0 35 32 28 13 35 32 28 13 0.35 0.30 0.25 0.20 0.15 0.10 0.05 0 a b b b b b b b
(281) Phenylalanyl-tRNA synthetase (I) 100 0 35 32 28 13 35 32 28 13 1.0 0.8 0.6 0.4 0.2 0 a,b a,b a,b a a b,c c,d d (55) DyP-type peroxidase (I)
100 0 35 32 28 13 35 32 28 13 1.4 1.2 1.0 0.8 0.6 0.4 0.2 0 b b b b b
b b
a (74) Enoyl-CoA hydratase (I)
100 0 35 32 28 13 35 32 28 13 0.30 0.25 0.20 0.15 0.10 0.05 0 a a a a a,b a b b
(42) 3-Hydroxyl isobuterate dehydrogenase (T) 100 0 35 32 28 13 35 32 28 13 0.4 0.3 0.2 0.1 0 a b
b b b b
b,c
c (80) Electron transfer flavoprotein β (I)
100 0 35 32 28 13 35 32 28 13 0.5 0.4 0.3 0.2 0.1 0 a b b b a b b b 100 0 35 32 28 13 35 32 28 13 0.9 0.8 0.7 0.6 0.5 0.4 0.3 0.2 0.1 0 a,b a a,b b a,b a a,b a,b
(96) ATP synthase (T) (126) Succinate dehydrogenase (T)
100 0 35 32 28 13 35 32 28 13 0.9 0.8 0.7 0.6 0.5 0.4 0.3 0.2 0.1 0 c,d b,c,d b,c a b b d d 100 0 35 32 28 13 35 32 28 13 0.25 0.20 0.15 0.10 0.05 0 a,b a a,b,c a,b,c b,c,d c,d c,d d 100 0 35 32 28 13 35 32 28 13 1.6 1.4 1.2 1.0 0.8 0.6 0.4 0.2 0 a a,b a,b a,b a,b a,b b,c c 100 0 35 32 28 13 35 32 28 13 1.0 0.8 0.6 0.4 0.2 0
b b b b b b a,b a 100 0 35 32 28 13 35 32 28 13 0.25 0.20 0.15 0.10 0.05 0 a c b,c c a,b,c a,b c c 100 0 35 32 28 13 35 32 28 13 0.20 0.15 0.10 0.05 0 b a b a,b a,b b b a,b
(85) Triose phosphate isomerase (I) (193) Ribonucleoside-diphosphate reductase (I) 100 0 35 32 28 13 35 32 28 13 0.6 0.5 0.4 0.3 0.2 0.1 0 a b
b b b b b (102) Soma ferritin (I)
100 0 35 32 28 13 35 32 28 13 0.6 0.5 0.4 0.3 0.2 0.1 0 a,b a a b,c c a,b a,b (184) Aldehyde dehydrogenase (I)
a
(69) 6-Phospho-glucono-lactonase (T,S) (117) Cu-Zn superoxide dismutase (I) (100) Peroxiredoxin 4 (I) (179) Aldehyde dehydrogenase (I)
B
b
Sur μmol l–1
Temp. (°C)
Sur μmol l–1
Temp. (°C)
Sur μmol l–1
Temp. (°C) Sur μmol l–1
Temp. (°C)
Sur μmol l–1
[image:13.612.54.562.62.443.2]Temp. (°C)
Fig. 9.(Continued.)
Journal
of
Experimental
110 Collagen NS 111 Chromosome 15 ORF 26 S
172 Profilin I
55 Fascin NS
81 Actin T
119β-Tubulin NS
98 Tropomyosin T,S
176 Na+/H+ exchange regulatory cofactor I
179α-Tubulin T
181α-Tubulin T
183β-Tubulin NS
28 α-Tubulin NS
87 Actin NS
39 α-Tubulin NS
182α-Tubulin NS
185α-Tubulin NS
57 α-Tubulin T
197α-Tubulin NS
85 Actin T
198 Actin NS
193 Actin NS
217 Actin NS
60 Intermediate filament protein NS
77 Tektin-1 T
184β-Tubulin T
186β-Tubulin T
204β-Tubulin NS
205β-Tubulin T
187β-Tubulin T,S
180β-Tubulin NS
189β-Tubulin T
218 Actin T
223β-Tubulin T
13°C Sur 13°C 28°C Sur28°C 32°C Sur32°C 35°C Sur35°C
III
IV I
II
A
13°C Sur 13°C 28°C Sur28°C 32°C Sur32°C 35°C Sur35°C
II I
III
IV
V
155 Actin NS
157 Actin T
158 Actin T
148 α-Tubulin I
149 α-Tubulin NS
154 Actin T,S
156 Actin NS
27 Actin T
28 Actin T
165 Actin NS
118 Profilin I
41 F-actin capping protein α I 218 Protofilament ribbon RIB43A-1 T
13 Gelsolin T
44 Radial spoke head protein 9 T
94 Actin T,S
240 β-Tubulin T
150 Procollagen α-type 4 T
163 Actin I
247 α-Tubulin I
151 Intermediate filament T 146 α-Tubulin T,S
249 β-Tubulin I
248 α-Tubulin I
250 β-Tubulin I
251 β-Tubulin I
255 β-Tubulin I
168 Collagen NS
169 β-Tubulin I
144 Intermediate filament T
199 Actin I
259 Tropomyosin NS
89 Actin I
166 α-Tubulin I
173 Actin I
260 Actin I
120 Profilin I
171 Actin T
182 Intermediate filament T
32 Tropomyosin I
224 Protofilament ribbon RIB74 NS
180 Tektin-4 I
241 β-Tubulin I
254 β-Tubulin I
257 Actin I
47 Collagen NS
45 Collagen T
197 Actin I
206 Tropomyosin I
215 Fasci