RESEARCH ARTICLE
STATE ESTIMATION BY USE OF WLS STATE TECHNIQUE AND PHASOR MEASUREMENT UNIT
*,1Jitender Kumar and
2Verma, V. K.
1
Electrical Engineering Department, JIMS Engineering Management Technical Campus, Gr. Noida, UP, India
2Principal, G B Pant Institute of Technology, New Delhi, India
ARTICLE INFO ABSTRACT
The conventional technique for power flow measurement of a network system are bulky in nature. The newer technique of Phasor Measurement Unit would be used for measurement of bus voltage and power flow. On usual, the concept of full weighted least square state estimator is follow a nonlinear technique, but in co-operation with PMUs it may improves the accuracy of the measurement without doing a bulky iteration process. In this paper the way of formation of measurement by using Full weighted least square state estimation and PMU device with conventional method will be investigated. A number of cases are tested by use of PMUs and their effect on variables accuracy on Real Power and Reactive Power flows over a system are demonstrated. The assessment of parameter obtained on IEEE 14 bus and IEEE 30 bus system will be discussed.
Copyright©2016, Jitender Kumar and Verma. This is an open access article distributed under the Creative Commons Attribution License, which permits unrestricted use, distribution, and reproduction in any medium, provided the original work is properly cited.
INTRODUCTION
A phasor measurement unit (PMU) (Aminifar et al., 2009; Aminifar et al., 2011; Cho et al., 2001; Dua et al., 2006; Ebrahimpour
et al., 2011; Gou, 2008) endow with synchronised phasor measurements of voltages and currents from widely isolated locations in
an electric power grid. Since PMU was invented, there has been growing interest in developing methodologies for finding the
minimum number of PMUs for complete system observability. The problem was initially introduced in (Baldwin et al., 1993; Madtharad et al., 2003; Meshram and Sahu, 2011; Phadke, 2002); then, several approaches, that can be classified into two groups, the heuristic optimisation technique and conventional deterministic techniques, have been proposed. Examples of the meta-heuristic methods include canonical genetic algorithm (Marınet al., 2003), non-dominated sorting genetic algorithm (Milosevic
and Begovic, 2003), Tabu search (Peng et al., 2006), simulated annealing combined with Tabu search (Cho et al., 2001), particle swarm optimisation (Hajian et al., 2007), adaptive clonal algorithm (Xiaomeng and Jiaju, 2006), differential evolution algorithm (Al-Mohammed et al., 2011) and immunity genetic algorithm (Aminifar et al., 2009). The disadvantage of such methods is the long execution times, which may restrict their applications to large power systems, and the possibility of obtaining a non-optimal solution. On the other side, several research studies based on deterministic approaches have been developed. For instance, in (Xu and Abur, 2004), the integral programming approach is correlate to the PMU placement problem. A method, using integer linear programming for power networks with and without conventional measurements, was proposed in (Gou, 2008). The model presented in (Gou, 2008) was extended in (Gou, 2008) to consider the zero-injection effect, incomplete observability and measurement redundancy. In (Dua et al., 2006), a formulation was planned which applies integral linear programming and incorporates the effect of zero-injection; in addition, a multistage scheduling structure for PMU placement in a given time horizon was suggested. The PMUs placement and conventional flow measurements location are simultaneously considered as decision
variables in (Kavasseri and Srinivasan, 2011). The formulation is initially cause as a non-linear integer programming problem and then transformed into an equivalent integer linear programming. The PMU placement problem using integer quadratic programming was discussed in (Chakrabarti et al., 2009) without consideration of the effect of the zero-injection buses.
*Corresponding author: Jitender Kumar,
Electrical Engineering Department, JIMS Engineering Management Technical Campus, Gr. Noida, UP, India
ISSN: 0975-833X
International Journal of Current Research
Vol. 8, Issue, 08, pp.36906-36916, August, 2016
INTERNATIONAL JOURNAL OF CURRENT RESEARCH
Article History:
Received 16thMay, 2016
Received in revised form 20thJune, 2016 Accepted 07thJuly, 2016
Published online 31stAugust, 2016
Key words:
Wide-area monitoring system (WAMS), Conventional iteration, Full weighted least square (WLS), State technique,
State estimation, Phasor measurement units.
Citation: Jitender Kumar and Verma, V. K. 2016.“State estimation by use of WLS state technique and Phasor measurement unit”,International Journal of Current Research, 8, (08), 36906-36916.
RESEARCH ARTICLE
STATE ESTIMATION BY USE OF WLS STATE TECHNIQUE AND PHASOR MEASUREMENT UNIT
*,1Jitender Kumar and
2Verma, V. K.
1
Electrical Engineering Department, JIMS Engineering Management Technical Campus, Gr. Noida, UP, India
2Principal, G B Pant Institute of Technology, New Delhi, India
ARTICLE INFO ABSTRACT
The conventional technique for power flow measurement of a network system are bulky in nature. The newer technique of Phasor Measurement Unit would be used for measurement of bus voltage and power flow. On usual, the concept of full weighted least square state estimator is follow a nonlinear technique, but in co-operation with PMUs it may improves the accuracy of the measurement without doing a bulky iteration process. In this paper the way of formation of measurement by using Full weighted least square state estimation and PMU device with conventional method will be investigated. A number of cases are tested by use of PMUs and their effect on variables accuracy on Real Power and Reactive Power flows over a system are demonstrated. The assessment of parameter obtained on IEEE 14 bus and IEEE 30 bus system will be discussed.
Copyright©2016, Jitender Kumar and Verma. This is an open access article distributed under the Creative Commons Attribution License, which permits unrestricted use, distribution, and reproduction in any medium, provided the original work is properly cited.
INTRODUCTION
A phasor measurement unit (PMU) (Aminifar et al., 2009; Aminifar et al., 2011; Cho et al., 2001; Dua et al., 2006; Ebrahimpour
et al., 2011; Gou, 2008) endow with synchronised phasor measurements of voltages and currents from widely isolated locations in
an electric power grid. Since PMU was invented, there has been growing interest in developing methodologies for finding the
minimum number of PMUs for complete system observability. The problem was initially introduced in (Baldwin et al., 1993; Madtharad et al., 2003; Meshram and Sahu, 2011; Phadke, 2002); then, several approaches, that can be classified into two groups, the heuristic optimisation technique and conventional deterministic techniques, have been proposed. Examples of the meta-heuristic methods include canonical genetic algorithm (Marınet al., 2003), non-dominated sorting genetic algorithm (Milosevic
and Begovic, 2003), Tabu search (Peng et al., 2006), simulated annealing combined with Tabu search (Cho et al., 2001), particle swarm optimisation (Hajian et al., 2007), adaptive clonal algorithm (Xiaomeng and Jiaju, 2006), differential evolution algorithm (Al-Mohammed et al., 2011) and immunity genetic algorithm (Aminifar et al., 2009). The disadvantage of such methods is the long execution times, which may restrict their applications to large power systems, and the possibility of obtaining a non-optimal solution. On the other side, several research studies based on deterministic approaches have been developed. For instance, in (Xu and Abur, 2004), the integral programming approach is correlate to the PMU placement problem. A method, using integer linear programming for power networks with and without conventional measurements, was proposed in (Gou, 2008). The model presented in (Gou, 2008) was extended in (Gou, 2008) to consider the zero-injection effect, incomplete observability and measurement redundancy. In (Dua et al., 2006), a formulation was planned which applies integral linear programming and incorporates the effect of zero-injection; in addition, a multistage scheduling structure for PMU placement in a given time horizon was suggested. The PMUs placement and conventional flow measurements location are simultaneously considered as decision
variables in (Kavasseri and Srinivasan, 2011). The formulation is initially cause as a non-linear integer programming problem and then transformed into an equivalent integer linear programming. The PMU placement problem using integer quadratic programming was discussed in (Chakrabarti et al., 2009) without consideration of the effect of the zero-injection buses.
*Corresponding author: Jitender Kumar,
Electrical Engineering Department, JIMS Engineering Management Technical Campus, Gr. Noida, UP, India
ISSN: 0975-833X
International Journal of Current Research
Vol. 8, Issue, 08, pp.36906-36916, August, 2016
INTERNATIONAL JOURNAL OF CURRENT RESEARCH
Article History:
Received 16thMay, 2016
Received in revised form 20thJune, 2016 Accepted 07thJuly, 2016
Published online 31stAugust, 2016
Key words:
Wide-area monitoring system (WAMS), Conventional iteration, Full weighted least square (WLS), State technique,
State estimation, Phasor measurement units.
In (Caro et al., 2012), it is presented a participation factor-based approach to optimally allocate a pre-defined number of PMUs
throughout decipherable system in order to maximise the accuracy of the estimated state.
The intention of these papers was to find the nominal number of PMUs that ensures full observability without consideration of transmission line outages. Consequently, the substantial optimal placement of PMUs may not guarantee complete system observability in case of any contingency. In order to design a robust wide-area monitoring system (WAMS), which can make sure that the complete system observability will be under the failure of any transmission line or even a PMU, some works have measured power system contingencies and measurement losses (failure of a PMU or its communication links). For instance, in (Sodhi et al., 2009) Sodhi et al. offered a method for optimal placement of PMUs that ensures system observability under a pre-specified number of critical contingencies, which are identified by performing beforehand a voltage stability analysis. Although such contingencies are critical for the stability of a system, they could have small probability of occurrence; therefore the contingencies by means of higher probability of occurrence and highly negative effect on the system observability could be omitted. In (Chawasak et al., 2007; Zhao et al., 2011), a method for the optimal placement of PMUs that considers two types of contingencies (single loss measurement and branch outage) was presented. The methodology uses a sequential addition approach to search of necessary candidates for single measurement of loss and single-branch outage conditions, which are optimised by binary integral programming and a heuristic method. In (Chakrabarti et al., 2009), the integer quadratic programming approach was used to diminish the total number of PMUs under an outage of a single transmission line or one PMU; however, a list of individual outages of branch to be considered beforehand. This model, which was based on numerical observability analyses, is computationally expensive. In (Milosevic and Begovic, 2003), an optimal set of PMUs, which maximise the measurement redundancy, was found using a non-dominated sorting genetic algorithm and topological observability. The algorithm starts with a set of PMUs that ensures entire observability of the system and the additional PMUs are added in an iterative way until a predefined measurement redundancy has been achieved. In(Aminifar et al., 2010), integer linear programming was proposed for solving the optimal placement of PMU anticipating the losses of a PMU or a line outage. The single line outage effect is added directly to the model by using auxiliary variables. The technique for placing the PMUs in a multiple stages over a given time period that ensures complete power system observability still under a branch outage or a PMU failure was presented in (Sodhi
et al., 2011). The approach proposed in (Aminifar et al., 2010; Chakrabarti et al., 2009; Chawasak et al., 2007; Madtharad et al.,
2005; Milosevic and Begovic, 2003; Sodhi et al., 2009; Sodhi et al., 2011) does not take into account the stochastic nature of power system behaviour, so the WAMS could be designed for ensure observability of either the system under unlikely contingencies or all N− 1 contingencies.
Although the monitoring system may be healthy enough to maintain the system observability anticipating all possible contingencies, the number of PMUs could be very high and the implementation of the system monitoring would be expensive. On the other hand, the random nature of contingencies derives that some transmission lines have higher probability of failure than others. Therefore it is necessary to design a methodology that considers the random nature of the transmission line outages and WAMS component failures. The PMU placement allowing for random operating scenarios and random topologies was initially proposed in (Kamwa and Grondin, 2002). The authors proposed a methodology tofind the optimal location of PMUs for wide-area monitoring and control on large disturbances caused in system; the methodology places a least number of PMUs that maximises the useful information to monitor the dynamic performance of system. In (Aminifar et al., 2011), Aminifar et al.find the optimal
number of PMUs to enhance the system observability by considering random component outages. Through an iterative process,
author’s find the probability of observabilityassociated among all buses, which are averaged to acquire a system index.
This index is subsequently used to select the best solution from all their possible ones. Although author also consider casual outages of the WAMS components, and methodically reliable evaluation methods used to calculate the probability of observability, the algorithm requires finding all the optimal solutions of the PMU placement problem, which might be very large for
comparatively large-scale systems with thousands of buses. The approach proposed in our papers avoid finding of the entire
optimal solutions, it defines the WAMS reliability as the probability of observing all the buses under N − 1 contingencies and it
finds the optimal solution without an exhaustive search of the possible PMU placements. The conventional processes of measurement are too iterative and bulky in nature for the measurement of power flow and voltages on system buses. The full weighted least square state technique (Abur and Exposito, 2005; Kumar Jitender, 2016; Kumar Jitender et al., 2012; Phadke et al., 2009; Rahman et al., 2001) is a nonlinear equation but with first order Taylor series become a linear equation. Some research work are already conducted in formulation of a relation between full weighted least square state and PMUs. The natural technique for measurement of parameters will treat PMU as additional computational problem on measurement and calculation. The problem of finding optimal location of PMU placement strategy for state estimation of power system is investigated. This paper imitate the measurement accuracy with or without using PMU on state estimation parameters. In case 1, the state estimation of system by conventional process without using any PMU device. But in case P, the measurement of parameter done with the use of all PMUs (Kumar Jitender et al., 2012; Miljanic et al., 2012) is discussed.
II. Full weighted least square state estimation method
= . . =
ℎ( , , ,… … … . . )
ℎ( , , ,… … … . . )
ℎ( , , ,.… … … . . )
.
ℎ( , , ,… … … . . )
= . .
= h(x) + e (1) Where:
ℎ= (ℎ ,ℎ ,ℎ , … … … . .ℎ ) (2)
hi(x) is the nonlinear function relating measurement i to the state vector x
= ( , , , … … … . . )is the system state vector
= ( , , , … … … . . )is the vector of measurement errors.
The WLS estimator (1)(25) will minimize the following objective function:
= ∑ ( ) = ( − ℎ ) ( − ℎ ) (3)
At the minimum value of the objective function, the first-order optimality conditions have to be satisfied. These can be expressed in compressed form as follows:
= ( )= − − ℎ = 0 (4)
The non-linear function g(x) can be expanded into its Taylor series (Abur and Exposito, 2005; Kumar Jitender, 2016; Kumar Jitender et al., 2012; Phadke et al., 2009; Rahman et al., 2001) around the state vector xkneglecting the higher order terms.
= + − + … … . . = 0 (5)
An iterative solution scheme known as the Newton method is used to solve above equation:
= − ( ) . ( ) (6)
where, k is the iteration index and xk is the solution vector at iteration k . G(x) is called the gain matrix and it expressed by:
= ( )= ( ) ( ) (7)
= − ( ) − ℎ (8)
Generally, the gain matrix is quite sparse and decomposed into its triangular factors. At each iteration k, the following sparse linear set of equations are solved using forward/backward substitutions, where
∆ = − :
( )∆ = ( ) − ℎ = ( ) ∆ (9)
These iterations are going on until the maximum variable difference satisfies the condition, ‘Max
x
k
’.III. Conventional method
The conventional method (Abur and Exposito, 2005; Kumar Jitender, 2016; Kumar Jitender et al., 2012; Phadke et al., 2009; Rahman et al., 2001) of measurement is basically consider relation of power injection or power flow with respect to line current and line voltage are as
= (( + − 2 )( + ))
i ij ij
V Q
P 2 2
(10)
) sin cos
(
1
ij ij ij ij N
j j i
i V V G B
P
(11)
) cos sin
(
1
ij ij ij ij N
j j i
i V V G B
Q
(12)
The Real and Reactive Power Flow from bus i to bus j are as,
)
sin
cos
(
)
(
2
ij ij ij ij j i ij si i
ij
V
g
g
V
V
g
b
P
(13))
cos
sin
(
)
(
2
ij ij ij ij j i ij si i
ij
V
b
b
V
V
g
b
Q
(14)So the structure of the measurement of Jacobian H will be as
V
V
V
I
I
V
Q
Q
V
Q
Q
V
P
P
V
P
P
H
mag mag mag
flow flow
inj inj
flow flow
inj inj
0
(15)
IV. WLS with conventional method
A PMU will measure multiple current with one voltage phasors. The transmission line normally formed as pie network due to their benefit on system parameters. Fig. 1 shows a 4-bus system example which has single PMU at bus 1. It has one voltage phasor measurement and three current phasor measurements, namely V1
θ1, I1
δ1, I2
δ2and I3
δ3PMU
1 1
V V44
3 3
V
2 2
V
1 1
I
2 2
I
3 3
I
Fig.1. Single PMU Measurement Model
If we define y as the series admittance and yshunt as the shunt admittance, current phasor measurements can be written in
rectangular coordinates as shown in Fig 2.
Iij = Cij + jDij
i j
si si si
shunt Y Y
y yshuntYsjYsjsj
The expressions for Cijand Dijare:
) ( cos )
( cos )
(
cos i si j ij j ij i ij i ij
si i
ij VY VY VY
C (16)
) ( sin )
( sin )
(
sin i si j ij j ij i ij i ij
si i
ij VY V Y VY
D (17)
where, the state vector is given as:
T N N
V V
V V
x[ 1 00, 2 2, 3 3... ] (18)
The ingress of the measurement of Jacobian H corresponding to the real and reactive parts of the current phasors are as:
) cos(
)
cos( i si ij i ij si
i ij
Y Y
V C
(19)
)
cos( j ij
ij j ij
Y V C
(20)
) sin( )
sin( i si i ij i ij si
i i ij
Y V Y
V C
(21)
)
sin( j ij
ij j j
ij
Y V C
(22)
) sin(
)
sin( i si ij i ij si
i ij
Y Y
V D
(23)
) sin( j ij ij
j ij
Y V D
(24)
) cos( )
cos( i si i ij i ij
si i i ij
Y V Y
V D
(25)
) cos( j ij ij
j j ij
Y V D
(26)
The measurement vector zcontains δ,Cij, Dijas well as the power injections, power flows and voltage magnitude measurements.
T T ij T ij T T T flow T flow T inj T
inj
Q
P
Q
V
C
D
P
z
[
,
,
,
,
,
,
,
]
(27)Generally, measurements obtained from PMUs are more precise and accurate as compared to the conventional measurements. Therefore, measurements done with the help of PMUs are expected to generate more precise and accurate result as estimated by conventional methods.
V. State estimation with PMUs
The state vector and measurement data can be expressed in rectangular coordinates. The voltage measurement (V V ) can be expressed as (V = E + jF), and the current measurement can be expressed as (I = C + jD). Where (gij+ jbij) is the series
admittance of the line and (gsi+ jbsi) is the shunt admittance of the transmission line. Line current flow Iijcan be expressed as a
linear function of voltages.
) (
)] (
) [(
)] (
[ )] (
) [(
ij ij j si si ij ij i
si si i ij ij j i ij
jb g V jb g jb g V
jb g V jb g V V I
The measurement vector z is expressed as z = h(x) + e, (where x is a state vector, h(x) isa linear equations matrix, and ‘e’is an error vector). In rectangular coordinates:
z = (Hr + jHm )( E + jF ) + e (29)
where, H = Hr + jHm , x = E + jF and z = A + jB.
A and B are expressed by:
A = HrE–HmF (30)
B = HmE + HrF (31)
In matrix form,
e F E Hr Hm
Hm Hr
B A
(32)
Then, the estimated value
x
ˆ
E
ˆ
j
F
ˆ
can be obtained by solving the linear equation below:z R H G z R H H R H
x T T T
1 1 1 1 1
) (
ˆ (33)
If we define the linear matrix Hnewas
Hr
Hm
Hm
Hr
H
new , then the above equation can be rewritten by:
B A R H H
R H F E
x new newT
T new
1 1
1
) (
ˆ ˆ
ˆ (34)
Therefore, the equation for rectangular formed variable
x
ˆ
can be given by the rectangular forms of H matrix and z vector. In respect of the system accuracy and reliability, PMU can deliver more precise measurement data. Several cases to be tested with PMUs added to the conventional measurement set.The simulations and analysis of different cases are as shown in Table 1 are done with several IEEE bus systems in the next section.
Table 1. Different cases PMU addition in IEEE System
Cases Measurements
1 Conventional with No PMUs
P Only PMUs
VI. Simulation results
For investigate the system accuracy with or without PMU on system variables, some cases are tested with the help of MATLAB software. The testing parameters are available on conventional process with or without PMU.
Table 2. PMU Locations for Each IEEE System
Type of System PMU locations at Bus IEEE 14 System Bus 2, 3, 6, 8, 14
IEEE 30 System Bus 2, 5, 8, 11, 13, 19, 23, 30
Fig.3. IEEE 14 Bus System
Fig.4. IEEE 30 Bus System
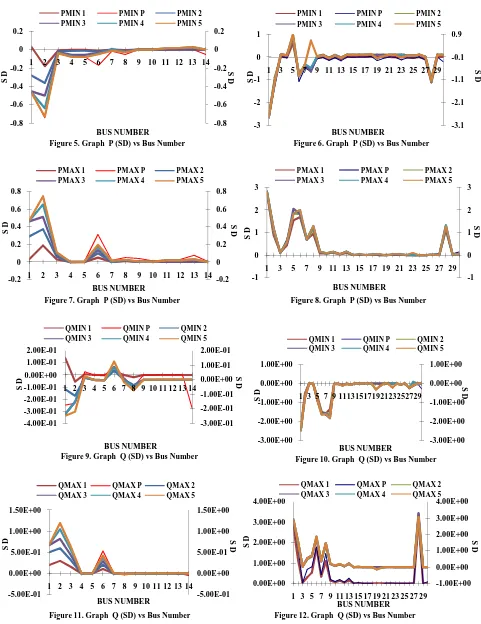
In this segment, IEEE 14 bus system (Kumar Jitender, 2016; Kumar Jitender et al., 2012; http://www.phasor rtdms.com) and IEEE 30 bus system (Ebrahimpour et al., 2011; Kumar Jitender et al., 2013) are tested with their with or without PMU cases to find out the consequences of the PMUs to the precision of the estimated variables. The parameters measured are Real Power and Reactive Power (flow & injected) measurements. The variation of parameters with or without PMU easily reflected in the fig.5 – 12 as below:
powergui Continuous
Tr 7 - 8 - 9 A B C
a2 b2 c2 a3 b3 c3 Tr 5-6 A B C a b c Tr 4-9 A B C a b c Syn 5 1 2 3 Syn 4 1 2 3 Syn 3
1 2 3 Syn 2 1 2 3
Syn 1 1 2 3
Scope
Load 9
A B C
Load 6 A B C Load 5
A B C
Load 4
A B C
Load 3 A B C Load 2 A B C Load 14
A B C
Load 13
A B C
Load 12
A B C
Load 11
A B C
Load 10
A B C
Load 1 A B C
Line 7 - 9 A B C
A B
C Line 7 - 8
A B C
A B C
Line 6 - 13
A B C
A B C
Line 6 - 12 A B C A B C
Line 6 - 11 A B C A B C
Line 5 - 6 A B C A B C
Line 4 - 9 A B C A B C
Line 4 - 7 A B C A B C Line 4 - 5
A B C A B C Line 3 - 4
A B C A B C Line 2-3 A B C A B C
Line 2- 4 A B C A B C
Line 2 - 5 A B C A B C Line 13-14 A B C A B C Line 12-13 A B C A B C Line 1-5 A B C A B C Line 1 - 2
A B C A B C Line 9-14 A B C A B C Line 9-10 A B C A B C Line 10-11 A B C A B C Com 5 1 2 3 Com 4 1 2 3 Com 3 1 2 3 Com 2 1 2 3 Com 1 1 2 3
Bus 9 aA Bb Cc
Bus 8 A B C a b c Bus 7 A B C a b c
Bus 6 aA Bb Cc Bus 5 Aa Bb cC
Bus 4 Aa bB cC Bus 3
A B C a b c Bus 2 Aa Bb cC
Bus 14 Aa bB Cc Bus 13 Aa Bb cC
Bus 12 aA Bb Cc Bus 11 Aa Bb cC
Bus 10 Aa Bb cC Bus 1 Aa Bb cC
powergui Continuous Tr 9-10/11 A B C a2 b2 c2 a3 b3 c3 Tr 7
A B C
a b c
Tr 6-10 A B C a b c Tr 6-1
A B C a b c
Tr 4-12 A B C a b c Syn 6
1 2 3
Syn 5
1 2 3
Syn 4 1 2 3
Syn 3
1 2 3 Syn 2
1 2 3
Syn 1 1 2 3 Scope Load 8
A B C
Load 7 A B C Load 5 A B C Load 4 A B C Load 30 A B C Load 3
A B C
Load 29
A B C
Load 26 A B C Load 241 A B C Load 24
A B C
Load 23
A B C
Load 21 A B C Load 20 A B C Load 2 A B C Load 19
A B C
Load 18
A B C
Load 17 A B C
Load 16
A B C
Load 15 A B C Load 14 A B C Load 12
A B C
Load 101 A B C Load 10
A B C
Line 2 - 5 A B C A B C
Line 9 - 11 A B C A B C
Line 9 - 10 A B C A B C Line 8 - 28
A B C A B C
Line 6 - 9 A B C A B C Line 6 - 8
A B C A B C
Line 6 - 7 A B C A B C
Line 6 - 28 A B C A B C
Line 6 - 10 A B C A B C Line 5 - 7
A B C A B C
Line 4 - 6 A B C A B C
Line 4 - 12 A B C A B C
Line 3 - 4 A B C A B C
Line 29 - 30 A B C A B C
Line 27 - 30 A B C A B C
Line 27 - 29 A B C A B C
Line 25 - 27 A B C A B C Line 25 - 26
A B C A B C
Line 24 - 25
A B C A B C
Line 23 - 24 A B C A B C Line 22 - 24
A B C A B C
Line 21 - 22 A B C A B C
Line 2 - 6 A B C A B C
Line 2 - 4 A B C A B C
Line 19 - 20 A B C A B C
Line 18 - 19 A B C A B C Line 16 - 17
A B C A B C
Line 15 - 23 A B C A B C Line 15 - 18
A B C A B C
Line 14 - 15 A B C A B C Line 12 - 16
A B C A B C
Line 12 - 15
A B C A B C
Line 12 - 14
A B C A B C
Line 12 - 13 A B C A B C
Line 10 - 22 A B C A B C
Line 10 - 21 A B C A B C Line 10 - 20
A B C A B C Line 10 - 17 A B C A B C
Line 1 - 3
A B C
A B C
Line 1 - 2 A B C A B C Line 27 - 28
A B C A B C
Com 8123 Com 7 1 2 3 Com 6 1 2 3 Com 5
123
Com 4
123
Com 3 1 2 3 Com 2 1 2 3 Com 1 1 2 3 Bus 9 A B C a b c Bus 8 A B C a b c
Bus 7 Aa Bb cC
Bus 6 Aa Bb Cc
Bus 5 Aa bB cC
Bus 4 Aa bB Cc
Bus 30 A B C a b c
Bus 3 aA Bb Cc
Bus 29 aA Bb Cc
Bus 28
A B C a b c
Bus 27 A B C a b c Bus 26 A B C a b c Bus 25 A B C a b c
Bus 24 aA Bb Cc
Bus 23 A B C a b c
Bus 22 Aa Bb Cc
Bus 21 A B C a b c
Bus 20 Aa Bb Cc
Bus 2 Aa Bb cC
Bus 19 Aa bB Cc Bus 18 Aa Bb Cc
Bus 17 A B C a b
c Aa Bb CcBus 16
Bus 15 Aa Bb cC
Bus 14 A B C a b c Bus 13 A B C a b c
Bus 12 Aa bB cC
Table 3. Average Std. Dev. of the Estimated Variables
Type of Var. Type of System Case 1 Case P
Min Max Min Max
Real Power (P) 14 Bus -0.0132 0.02107 -0.1210 0.1349 30 Bus -0.2006 0.36544 -0.2544 0.430102 Reactive Power (Q) 14 Bus 0.00754 0.05437 -0.0563 0.216506 30 Bus -0.2845 0.38847 -0.3699 0.45857
-0.8 -0.6 -0.4 -0.2 0 0.2
-0.8 -0.6 -0.4 -0.2 0 0.2
1 2 3 4 5 6 7 8 9 10 11 12 13 14
S
D
S
D
BUS NUMBER
Figure 5. Graph P (SD) vs Bus Number
PMIN 1 PMIN P PMIN 2
PMIN 3 PMIN 4 PMIN 5
-3.1 -2.1 -1.1 -0.1 0.9
-3 -2 -1 0 1
1 3 5 7 9 11 13 15 17 19 21 23 25 27 29 S D
S
D
BUS NUMBER
Figure 6. Graph P (SD) vs Bus Number
PMIN 1 PMIN P PMIN 2
PMIN 3 PMIN 4 PMIN 5
-0.2 0 0.2 0.4 0.6 0.8
-0.2 0 0.2 0.4 0.6 0.8
1 2 3 4 5 6 7 8 9 10 11 12 13 14
S
D
S
D
BUS NUMBER
Figure 7. Graph P (SD) vs Bus Number
PMAX 1 PMAX P PMAX 2
PMAX 3 PMAX 4 PMAX 5
-1 0 1 2 3
-1 0 1 2 3
1 3 5 7 9 11 13 15 17 19 21 23 25 27 29
S
D
S
D
BUS NUMBER
Figure 8. Graph P (SD) vs Bus Number
PMAX 1 PMAX P PMAX 2
PMAX 3 PMAX 4 PMAX 5
-3.00E-01 -2.00E-01 -1.00E-01 0.00E+00 1.00E-01 2.00E-01
-4.00E-01 -3.00E-01 -2.00E-01 -1.00E-01 0.00E+00 1.00E-01 2.00E-01
1 2 3 4 5 6 7 8 9 10 11 12 13 14
S
D
S
D
BUS NUMBER
Figure 9. Graph Q (SD) vs Bus Number
QMIN 1 QMIN P QMIN 2
QMIN 3 QMIN 4 QMIN 5
-3.00E+00 -2.00E+00 -1.00E+00 0.00E+00 1.00E+00
-3.00E+00 -2.00E+00 -1.00E+00 0.00E+00 1.00E+00
1 3 5 7 9 11131517192123252729
S
D
S
D
BUS NUMBER
Figure 10. Graph Q (SD) vs Bus Number
QMIN 1 QMIN P QMIN 2
QMIN 3 QMIN 4 QMIN 5
-5.00E-01 0.00E+00 5.00E-01 1.00E+00 1.50E+00
-5.00E-01 0.00E+00 5.00E-01 1.00E+00 1.50E+00
1 2 3 4 5 6 7 8 9 10 11 12 13 14
S
D
S
D
BUS NUMBER
Figure 11. Graph Q (SD) vs Bus Number
QMAX 1 QMAX P QMAX 2
QMAX 3 QMAX 4 QMAX 5
-1.00E+00 0.00E+00 1.00E+00 2.00E+00 3.00E+00 4.00E+00
0.00E+00 1.00E+00 2.00E+00 3.00E+00 4.00E+00
1 3 5 7 9 11 13 15 17 19 21 23 25 27 29
S
D
S
D
BUS NUMBER Figure 12. Graph Q (SD) vs Bus Number
QMAX 1 QMAX P QMAX 2
[image:8.595.125.471.700.762.2]The table 3 shows that how the S.D. values at each case are increases as compared to the S.D. of ‘Case P’. In IEEE 30 bus system, the S.D. of the estimated current magnitude is approximately 0.02663 when there is no PMUs, but after adding PMUs to the system, it becomes nearly 0.046256. It means that the S.D. of ‘No PMUs’ is increased by adding of PMUs. The interesting thing is
that the standard deviation increasing as increasing PMU. Therefore, this result shows that the effectively installing of PMUs is reducing the chances of error in measurement of estimated variables.
The Average Current and Average Real Power (flow & injected) are analyze on IEEE 14 Bus & IEEE 30 Bus System (where 141 & 301 for without PMU device and 14P & 30P for with PMU device). The variation of these parameters with or without PMU reflected in the fig.13–20 as below:
-0.15
-0.1
-0.05
0 1
AVE
RA
GE
S
D
Fig. 13. Real Power(for 14 Bus System
PMIN141 PMIN142 PMIN143
PMIN144 PMIN145 PMIN14P
-0.1 -0.05 0 0.05 0.1 0.15
1
AVE
RA
GE
S
D
Fig. 15. Real Power for 14 Bus System
PMAX141 PMAX142 PMAX143
PMAX144 PMAX145 PMAX14P
-0.06 -0.04 -0.02 0 0.02
1
AVE
RA
GE
S
D
Fig. 17. Reactive Power for 14 Bus System
QMIN141 QMIN142 QMIN143
QMIN144 QMIN145 QMIN14P
0 0.1 0.2 0.3
1
AVE
RA
GE
S
D
Fig. 19. Reactive Power for 14 Bus System
QMAX141 QMAX142 QMAX143
QMAX144 QMAX145 QMAX14P
The table 3 shows that how the S.D. values at each case are increases as compared to the S.D. of ‘Case P’. In IEEE 30 bus system, the S.D. of the estimated current magnitude is approximately 0.02663 when there is no PMUs, but after adding PMUs to the system, it becomes nearly 0.046256. It means that the S.D. of ‘No PMUs’ is increased by adding of PMUs. The interesting thing is
that the standard deviation increasing as increasing PMU. Therefore, this result shows that the effectively installing of PMUs is reducing the chances of error in measurement of estimated variables.
The Average Current and Average Real Power (flow & injected) are analyze on IEEE 14 Bus & IEEE 30 Bus System (where 141 & 301 for without PMU device and 14P & 30P for with PMU device). The variation of these parameters with or without PMU reflected in the fig.13–20 as below:
Fig. 13. Real Power(for 14 Bus System
PMIN143 PMIN14P
-0.3
-0.2
-0.1
0 1
AVE
RA
GE
S
D
Fig. 14. Real Power for 30 Bus System
PMIN301 PMIN302
PMIN304 PMIN305
Fig. 15. Real Power for 14 Bus System
PMAX143 PMAX14P
0.32 0.34 0.36 0.380.4 0.42 0.44
1
AVE
RA
GE
S
D
Fig. 16. Real Power for 30 Bus System
PMAX301 PMAX302
PMAX304 PMAX305
Fig. 17. Reactive Power for 14 Bus System
QMIN143 QMIN14P
-0.4 -0.3 -0.2 -0.1
0 1
AVE
RA
GE
S
D
Fig. 18. Reactive Power for 30 Bus System
QMIN301 QMIN302
QMIN304 QMIN305
Fig. 19. Reactive Power for 14 Bus System
QMAX143 QMAX14P
0.35 0.4 0.45 0.5
1
AVE
RA
GE
S
D
Fig. 20. Reactive Power for 30 Bus System
QMAX301 QMAX302
QMAX304 QMAX305
The table 3 shows that how the S.D. values at each case are increases as compared to the S.D. of ‘Case P’. In IEEE 30 bus system, the S.D. of the estimated current magnitude is approximately 0.02663 when there is no PMUs, but after adding PMUs to the system, it becomes nearly 0.046256. It means that the S.D. of ‘No PMUs’ is increased by adding of PMUs. The interesting thing is
that the standard deviation increasing as increasing PMU. Therefore, this result shows that the effectively installing of PMUs is reducing the chances of error in measurement of estimated variables.
The Average Current and Average Real Power (flow & injected) are analyze on IEEE 14 Bus & IEEE 30 Bus System (where 141 & 301 for without PMU device and 14P & 30P for with PMU device). The variation of these parameters with or without PMU reflected in the fig.13–20 as below:
Fig. 14. Real Power for 30 Bus System
PMIN302 PMIN303
PMIN305 PMIN30P
Fig. 16. Real Power for 30 Bus System
PMAX302 PMAX303
PMAX305 PMAX30P
Fig. 18. Reactive Power for 30 Bus System
QMIN302 QMIN303
QMIN305 QMIN30P
Fig. 20. Reactive Power for 30 Bus System
QMAX302 QMAX303
VII. Conclusion
This paper proposes an integral linear technique for an optimal contingency - constrained related to PMU placement in electric networks. The methodology also considers the failure probability of the system components that might be prevent operation of the PMUs. The approach of selecting an appropriate quantity of PMUs to meet the desirable observability and reliability criteria on considering N− 1 contingencies. The intention of the classical optimisation model was modeled in order to find solutions that increase the availability of the measuring equipment. Therefore the model will locates the PMUs at specific buses which result in the best global reliability of the WAMS. Results showed that the proposed modelfinds the least number of PMUs to makesure a desired level of reliability, which increase the monitoring system robustness bearing in mind the most likely transmission lines outages. The PMU availability for measuring channels was incorporated in the model, so more realistic and useful results can be obtained. Results show that the system observability is reached and WAMS reliability is also improved with increase of PMUs. The objective function was formulated in such a way that the minimisation of the number of PMUs has a high priority with the maximisation of covered contingencies and the channel limit constraint increase the number of PMUs as per the boost of power required by respective load buses.
REFERENCES
Abur and Exposito A. G., Power System State Estimation, Theory and Implementation, MAECEL DEKKER, 2005, pp. 9-27. Al-Mohammed, A.H., Abido, M.A., Mansour, M.M.: ‘Optimal PMU placement for power system observability using differential
evolution’. Proc. 11th Int. Conf.Intelligent Systems Design and Applications (ISDA), November 2011, pp. 277–282
Aminifar, F., Fotuhi-Firuzabad, M., Shahidehpour, M., Khodaei, A.:‘Observability enhancement by optimal PMU placement considering random power system outages’, Energy Syst., 2011, 2, (1), pp. 45–65
Aminifar, F., Fotuhi-Firuzabad, M., Shahidehpour, M., Khodaei, A.: ‘Probabilistic multistage PMU placement in electric power systems’, IEEE Trans. Power Deliv., 2011, 26, (2), pp. 841–849
Aminifar, F., Khodaei, A., Fotuhi-Firuzabad, M., Shahidehpour, M.:‘Contingency constrained PMU placement in power networks’, IEEE Trans. Power Syst., 2010, 25, (1), pp. 516–523
Aminifar, F., Lucas, C., Khodaei, A., Fotuhi-Firuzabad, M.: ‘Optimal placement of phasor measurement units using immunity genetic algorithm’, IEEE Trans. Power Deliv., 2009, 24, (3), pp. 1014–1020
Baldwin, T.L., Mili, L., Boisen, M.B., Adapa, R.: ‘Power system observability with minimal phasor measurement placement’,
IEEE Trans. Power Syst., 1993, 8, (2), pp. 707–715
Caro, E., Singh, R., Pal, B.C., Conejo, A.J., Jabr, R.A.: ‘Participationfactor approach for phasor measurement unit placement in
power system state estimation’, IET Gener. Transm. Distrib., 2012, 6, (9), pp. 922–929
Chakrabarti, S., Kyriakides, E., Eliades, D.G.: ‘Placement of synchronized measurements for power system observability’, IEEE
Trans. Power Deliv., 2009, 24, (1), pp. 12–19
Chawasak, R., Suttichai, P., Sermsak, U., Watson, N.R.: ‘An optimal PMU placement method against measurement loss and
branchoutage’, IEEE Trans. Power Deliv., 2007, 22, (1), pp. 101–107
Cho, K.S., Shin, J.R., Hyun, S.H.: ‘Optimal placement of phasor measurement units with GPS receiver’. Proc. IEEE Power Engineering Society Winter Meeting, January/February 2001, vol. 1, pp. 258–262
Dua, D., Dambhare, S., Gajbhiye, R.K., Soman, S.A.: ‘Optimal multistage scheduling of PMU placement: an ILP approach’, IEEE
Trans. Power Deliv., 2006, 23, (4), pp. 1812–1820
Ebrahimpour R., Abharian E. K., Moussavi S. Z. and Birjandi A. A. M., “Transient Stability Assessment of a Power System by Mixture ofExperts”,International Journal of Engineering, (IJE) Volume (4): Issue (1) March 2011 pp.93–104.
Gou, B.: ‘Generalized integer linear programming formulation foroptimal PMU placement’, IEEE Trans. Power Syst., 2008, 23,
(3), pp. 1099–1104
Gou, B.: ‘Optimal placement of PMUs by integer linear programming’,IEEE Trans. Power Syst., 2008, 23, (3), pp. 1525–1526
Hajian, M., Ranjbar, A.M., Amraee, T., Shirani, A.R.: ‘Optimalplacement of phasor measurement units: particle swarm optimizationapproach’. Proc. Int. Conf. Intelligent Systems Application PowerSystems, November 2007, pp. 1–6
Kamwa, I., Grondin, R.: ‘PMU configuration for system dynamicperformance measurement in large, multiarea power
systems’, IEEE Trans. Power Syst., 2002, 17, (2), pp. 385–394
Kavasseri, R., Srinivasan, S.K.: ‘Joint placement of phasor andconventional powerflow measurements for fault observability of power systems’, IET Gener. Transm. Distrib., 2011, 5, (10), pp. 1019–1024
Klump R., Wilson R.E. and Martin K.E., “Visualizing Real-Time Security Threats Using Hybrid SCADA / PMU Measurement
Displays”, Proceedings of the 38th Hawaii International Conference onSystem Sciences–2005, 0-7695-2268-8/05/$20.00 (C) 2005 IEEE, pp.1–9
Korkali, M., Abur, A.: ‘Placement of PMUs with channel limits’. Proc.Power & Energy Society General Meeting July 2009, July 2009, pp. 1–4
Kumar Jitender, " Impact of Phasor Measurement Unit on the State Estimation of Large Power System" International Journal of
Advance Research and Innovation (IJARI), ISSN: 2347 - 3258, Volume 4 , Issue 1 , March –2016, pp. 1 - 7.
Kumar Jitender, Rai J.N., and Vipin, “Power System State Estimation by use of WLS with Phasor Measurement Unit (PMU)”,
International Journal of Engineering RESEARCH and Technology (IJERT). ISSN : 2778– 0181 Vol.2, Issue 2, February–
Kumar Jitender, Rai J.N., Hasan Naimul, “Use of Phasor Measurement Unit (PMU) for Large Scale Power System State
Estimation”, 2012 IEEE fifth India International Conference on Power Electronics, IICPE2012, Delhi Technological
University, New Delhi, India, ISSN : 2160-3162, Print ISBN : 978-1-4673-0931-8, December–2012, pp. 1-5
Kumar Jitender, Rai J.N., Vipin, and Sengar Ramveer S., “Effect of Phasor Measurement Unit (PMU) on the Network Estimated Variables”, ACEEE International Journal of Electrical and Power Engineering (ACEEE-IJEPE). ISSN : 2158 –7574, DOI: 01.IJEPE. 4.1.2 © 2013 ACEEE, Vol.4, Number 1, February–2013, pp. 46–51.
Kumar Jitender, Rai J.N., Vipin, Arora B.B. and Singh C.K., “Improvement in Power System State Estimation by Use of Phasor
Measurement Unit”, International Journal of Engineering RESEARCH and Technology (IJERT). ISSN : 2778– 0181 Vol.1, Issue 8, October–2012, pp. 1-6
Madtharad C., Premrudeepreechacharn S., Watson N.R. and Saeng-Udom R., “An Optimal Measurement Placement Method for
Power System Harmonic State Estimation”, IEEE TRANSACTIONS ON POWER DELIVERY, VOL. 20, NO. 2, APRIL
2005, 0885-8977/$20.00 © 2005 IEEE, pp.1514-1521
Madtharad C., Premrudeepreechacham S., Watson N. R. and Saenrak D., “Measurement Placement Method for Power System State Estimation: Part I”, 0-7803-7989-6/03/$17.00 ©2003 IEEE, pp.1629–1632
Marın, F.J., Garcıa-Lagos, F., Joya, G., Sandoval, F.: ‘Genetic algorithms for optimal placement of phasor measurement units in electric networks’, Electron. Lett., 2003, 39, (19), pp. 1403–1405
Meshram S. and Sahu O.P., “Application of ANN in economic generation scheduling in IEEE 6-Bus System”, International
Journal of Engineering Science and Technology (IJEST). ISSN : 0975-5462 Vol. 3 No. 3, 2011, pp.2461–2466
Miljanic, Z., Djurovic, I., Vujosevic, I.: ‘Optimal placement of PMUs with limited number of channels’, Electr. Power Syst. Res.,
2012, 90, pp. 93–98.
Milosevic, B., Begovic, M.: ‘Non-dominated sorting genetic algorithm for optimal phasor measurement placement’, IEEE Trans.
Power Syst., 2003, 18, (1), pp. 69–7
Najafabadi, A.M., Alouani, A.T.: ‘Optimal PMU placement algorithm with minimum measurement channels’. Proc. Southeastcon,
March 2011, pp. 153–157
Peng, J., Sun, Y., Wang, H.F.: ‘Optimal PMU placement for full network observability using Tabu search algorithm’, Electr.
Power Syst. Res., 2006, 28, (4), pp. 223–231
Phadke A.G, Thorp J.S., Nuqui R.F. and Zhou M., “Recent Developments in State Estimation with Phasor Measurements”, 978 -1-4244-3811-2/09 ©2009 IEEE, pp.1-7
Phadke A.G., “SYNCHRONIZED PHASOR MEASUREMENTS – A HISTORICAL OVERVIEW”, 0-7803-7525-4/02 © 2002 IEEE, pp.476–479
Rahman K. A., Mili L., Phadke A., Ree J. D. L. & Liu Y., “Internet Based Wide Area Information Sharing and Its Roles in Power System State Estimation”, 0-7803-6672-7/01 © 2001 IEEE, pp.470–475
Real time dynamics monitoring system (Online). Available: http://www.phasor rtdms.com
Sodhi, R., Srivastava, S.C., Singh, S.N.: ‘Multi-criteria decision-making approach for multi-stage optimal placement of phasor measurement units’, IET Gener. Transm. Distrib., 2011, 5, (2), pp. 181–190
Sodhi, R., Srivastava, S.C., Singh, S.N.: ‘Optimal PMU placement to ensure system observability under contingencies’. Proc.
Power and Energy Society General Meeting, July 2009, pp. 1–6
Xiaomeng, B., Jiaju, Q.: ‘Adaptive clonal algorithm and its application for optimal PMU placement’. Proc. Int. Conf.
Communications, Circuits and Systems, June 2006, vol. 3, pp. 2102–2106
Xu, B., Abur, A.: ‘Observability analysis and measurement placementfor system with PMUs’. Proc. IEEE Power Systems Conf.
Exposition, October 2004, vol 2, pp. 943–946
Zhao, Z., Makram, E.B.: ‘Optimal PMU placement considering number of analog channels’. Proc. North American Power
Symposium (NAPS), August 2011, pp. 1–5