ISSN Online: 2152-7261 ISSN Print: 2152-7245
DOI: 10.4236/me.2019.101011 Jan. 14, 2019 156 Modern Economy
Housing Price and Upgrading of Consumption
Structure of Urban Residents in China
Zhihua Dai
College of Economics, Jinan University, Guangzhou, China
Abstract
This paper uses China Family Panel Studies of 2012 and 2014 year. The data examined the impact of rising housing prices on upgrading the consumption structure of urban residents. It turns out, in terms of the body, the rise in housing prices has inhibited the upgrading of the household consumption structure. For the family that rents commercial housing in the market, the rise has significantly inhibited the upgrading of the household consumption structure. The change of the proportion of high-level consumption structure to housing price is the most sensitive. For households with homes, if prices go up, the increase will significantly increase the share of households with mul-tiple homes in the development and enjoyment of consumer spending, that is to say, multiple housing families have a greater wealth effect in the face of rising house prices. For households with one home, the wealth effect is not obvious, and the rise in house prices remains inhibitory effect, but not signif-icant.
Keywords
Housing Price, Upgrading of Consumption Structure, CFPS
1. Introduction
After the “house reform” in 1998, with the development of the real estate mar-ket, China’s housing prices continued to rise. The average selling price of com-mercial housing in the country rose from 2063 yuan per square meter in 1998 to 3800 yuan per square meter in 2008. As of 2017, this value continued to reach 7900 yuan/square meter. The average sales price of commercial housing in the country increased by 262% between 1998 and 2017, while the average sales price of commercial housing in Beijing, Shanghai and other “first-tier cities” increased even more. At the same time, the Chinese economy has entered a new normal, How to cite this paper: Dai, Z.H. (2019)
Housing Price and Upgrading of Con-sumption Structure of Urban Residents in China. Modern Economy, 10, 156-174. https://doi.org/10.4236/me.2019.101011
Received: December 21, 2018 Accepted: January 11, 2019 Published: January 14, 2019
Copyright © 2019 by author(s) and Scientific Research Publishing Inc. This work is licensed under the Creative Commons Attribution International License (CC BY 4.0).
DOI: 10.4236/me.2019.101011 157 Modern Economy and the traditional economic development mode that relies on investment and export lacks new impetus, stimulates domestic consumption, and promotes the upgrading of consumption structure as an inevitable choice for transforming the mode of economic development.
However, after entering the 21st century, the pace of upgrading the consump-tion structure is very slow. According to the data of the Naconsump-tional Bureau of Sta-tistics, from 2004 to 2013, the Engel’s Coefficient1 of urban residents dropped from 37.66% to 35.0%, only 2.66% in 10 years. At the same time, the proportion of urban development and enjoyable consumption expenditure increased from 33.48% to 34.10%, and only 0.62% in 10 years, compared with developed coun-tries. Compared with that, the upgrading of consumption structure is slow. On the other hand, as an important commodity and investment target, the rapid rise of housing prices will inevitably affect residents’ consumption and savings’ deci-sion-making, and then affect the upgrading of consumption structure. Although many discussions have been made on the relationship between housing prices and residents’ low consumption rate and high savings rate, few studies have been conducted on the relationship between housing prices and residents’ consump-tion at the level of consumpconsump-tion structure upgrading. The relaconsump-tionship between house price and the upgrading of consumption structure needs further discus-sion.
Domestic research on household consumption structure is basically in its in-fancy. Most of the research on house price and consumption structure focuses on the macro field, mainly using liquidity constraints, preventive savings and other theories to do empirical research. In view of this, this paper chooses China Family Panel Studies (CFP2014, CFPS2012) to study the relationship between housing prices and the upgrading of household consumption structure of urban residents. The data are from the China Social Science Research Center of Peking University, so as to provide policy basis for formulating the correct housing price control policy and promoting the upgrading of consumption structure.
2. Literature Review
In theory, rising house prices will affect residents’ consumption decisions. One view is that rising house prices restrain consumption [1]. In the upstream stage of the real estate market, rising house prices have become one of the important factors driving up the savings rate. When house prices continue to rise, people save for buying houses, save for repaying housing loans, and push up the savings rate [2]. Another view is that rising housing prices generally lead to an increase in the propensity of urban residents to consume [3]. Some studies even argue that the rise in housing prices cannot explain the rise in the savings rate of urban residents in China. On the contrary, there is a negative relationship between the savings rate of residents of different types of property rights and the rise in housing prices [4], from the point of view of the existing research, the
DOI: 10.4236/me.2019.101011 158 Modern Economy sions are not uniform. However, after reviewing the relevant literature of do-mestic and foreign scholars, it is found that the literature on the impact of hous-ing prices on consumption is roughly based on three kinds of impact mechan-isms: wealth effect, liquidity constraint effect and substitution effect.
“Wealth effect” is the most commonly used theory to study the impact of housing prices on consumption. As an important part of household wealth, housing assets will inevitably lead to the increase of household wealth, and the increase of wealth will stimulate more consumption [5]. Ludwig and Slok diffe-rentiate wealth effects into “convertible wealth effects” and “non-convertible wealth effects”. Convertible wealth effects refer to the increase of household cur-rent income and household consumption expenditure caused by rising house prices for households with rental, sale or bank mortgage. The non-convertible wealth effect refers to the fact that although rising house prices have caused the increase of household housing assets, households have not taken such actions as house transaction, transfer and rental, which has not resulted in the increase of current income, but expect more household wealth in the future, and this ex-pected increase in income will also increase household consumption expendi-ture. Gan [6] research shows that real estate wealth has a significant pulling ef-fect on household consumption. Case, Shiller and Quigley use data from various states and countries in the United States to make empirical analysis and find that when housing prices rise, there will be a significant wealth effect. Benjamin et al.
[7] used macro data to empirically analyze the relationship between house price and consumption. The empirical results show that house price and consumption are positively correlated, and the wealth effect of house price rise on consump-tion far exceeds the wealth effect of stock rise. When lending constraints loosen and house prices rise, some households will increase current consumption through mortgage loans and house sales [8] [9]. But Chen Jian and others [10]
believe that China’s credit constraints can not exert the wealth effect of housing. Using micro-data, we can analyze the heterogeneous effect of housing prices on consumption. As far as wealth effect is concerned, Campbell and Coco [11]
found that wealth effect is very obvious in the elderly who have a house, but it has little effect on the young people who rent a house. But Skinner [12] and Lehnert [13] concluded that the wealth effect is equally significant among young people, and that younger generations are more willing to borrow and cash in the face of rising house prices than older people.
DOI: 10.4236/me.2019.101011 159 Modern Economy would rise by 0.26 percentage points. Sheiner [15] also found that rising house prices would increase the savings rate. For young people who rent in high-price cities, they would save more than those who rent in low-price cities. From the perspective of domestic research, Chen Yanbin and others [16] believe that the burden of house purchasing caused by rising house prices is an important reason for the current high savings rate of young families.
On the other hand, for low- and middle-income households who rent a house, when the house price rises to the point where they can not afford to buy a house, they may give up or delay the purchase of a house, which leads to an increase in consumption in the current period. This kind of rise in house price causes an increase in consumption, which is called the “substitution effect”. Yoshikawa and Ohtaka [17] pointed out that when house prices rose, many young rental families abandoned their plans to buy houses and used the wealth they had planned to buy for current consumption. In domestic research, Du Li et al. [18]
also found this substitution effect when studying the relationship between hous-ing prices and urban residents’ consumption in Shanghai.
From the existing literature, the research literature on housing price and con-sumption level is very rich, but the research literature on the changes of housing price and consumption structure is very few. It is worth noting that Wang Wei, Liu Zhigang and Gong Feifei use panel data of 35 large and medium-sized cities to study the impact of high housing prices on the upgrading of consumption structure. The article points out that the rise of housing price restrains the up-grading of consumption structure. For every 1 percentage point increase in house prices, the consumer structure upgrading index will fall by 0.27 percen-tage points. Although their research has noticed the relationship between house price and consumption structure change, it is based on the research results of macro data, and there is no systematic theoretical mechanism to sort out the impact of house price on the upgrading of consumption structure. Therefore, the relationship between house price and household consumption structure change of urban residents and the underlying mechanism need to be further demon-strated.
3. The Mechanism of Housing Price Affecting the Change of
Consumption Structure
3.1. The Connotation of Upgrading Consumption Structure
DOI: 10.4236/me.2019.101011 160 Modern Economy expenditure is regarded as the consumption structure. Engels divided the means of subsistence into subsistence, enjoyment and development, which will become one of the important classification methods to measure consumption structure in the future. The upgrading of consumption structure refers to the process in which residents’ consumption structure evolves and advances from a lower standard of living to a higher quality of life, which is roughly manifested in two forms: first, the proportion of the original consumption categories remains bas-ically unchanged, but the internal evolution of each consumption category to-wards a higher quality direction, such as eating healthier and greener food, using better household goods, and living better house, although the proportion of consumption categories has not changed, but the quality of life has improved. Second, with the addition of new consumption items, the ranking of different consumption categories has changed. Higher consumption categories account for a higher proportion. For example, as society pays more attention to educa-tion and spiritual enjoyment, there will be more expenditure on entertainment, so that the proportion of development and Enjoyment-oriented consumption will be higher. The former is an improved upgrading, while the latter is a revolu-tionary upgrading of consumption structure. In reality, there is no single up-grading of consumption structure, and these two situations often coexist. For example, we used to wear clothes, eat coarse grain, live in small courtyards, tra-vel by bicycle, but now we pursue more fashionable clothes, eat fine grain, live in residential buildings, and drive private cars. This evolution has both improved consumption structure upgrading and revolutionary structure upgrading. The consumption structure upgrading studied in this paper mainly refers to the re-volutionary consumption structure upgrading, usually leather. The upgrading of lifelong consumption structure will lead to the upgrading of improved con-sumption structure.
3.2. The Influencing Mechanism of House Price Rising on the
Change of Consumption Structure
Rising house prices restrain the upgrading of consumption structure. The fol-lowing three mechanisms hinder the upgrading of consumption structure: cost effect, Preventive Savings effect and liquidity constraint effect.
DOI: 10.4236/me.2019.101011 161 Modern Economy 2) Preventive savings effect. As China’s housing prices have remained high, this has led to the expectation that housing prices will continue to rise. This ex-pectation will cause families with real demand for housing to worry about in-creasing Preventive Savings in the future with higher costs or incomes that can not keep pace with the rise in housing prices. This increase in savings will reduce the development-oriented consumption of education, training, culture, leisure and entertainment. Expenditure has slowed down the upgrading of consumption structure.
3) Liquidity constraints. High housing prices will increase the down payment of housing purchase, while loans in the credit market will increase the liquidity constraints of consumers, thus inhibiting the development and enjoyment con-sumption categories of residents.
Rising house prices are driving the upgrading of consumption structure. It mainly hinders the upgrading of consumption structure through the following two mechanisms: the exchange wealth effect, the non-exchange wealth effect and the substitution effect.
1) The wealth effect of exchange. For households with a house, rising house prices mean that the value of the house they hold rises. They can obtain higher household wealth by renting, selling or refinancing. The increase of household wealth will make these households turn to higher-level consumption projects when they consume.
2) The wealth effect of non-convertibility. When house prices rise, households with housing will increase their consumption projects even if they do not realize this value by selling, renting or refinancing. However, Poter (2000) pointed out that most households own housing in order to enjoy the service value provided by housing for a long time. As a whole, the effect of non-convertibility on wealth is weaker than that of convertibility on the change of household consumption structure.
3) Substitution effect. For rental households, if the house price rises so that they give up the idea of buying a house, they may use part of the income they intend to use to buy a house for consumption, thus increasing household con-sumption projects. This increase in concon-sumption caused by rising house prices to a desperate level is also called “desperate consumption effect”.
Through the above analysis, this paper makes the following hypothesis: house price rise promotes the upgrading of household consumption structure through the wealth effect of convertibility, the wealth effect of non-convertibility and substitution effect, and house price rise also restrains the upgrading of house-hold consumption structure through cost effect, saving effect and liquidity con-straint effect. Therefore, the impact of housing prices on household consump-tion structure needs further empirical verificaconsump-tion.
4. Data and Description of Major Variables
4.1. Data
DOI: 10.4236/me.2019.101011 162 Modern Economy 2012 and 2014 survey databases and China Statistical Yearbook. CFPS covered 25 provinces, municipalities and districts, including 95% of the country’s popu-lation. CFPS contains rich information about family consumption, family in-come, housing, age of family members, education and so on, which satisfies the data needs of this study. In the process of data processing, this paper first identi-fies the maximum years of education for adults in the family adult database, re-gards the maximum years of education as the educational level of the family and generates variables, calculates the child-to-child dependency ratio and the elder-ly dependency ratio in the famielder-ly relational database, and then matches the edu-cation level with the population dependency ratio with the family relational da-tabase, and will be from the country. The house price information collected by the Home Statistics Bureau matches the area in the family relationship database. Because the research object of this paper is urban residents, we delete the rural samples in the database and delete the missing values of the main variables. Af-ter processing the data of CFPS 2012 and CFPS 2014, we merge the two data into panel data and finally get 5241 representative samples in the whole country.
Ta-ble 1 gives descriptive statistics of relevant data. From Table 1, we can see that
the average proportion of family development-oriented enjoyable consumption in the sample period is 30.4%, the range of change is 0 - 1, the logarithmic mean value of the core explanatory variable is 8.607, and other control variables such as education level, dependency ratio, family size have changed greatly, which meets the random requirements of variables.
4.2. Description of Major Variables
4.2.1. Upgrading of Consumption Structure [image:7.595.210.538.543.734.2]There are two main ways to measure the upgrading of consumption structure: one is Engel’s coefficient method, which refers to the proportion of food con-sumption expenditure in total concon-sumption expenditure. The theoretical basis of this method is Engel’s law. Engel’s Law means that when family income is rela-tively low, most of the expenditure is used for food consumption, but for health
Table 1. Descriptive statistics of relevant data.
Variable Variable name Obs Mean Std. Dev. Min Max
con struc Developmental Enjoyable Consumption Proportion 9303 0.304 0.186 0 1
lnHp Logarithmic house prices 10,482 8.607 0.473 8.100 9.745 max edu Family education level 10,410 10.63 4.265 0 22 youngratio Child dependency ratio 10,482 0.117 0.153 0 1
oldratio old-age dependency ratio 10,482 0.170 0.300 0 1
lnFincome ~r Logarithmic household net income per capita 10,013 9.273 1.171 0.191 15.04
lnPce Consumption Expenditure Logarithmic Total 9303 10.44 0.851 6.141 14.24
DOI: 10.4236/me.2019.101011 163 Modern Economy care, transportation, communication and entertainment education. The expend-iture of development-oriented enjoyment type is less. The second is to measure the upgrading of consumption structure by increasing the proportion of expend-iture on health care, culture, education, entertainment and transportation and communication. This is because with the increase of residents’ income and con-sumption level, residents will spend more of their income on the develop-ment-oriented and enjoyable consumption of transportation, communication, medical care and entertainment education, while meeting the basic needs of clothing, food, housing and transportation. The latter is also the overwhelming majority of cultural consumption. This paper will also draw lessons from the practice of most literatures, and take the increase of the proportion of expendi-ture on health care, culexpendi-ture, education and entertainment, transportation and communication, and other goods and services in total consumption expenditure as a measure of the upgrading of consumption structure. That is, consumption structure = (health care + cultural, educational, entertainment + transportation and communication)/total consumption expenditure, named con_struc.
4.2.2. Changes in House Prices
The empirical data of this paper comes from the data of China Family Tracking Survey (CFPS 2014, CFPS 2012). Because the area of the family in this data can only be precise to the provincial level, the house price in this paper refers to the level of the house price of the family in the provincial level, and takes logarithms. The house price data of each province in 2012 and 2014 come from the average sale price of the house in China Statistical Yearbook. The CPI data are derived from China Statistical Yearbook. In addition, the CPFS survey data provide the variables of “the total market price of the existing residential house” and “the building area of your existing residential house”. According to these two va-riables, we can estimate the house price level faced by the family. After conver-sion with CPI, we can get the real house price level corresponding to the family, because families with higher consumption level tend to have higher income, while families with higher income tend to buy more expensive houses, therefore, using estimated house prices to study the impact of house prices on household consumption structure may have endogenous problems. Therefore, in our em-pirical analysis, we still use the real housing prices at the provincial level, because the choice of household consumption items can not be considered to affect the prices of the provinces, thus avoiding endogenous problems.
5. Model Setting and Empirical Analysis
5.1. Model Setting
This article builds the following basic models
0 1 2
Con_strucipt=β +β lnhppt+β Xipt+µp+εipt (1)
DOI: 10.4236/me.2019.101011 164 Modern Economy the province in which the household is located, Xipt represents the control va-riables of household level such as per capita household net income, household population, household education level, household dependency ratio and house-hold head characteristics, etc., μp represents the fixed effect of the province, and εipt is a random perturbation item. Here, housing price is an exogenous envi-ronmental variable at the provincial level. After controlling the fixed effect of provinces and years, we can actually use the differences of housing price growth and consumption structure changes in different provinces to identify the impact of housing prices on household consumption structure. After controlling the observable variables such as net income per capita household, family population, family education level, family dependency ratio and household head characteris-tics, the random perturbation term may also contain unobservable variables such as household consumption category preference, but as long as these factors are not related to the housing prices in the provinces where the households are located, we can estimate the relationship between housing prices and household consumption structure in a consistent and unbiased manner.
Regarding the control variable X: Combining with the existing research lite-rature and survey data, the control variables included in this paper are: family education level, education will affect people’s consumption concept and con-sumption mode, and then affect concon-sumption level and concon-sumption structure. This paper takes the highest education level of family adults as the family educa-tion level, and the expected regression coefficient is positive. Family dependency ratio, for families with elderly people, their expenditure on health care will be relatively large, and for families with children, their expenditure on food ex-penditure will be relatively large; per capita net income of families, according to the law of diminishing marginal propensity to consume, per capita net income of families is negatively correlated with consumption rate, and the average per capita income level of families is higher. The proportion of consumption penditure will be correspondingly lower; the more the total consumption ex-penditure of the family, the more the total consumption exex-penditure of the fam-ily, the more the expenditure in the category of enjoyable and developmental consumption will be, and the expected coefficient will be positive; the larger the family population size, the larger the family population size, the larger the sumption expenditure will usually be, and the impact on the upgrading of con-sumption structure needs to be further verified.
5.2. Empirical Analysis
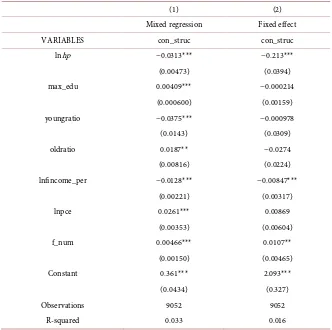
Table 2 gives the basic regression results of model (1). Column (1) is a mixed
DOI: 10.4236/me.2019.101011 165 Modern Economy
Table 2. Basic regression.
(1) (2)
Mixed regression Fixed effect
VARIABLES con_struc con_struc
lnhp −0.0313*** −0.213***
(0.00473) (0.0394)
max_edu 0.00409*** −0.000214
(0.000600) (0.00159)
youngratio −0.0375*** −0.000978
(0.0143) (0.0309)
oldratio 0.0187** −0.0274
(0.00816) (0.0224)
lnfincome_per −0.0128*** −0.00847***
(0.00221) (0.00317)
lnpce 0.0261*** 0.00869
(0.00353) (0.00604)
f_num 0.00466*** 0.0107**
(0.00150) (0.00465)
Constant 0.361*** 2.093***
(0.0434) (0.327)
Observations 9052 9052
R-squared 0.033 0.016
price is—0.213, which is also very significant. The results show that the rise of house prices has a significant negative impact on family development and en-joyable consumption structure, that is, the rise of house prices will inhibit the upgrading of consumption structure. The empirical results also show that household income, consumption expenditure and household population are also important factors affecting household consumption structure. The regression coefficient of household per capita net income is significantly negative, which accords with the law of diminishing marginal propensity to consume. The re-gression coefficient of total household consumption expenditure is significantly positive. The more total household consumption expenditure, the more devel-opment and enjoyment consumption. The coefficient of household population size is significantly positive. Usually, the larger the household population, on the one hand, the share of subsistence consumption expenditure, such as food, clothing, housing and transportation, will decrease; on the other hand, the larger the population, the greater the diversity, the greater the potential demand for development and enjoyment consumption.
5.3. Cross-Sectional Data Analysis of the Impact of Housing Prices
on Household Consumption Structure
DOI: 10.4236/me.2019.101011 166 Modern Economy structure of urban households into the model, and to consider more compre-hensively and objectively the impact of housing price changes on the high-level consumption structure of urban households, we use the cross-sectional data of CFPS in 2014 to make an empirical analysis again. The econometric model is as follows.
0 1 2
Con_strucip=β +β lnhpp+β Xip+µp+εip (2)
Compared with the model (1), we mainly add the relevant characteristic va-riables of family financial respondents to the control vava-riables, and the hetero-geneous factors that may affect our research.
Using Stata 13.0 software, we first estimate the model (2) by distinguishing the households with housing from those with rental housing. The households with rental housing include low-rent housing, public rental housing and commercial housing on the market. The estimated results are shown in Table 3. Among them, the first column is the regression result of the housing family, the third column is the regression result of the rental family, and the fourth, fifth and sixth columns are the regression result of the subdivision of the rental family. From the regression result of the first column, for the household with a house, the rising house price will not crowd in the enjoyable development expenditure of the household, on the contrary, it will be beneficial to the upgrading of the household consumption structure. The regression coefficient of house price is not significant, but for rental families, the rise of house price will significantly inhibit the upgrading of household consumption structure. This may be because households with houses have less pressure on rent when facing the rise of house price than households with rental houses, while households with rental houses have to face not only the pressure of rent increase, but also the pressure of buy-ing houses, thus reducbuy-ing spendbuy-ing of High-level consume. In the sub-sample of rental households, we find that the rise of house prices has the greatest impact on the consumption structure of families renting commercial housing in the market, followed by public rental housing, and low-rent housing has the smallest impact.
DOI: 10.4236/me.2019.101011 167 Modern Economy
Table 3. Expanded regression (sub-sample regression).
(1) (2) (3) (4) (5) (6)
Family with
housing Family with housing Renting family Low rent housing Public Rental Housing Commercial housing VARIABLES con_struc con_struc con_struc con_struc con_struc con_struc
lnhp 0.00595 −0.00398 −0.193*** −0.133** −0.193*** −0.284*** (0.0209) (0.0219) (0.0172) (0.0508) (0.0322) (0.0236) max_edu 0.00230*** 0.00231*** −0.000557 0.000867 −0.00816* 0.00241 (0.000827) (0.000827) (0.00188) (0.00358) (0.00478) (0.00235) youngratio −0.0469** −0.0468** −0.0628 0.0303 −0.133 −0.0621
(0.0198) (0.0198) (0.0434) (0.0977) (0.134) (0.0539) oldratio 0.0220* 0.0224* 0.0195 0.000459 0.00929 0.0546
(0.0129) (0.0129) (0.0453) (0.117) (0.0707) (0.0738) lnfincome_per −0.0130*** −0.0130*** −0.0100 −0.0183 −0.00710 −0.00786 (0.00307) (0.00307) (0.00744) (0.0140) (0.0184) (0.00903) lnpce 0.0181*** 0.0181*** 0.0339*** 0.0109 0.0603** 0.0243
(0.00468) (0.00473) (0.0127) (0.0274) (0.0300) (0.0162) f_num 0.00933*** 0.00924*** 0.0111* 0.0192 0.0197 0.00573 (0.00200) (0.00201) (0.00585) (0.0131) (0.0137) (0.00754) age 0.000131 0.000145 −0.00418 −0.00383 −0.00677 0.000428 (0.00108) (0.00108) (0.00322) (0.00607) (0.00625) (0.00485) lnAge −0.00315 −0.00285 0.104* 0.0594 0.133 0.0410
(0.0232) (0.0233) (0.0594) (0.118) (0.108) (0.0892) sex −0.0122** −0.0126** −0.0187 −0.0120 −0.0209 −0.0266 (0.00532) (0.00531) (0.0132) (0.0275) (0.0372) (0.0171)
morehouse −0.297**
(0.120) morehouse ×
lnhp 0.0342**
(0.0137)
Constant 0.146 0.227 1.262*** 1.220 0.903 2.525*** (0.224) (0.230) (0.308) (0.807) (0.686) (0.534)
Observations 4485 4485 558 123 135 300
R-squared 0.042 0.043 0.138 0.359 0.227 0.232
Note: 1) * means P < 0.1; ** means P < 0.05; *** means P < 0.01; 2) standard errors in parentheses; 3) all re-gional effects have been controlled.
DOI: 10.4236/me.2019.101011 168 Modern Economy regression coefficient of the interaction between housing prices and multiple housing units is significantly positive, that is to say, the households with mul-tiple housing units will significantly increase the proportion of develop-ment-oriented enjoyable consumption expenditure when housing prices rise, which indicates that there is a significant “convertible wealth” effect in the households with multiple housing units when housing prices rise in China.
The change of housing status, especially the change of family from renting to housing, is often the result of family self-selection. In the regression results of
Table 3, the self-selection of family housing status is not taken into account.
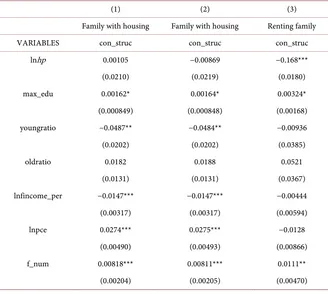
[image:13.595.210.538.433.727.2]Es-pecially for rental households, the housing status may change in 2014. If families with higher income or higher proportion of developmental consumption choose to buy a house in 2013-2014, the foregoing estimates may have sample selection bias. Fortunately, the CFPS data counts the time spent on home purchases, which helps us to identify changes in household housing status. We excluded the households that purchased the first house in CFPS in 2014 from the households with houses in 2013-2014 and classified them as rental households, thus reduc-ing the number of households with houses by 219 and increasreduc-ing the number of households with houses by 219. Then, the adjusted data are used to re-estimate, and the regression results are shown in Table 4. The results in Table 4 are basi-cally similar to those in Table 3. However, the restraining effect of rising house prices on the upgrading of the consumption structure of rental households is weakened, and the basic conclusion remains unchanged.
Table 4. Expanded regression (considering sample selection).
(1) (2) (3)
Family with housing Family with housing Renting family
VARIABLES con_struc con_struc con_struc
lnhp 0.00105 −0.00869 −0.168***
(0.0210) (0.0219) (0.0180)
max_edu 0.00162* 0.00164* 0.00324*
(0.000849) (0.000848) (0.00168)
youngratio −0.0487** −0.0484** −0.00936
(0.0202) (0.0202) (0.0385)
oldratio 0.0182 0.0188 0.0521
(0.0131) (0.0131) (0.0367)
lnfincome_per −0.0147*** −0.0147*** −0.00444
(0.00317) (0.00317) (0.00594)
lnpce 0.0274*** 0.0275*** −0.0128
(0.00490) (0.00493) (0.00866)
f_num 0.00818*** 0.00811*** 0.0111**
DOI: 10.4236/me.2019.101011 169 Modern Economy Continued
age 0.000420 0.000421 −0.00654**
(0.00109) (0.00110) (0.00257)
lnAge −0.00965 −0.00905 0.144***
(0.0236) (0.0237) (0.0498)
sex −0.0116** −0.0119** −0.0199*
(0.00541) (0.00541) (0.0116)
morehouse −0.283**
(0.122)
morehouse × hp 0.0325**
(0.0139)
Constant 0.151 0.228 1.236***
(0.226) (0.232) (0.272)
Observations 4304 4304 739
R-squared 0.046 0.047 0.105
Note: 1) * means P < 0.1; ** means P < 0.05; *** means P < 0.01; 2) standard errors in parentheses; 3) all re-gional effects have been controlled.
So far, our empirical results show that rising house prices will restrain the up-grading of household consumption structure, but rising house prices mainly af-fect the upgrading of household consumption structure of rental families, which is not significant for households with housing, but there is a greater “wealth ef-fect” in the face of rising house prices for households with multiple housing units, which will make households turn to higher levels of consumption.
6. Robustness Test
6.1. Heterogeneity of Family Income
DOI: 10.4236/me.2019.101011 170 Modern Economy
Table 5. Heterogeneity of family income.
(1) (2) (3)
Family samples below
median Sample of middle-income households Family samples above median
VARIABLES con_struc con_struc con_struc
lnhp 0.151 −0.212*** −0.250***
(0.190) (0.0753) (0.0728)
max_edu 0.000661 0.000780 0.00346
(0.00595) (0.00296) (0.00383)
youngratio 0.111 0.0162 −0.0114
(0.167) (0.0504) (0.0656)
oldratio −0.188** 0.0217 −0.0104
(0.0802) (0.0455) (0.0354)
lnfincome_per 0.0122 −0.0156 −0.0134
(0.0136) (0.0144) (0.0111)
lnpce 0.0529** −0.0111 −0.0168
(0.0268) (0.0117) (0.0113)
f_num −0.00216 0.00999 0.00659
(0.0228) (0.00900) (0.0105)
Constant −1.540 2.316*** 2.746***
(1.614) (0.627) (0.611)
Observations 1413 4119 3520
R-squared 0.054 0.015 0.027
Note: 1) * means P < 0.1; ** means P < 0.05; *** means P < 0.01; 2) standard errors in parentheses; 3) all re-gional effects have been controlled.
effect of rising house prices on the upgrading of household consumption struc-ture, but for middle and high-income families, house prices are significantly ne-gatively correlated with the upgrading of household consumption structure. The reason for this difference may be that, for low-income families, when house prices rise, they will abandon the purchase plan and use this part of the income to purchase for consumption, that is, low-income families have greater substitu-tion effect in the face of rising house prices.
6.2. Quantile Regression
DOI: 10.4236/me.2019.101011 171 Modern Economy
Table 6. Quantile regression.
(1) (2) (3) (4) (5) (6) (7) (8) (9)
0.1 0.2 0.3 0.4 0.5 0.6 0.7 0.8 0.9
VARIABLES con_struc con_struc con_struc con_struc con_struc con_struc con_struc con_struc con_struc
lnhp 0.000812 −0.00752* −0.0150*** −0.0202*** −0.0313*** −0.0405*** −0.0485*** −0.0507*** −0.0683***
(0.00356) (0.00428) (0.00478) (0.00510) (0.00567) (0.00664) (0.00733) (0.00774) (0.00962)
max_edu 0.00394*** 0.00503*** 0.00525*** 0.00597*** 0.00548*** 0.00499*** 0.00496*** 0.00282*** 0.00160
(0.000434) (0.000522) (0.000583) (0.000622) (0.000692) (0.000810) (0.000894) (0.000944) (0.00117)
youngratio 0.0445*** 0.0576*** 0.0417*** 0.0340** −0.0176 −0.0341 −0.0761*** −0.110*** −0.181***
(0.0115) (0.0139) (0.0155) (0.0165) (0.0184) (0.0215) (0.0237) (0.0251) (0.0311)
oldratio −0.0111* −0.00332 0.00356 0.00807 0.0128 0.0179* 0.0223* 0.0419*** 0.0545***
(0.00574) (0.00691) (0.00773) (0.00823) (0.00916) (0.0107) (0.0118) (0.0125) (0.0155)
lnfincome_per −0.00129 −0.000764 −0.000162 −0.00369 −0.00931*** −0.0132*** −0.0195*** −0.0261*** −0.0370***
(0.00158) (0.00190) (0.00212) (0.00226) (0.00252) (0.00295) (0.00326) (0.00344) (0.00427)
lnpce −0.00357 −0.00153 0.00321 0.0121*** 0.0285*** 0.0400*** 0.0458*** 0.0551*** 0.0696***
(0.00224) (0.00270) (0.00302) (0.00322) (0.00358) (0.00419) (0.00463) (0.00489) (0.00607)
f_num 0.00599*** 0.00773*** 0.00883*** 0.00785*** 0.00474** 0.00439** 0.00478** 0.00255 −0.000916
(0.00116) (0.00139) (0.00155) (0.00166) (0.00184) (0.00216) (0.00238) (0.00252) (0.00313)
Constant 0.0723** 0.142*** 0.188*** 0.210*** 0.255*** 0.309*** 0.438*** 0.525*** 0.765***
(0.0317) (0.0382) (0.0427) (0.0455) (0.0506) (0.0593) (0.0654) (0.0691) (0.0858)
Observations 9052 9052 9,052 9052 9052 9052 9052 9052 9052
Note: 1) * means P < 0.1; ** means P < 0.05; *** means P < 0.01; 2) standard errors in parentheses; 3) all regional effects have been controlled.
that in different consumption structure levels, the rise of house price has a nega-tive impact on the upgrading of household consumption structure of urban res-idents. The negative impact of the rise of house price above 0.2 quantile on the upgrading of household consumption structure is significant, and the lower the consumption structure level, the greater the negative impact of the rise of house price on the upgrading of household consumption structure. Therefore, quantile estimates show that rising house prices will inhibit the upgrading of household consumption structure of urban residents.
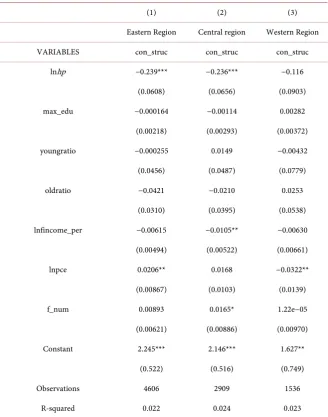
7. Model Expansion: Regional Differences
DOI: 10.4236/me.2019.101011 172 Modern Economy
Table 7. Extension of the model: regional differences.
(1) (2) (3)
Eastern Region Central region Western Region
VARIABLES con_struc con_struc con_struc
lnhp −0.239*** −0.236*** −0.116
(0.0608) (0.0656) (0.0903)
max_edu −0.000164 −0.00114 0.00282
(0.00218) (0.00293) (0.00372)
youngratio −0.000255 0.0149 −0.00432
(0.0456) (0.0487) (0.0779)
oldratio −0.0421 −0.0210 0.0253
(0.0310) (0.0395) (0.0538)
lnfincome_per −0.00615 −0.0105** −0.00630
(0.00494) (0.00522) (0.00661)
lnpce 0.0206** 0.0168 −0.0322**
(0.00867) (0.0103) (0.0139)
f_num 0.00893 0.0165* 1.22e−05
(0.00621) (0.00886) (0.00970)
Constant 2.245*** 2.146*** 1.627**
(0.522) (0.516) (0.749)
Observations 4606 2909 1536
R-squared 0.022 0.024 0.023
Note: 1) * means P < 0.1; ** means P < 0.05; *** means P < 0.01; 2) standard errors in parentheses; 3) all re-gional effects have been controlled.
8. Conclusions and Enlightenment
DOI: 10.4236/me.2019.101011 173 Modern Economy structure. The main reason is that households with multiple housing units will have larger wealth effect when the house price rises. Thirdly, further investiga-tion shows that, in terms of regional differences, the negative effect of rising house prices on consumption structure is more obvious in the eastern and cen-tral regions.
Under the background of the rising house prices and the slow upgrading of household consumption structure of urban residents in China, combined with the conclusions of this study, we can draw the following enlightenments: 1) starting from the supply-side structural reform2, we should increase the supply of land area and control the irrational rise of house prices in order to prevent the negative impact of excessive rising house prices on the upgrading of consump-tion structure; 2) the government should focus on improving the housing secu-rity policy to alleviate the pressure of rental families in the face of rising house prices, enhance their sense of well-being, and thus improve the consumption structure of these families; 3) improve the financial system reform, develop con-sumer credit products, promote consumption upgrading, and shift to the eco-nomic development mode driven by domestic demand. In addition, this paper also has some shortcomings: 1) The price used in this paper is the housing price of the province where the residents live, not the data of the city where the resi-dents live. 2) Because we use micro data, there are many factors affecting a household’s consumption decision-making. There are some important factors, but we have not found a good measure, such as consumption preference, neigh-borhood comparison and so on.
Conflicts of Interest
The author declares no conflicts of interest regarding the publication of this pa-per.
References
[1] Xie, J.Y., Wu, B.Z., Li, H.B. and Zheng, S.Q. (2012) Urban Housing Prices and Res-ident Consumption in China. Financial Research, No. 6, 13-27.
[2] Li, C.D. and Huang, Y.Y. (2015) Rising House Prices, Multi-Apartment Deci-sion-Making and Savings Rate of Urban Residents in China. Economic Research, 50, 100-113.
[3] Du, L. and Luo, J.L. (2017) How Does Rising House Prices Affect the Consumption Propensity of Urban Residents in China: A Study Based on Two-Stage Family Op-timal Consumption Model. Finance and Trade Economy, 38, 67-82.
[4] Zhao, X.L., Liang, W.Q., Li, S. (2014) Can Rising House Prices Explain the High Savings Rate of Urban Residents in China?—Empirical Analysis Based on CHIP Micro-Data. Economics (Quarterly), 13, 81-102.
DOI: 10.4236/me.2019.101011 174 Modern Economy gate Implications and Tests. American Economic Review, 53, 55-84.
[6] Gan, J. (2010) Housing Wealth and Consumption Growth: Evidence from a Large Panel of Households. The Review of Financial Studies, 23, 2229-2267.
https://doi.org/10.1093/rfs/hhp127
[7] Benjamin, J.D., Chinloy, P. and Jud, G.D. (2004) Real Estate versus Financial Wealth in Consumption. The Journal of Real Estate Finance and Economics, 29, 341-354.https://doi.org/10.1023/B:REAL.0000036677.42950.98
[8] Lusting, H.N. and Nieuwerburgh, S.G. (2005) Housing Collateral, Consumption Insurance, and Risk Premia: An Empirical Perspective. The Journal of Finance, 60, 1167-1219. https://doi.org/10.1111/j.1540-6261.2005.00759.x
[9] Munnell, A.H. and Soto, M. (2008) The Housing Bubble and Retirement Security. CRR Working Paper No. 2008-13. https://doi.org/10.2139/ssrn.1360878
[10] Chen, J., Chen, J. and Gao, B. (2012) Research on Credit Constraints, Housing Prices and Resident Consumption Rate u Based on Panel Threshold Model. Finan-cial Research, No. 4, 45-57.
[11] Campbell, J.Y. and Cocco, J.F. (2007) How Do House Price Affect Consumption? Evidence from Micro Data. Journal of Monetary Economics, 54, 591-621.
https://doi.org/10.1016/j.jmoneco.2005.10.016
[12] Skinner, J. (1996) Is Housing Wealth and Aggregate Saving. Regional Science and Urban Economics, 19, 305-324. https://doi.org/10.1016/0166-0462(89)90008-2
[13] Lehnert, A. (2004) Housing, Consumption, and Credit Constraints. FEDS Working Paper, No. 2004-63.https://doi.org/10.2139/ssrn.633261
[14] Hoynes, H. and McFadden, D. (1994) The Impact on Demographics on Housing and Non-Housing Wealth in the United States. NBER Working Paper 4666.
https://doi.org/10.3386/w4666
[15] Sheiner, L. (1995) Housing Prices and the Savings of Renters. Journal of Urban Economics, 38, 94-125.
[16] Chen, Y.B. and Qiu, Z.S. (2011) How High House Prices Affect Residents’ Savings Rate and Property Inequality. Economic Research, 46, 25-38.
[17] Yoshikawa, H. and Ohtaka, F. (1989) An Analysis of Female Labor Supply, Housing Demand and the Saving Rate in Japan. European Economic Review, 33, 997-1023.
https://doi.org/10.1016/0014-2921(89)90010-X