ISSN Print: 2327-5219
DOI: 10.4236/jcc.2018.611010 Nov. 19, 2018 108 Journal of Computer and Communications
A Matlab/Simulink Development and
Verification Platform for a Frequency
Estimation System
Yingtai Li
1*, Lisheng Yang
1, Xin Lei
2, Rui Ma
1, Luncai Liu
2, Fan Liu
2, Yao Yao
21College of Communication Engineering, Chongqing University, Chongqing, China 2Analog IC Design Center, Sichuan Institute of Solid-State Circuits, Chongqing, China
Abstract
The precise estimation of the frequency of the signal is of great significance in the Radar system, the electronic warfare system and many other systems. In this paper, we propose a development and verification platform for the fre-quency estimation system in the Matlab and Simulink environment. Its open-extensibility architecture enables the performance evaluation of differ-ent frequency estimation algorithms and its graphic interface can greatly promote the system design, simulation and verification efficiency.
Keywords
Frequency Estimation, Matlab and Simulink, Algorithm, Verification Platform
1. Introduction
The precise frequency estimation of one or more sinusoids contaminated with noise appears in many practical applications such as communications, instru-mentation, radar and audio. During the past few years a lot of efforts have been exerted to solve the problem and quite a number of frequency estimation algo-rithms have been published [1] [2]. Most of them are based on the Discrete Fourier Transform (DFT) or the Fast Fourier Transform (FFT). One key para-meter of these algorithms is the amount of time needed to collect data which is usually limited by the pulse width of the signal in the commonly used pulse sig-nal systems such as the pulse radar because it decides the calculation precision of the FFT. Some computationally simple algorithms are proposed to refine the frequency estimation based on DFT samples without the need for increasing the
How to cite this paper: Li, Y.T., Yang, L.S., Lei, X., Ma, R., Liu, L.C., Liu, F. and Yao, Y. (2018) A Matlab/Simulink Devel-opment and Verification Platform for a Frequency Estimation System. Journal of Computer and Communications, 6, 108-115. https://doi.org/10.4236/jcc.2018.611010
DOI: 10.4236/jcc.2018.611010 109 Journal of Computer and Communications data collecting time [3] [4] [5] [6].
However, the performance evaluation of the frequency estimators is another issue. Eric Jacobsen jointly simulated Quinn’s first [3] and second [4] estimators, Macleod’s estimator [5], and the estimator proposed by himself [6] using Matlab code [7], which revealed their theoretical performance difference. But none of the application and development platform for frequency estimation system is found.
In this paper, we apply the frequency estimation algorithms mentioned in [3] [4] [5] [6] to a specific frequency estimation system and build up the relevant Matlab/Simulink development and verification platform in order to evaluate the performances of these algorithms. Matlab and Simulink are commonly used in many fields. Compared with Matlab, Simulink’s friendly graphic interface pro-vides higher system modeling and simulation efficiency. Moreover, some extra functions provided by Matlab and Simulink, such as the automatic code genera-tion and the joint debugging with the hardware, significantly enhance the system implementation efficiency.
This platform in this paper consists of three parts: the signal generator, the analog to digital convertor (ADC) and the digital signal processing unit. We found that the frequency estimation accuracies of all the algorithms adopted in this paper can reach 5Hz even through the pulse width is too short to satisfy the requirement of the traditional FFT method. This platform is essential for the al-gorithm analysis, the digital circuit design and the system implementation.
2. The System Model
2.1. System Specification
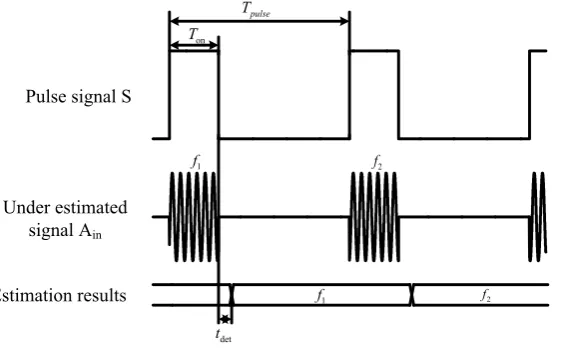
[image:2.595.238.520.535.711.2]The typical pulse modulation signal applied in the frequency estimation systems in this paper is illustrated in Figure 1. We focus on the intermediate frequency (IF) signal processing of this frequency estimation system, which means the ra-dio frequency (RF) signal received by the antenna has been down converted to an IF signal.
Figure 1. The signal structure.
1
f
1
f
2
f
2
f
det
t
pulse
T
on
T
Pulse signal S
Under estimated signal Ain
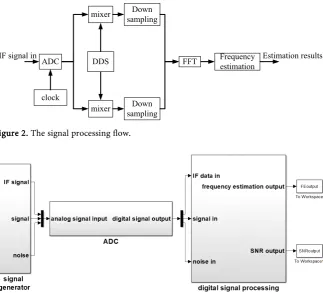
DOI: 10.4236/jcc.2018.611010 110 Journal of Computer and Communications The IF signal processing system is composed of the ADC and the digital signal processing circuit including the mixing circuit, the down sampling circuit, the Fast Fourier Transform (FFT) circuit and the digital frequency estimation cir-cuit. The signal processing flow is illustrated in Figure 2. A direct digital synthe-sizer (DDS) is adopted to generate the local cosine and sine wave for mixing the IF signal to a baseband signal. The down sampling circuits reduce the data rate and the subsequent computation complexity. The FFT circuit and the digital frequency estimation circuit are two core modules of the system and all the fre-quency estimation algorithms in [3] [4] [5] [6] are evaluated in this paper.
2.2. Modeling
The top view of the development and verification platform for the frequency es-timation system specified above is illustrated in Figure 3. Corresponding to Figure 2, it is mainly composed of three parts: the signal generator, the AD convertor and the digital signal processing block. The signal generator is the si-mulation stimulator of the whole system and generates the input IF signal. The ADC converters the analog IF signal to the digital signal. The digital signal processing block executes the signal preprocessing and the frequency estimation algorithms and finally achieves the signal frequency.
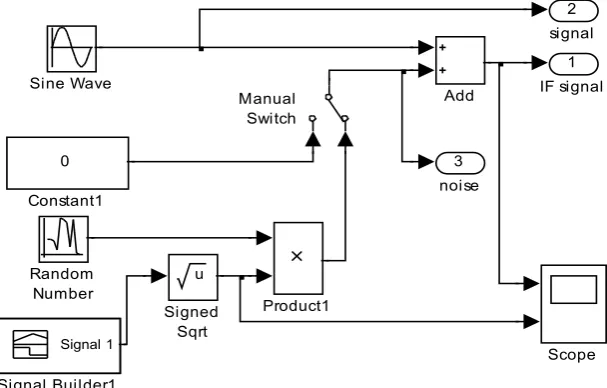
[image:3.595.213.537.413.706.2]The signal generator is illustrated in Figure 4. The sine wave block are used to generate the under estimated signal shown in Figure 1. The random number block is used to generate the noise. In order to evaluate the performance of the
Figure 2. The signal processing flow.
Figure 3. The top view of the Simulink model.
clock
ADC DDS FFT Frequency estimation mixer samplingDown
mixer IF signal in
Down sampling
DOI: 10.4236/jcc.2018.611010 111 Journal of Computer and Communications system, the frequency estimation under different SNR should be observed so that the signal builder block is adopted to control the noise power resulting in the control of SNR.
The analog to digital converter is illustrated in Figure 5. It is composed of a zero order hold block and a quantizer block. The zero order hold block is used to transform the analog signal to the discrete signal and the quantizer complete the transformation from the discrete signal to the digital signal. Even through this model just presents the ideal conversion process but not consider the non-ideal factor of an actual ADC, the effect of the quantized bit number can be investi-gated. However, in order to investigate the non-ideal effect of an actual ADC, a more detailed model of ADC is needed to replace this model.
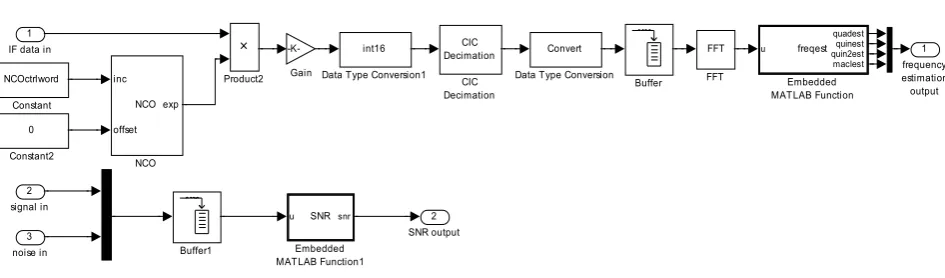
The digital signal processing (DSP) block is illustrated in Figure 6. Mainly it is composed of the digital frequency estimation system and the SNR calculation system.
In the digital frequency estimation system, firstly, we use a NCO block to mix the IF signal down to the baseband. Then a cascaded integrated comb (CIC) de-cimator is used to down sample the baseband signal to reduce the succedent computational complexity. A buffer block and a Fast Fourier Transform (FFT) calculation block are used to calculate the frequency spectrum of a certain data set during the Ton in Figure 1. The frequency estimation algorithms are
[image:4.595.222.526.428.622.2]imple-mented in the embedded matlab function block. Because of the conflict between the calculation resolution and the limited time (limited by the pulse width) used to collect the data, the FFT results are not precise enough for the system in this
Figure 4. The signal generator architecture.
Figure 5. The ADC model.
3 noise
2 signal
1 IF signal Sine Wave
u
Signed Sqrt Signal 1
Signal Builder1
Scope Random
Number
Product1 Manual
Switch
0
Constant1
Add
1 digital signal output Zero-Order
Hold Quantizer
1 analog
DOI: 10.4236/jcc.2018.611010 112 Journal of Computer and Communications
Figure 6. The DSP block.
paper. Quinn’s first and second estimators, Macleod's estimator and Jacobsen’s estimator are adopted to refine the frequency estimation of tones based on the FFT samples. All of them provide a fractional correction term to be added to the integer peak index from FFT to determine a fine estimate of the spectral peak location located at the cyclic frequency [7].
The SNR calculation part is independent of the digital frequency estimation system and calculates the SNR from the simulated signal and noise. The SNR has important reference to the performance evaluation of different frequency esti-mation algorithms. The SNR is calculated out from the following formulas:
( )
( )
2 1 2 1 10 10log N Nsignalpower s n
noisepower n n signalpower SNR noisepower = = =
∑
∑
where s n
( )
is the signal data sequence and n n( )
is the noise data sequence. N is the FFT length and it is decided by the depth of the buffer block.3. Simulation Results
In this paper, in the signal builder block the noise power is controlled by a time dependent variable whose time history plot is illustrated in Figure 7. Before 0.005 seconds, it slowly changes from 0.001 to 0.003 resulting nearly no noise so that the ideal performance of the frequency estimators can be observed. Then it increases with time to evaluate their performances under different SNRs. Ap-parently, its flexible configurability enables the modeling of other noise power curves.
The simulated IF signal and the corresponding SNR calculated are illustrated in Figure 8. Obviously, as the noise power increases with time the SNR decreas-es.
In this paper, the frequency estimation error is adopted to represent the performance of the estimators in [3] [4] [5] [6]. As mentioned above, the fre-quency of the input signal can be configured arbitrarily in the signal generator
2 SNR output 1 frequency estimation output Product2 NCO inc offset exp NCO -K-Gain FFT FFT
u SNR snr
Embedded MATLAB Function1 u quadest quinest quin2est maclest freqest Embedded MATLAB Function int16
Data Type Conversion1
Convert
Data Type Conversion
DOI: 10.4236/jcc.2018.611010 113 Journal of Computer and Communications
Figure 7. The time history plot of the signal builder.
Figure 8. The generated signal and SNR.
illustrated in Figure 4. The frequency estimation error of a certain estimator is obtained from the difference between the frequency estimated by that estimator and the configured frequency of the input signal.
The frequency errors obtained from the estimators in [3] [4] [5] [6] under different SNR are illustrated in Figure 9. Obviously, the frequency estimation accuracies of all the four estimators are better than 5 Hz smoothly when the SNR is above 5 dB. But as the SNR decreases, the estimation accuracies deteriorate and become worse than 20 Hz.
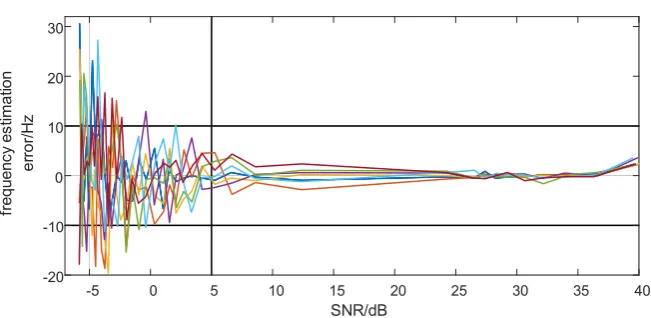
Remarkably, the results shown in Figure 9 are just from one simulation. More simulation times are needed to observe the variation tendency on account of the randomness of the noise. The results of 7 times simulation of the estimator in [3] are illustrated in Figure 10. Obviously, they show the same trend with Fig-ure 9.
0 0.004 0.008 0.012 0.016 0.02
-10 -5 0 5 10 15 20 25 30 35 40
signal
SNR
[image:6.595.210.537.318.498.2]DOI: 10.4236/jcc.2018.611010 114 Journal of Computer and Communications
Figure 9. The frequency error obtained under different SNR.
Figure 10. The frequency estimation results of 7 times.
4. Conclusion
In this paper, a Matlab/Simulink development and verification platform for the frequency estimation system is proposed. The performance of several frequency estimation algorithms based on short data is investigated and the simulation re-sults support their effectiveness. The flexible configuration and open extensibili-ty promote the system analysis efficiency significantly.
Conflicts of Interest
The authors declare no conflicts of interest regarding the publication of this pa-per.
References
[1] Akos, D. (1997) A Software Radio Approach to Global Navigation Satellite System Receiver Design. Ohio University Athens, OH.
[2] Borre, K. and Akos, D. (2006) A Software-Defined GPS and GALILEO Receiver—A Single-Frequency Approach. Birkhäuser, New York.
[3] Quinn. B.G. (1994) Estimating Frequency by Interpolation Using Fourier Coeffi-cients. IEEE Trans. Sig. Proc., 42, 1264-1268. https://doi.org/10.1109/78.295186
[4] Quinn, B.G. (1997) Estimation of Frequency, Amplitude and Phase from the DFT of
-5 0 5 10 15 20 25 30 35 40
SNR/dB
-20 -10 0 10 20 30
fre
qu
en
cy
es
tim
at
io
n
er
ro
r/H
z
[3] [4] [5] [6]
-5 0 5 10 15 20 25 30 35 40
SNR/dB
-20 -10 0 10 20 30
fre
qu
en
cy
es
tim
at
io
n
er
ro
r/H
[image:7.595.211.537.251.410.2]DOI: 10.4236/jcc.2018.611010 115 Journal of Computer and Communications
a Time Series. IEEE Trans. Sig. Proc., 45, 814-817.
https://doi.org/10.1109/78.558515
[5] Macleod, M.D. (1998) Fast Nearly ML Estimation of the Parameters of Real or Complex Single Tones or Resolved Multiple Tones. IEEE Trans. Sig. Proc., 46, 141-148. https://doi.org/10.1109/78.651200
[6] Jacobsen, E. and Kootsookos, P. (2007) Fast, Accurate Frequency Estimators. IEEE Signal Processing Magazine, 123-125. https://doi.org/10.1109/MSP.2007.361611
[7] Jacobsen, E. On Local Interpolation of DFT Out-Puts.