ISSN Print: 2152-7180
DOI: 10.4236/psych.2018.911144 Oct. 23, 2018 2503 Psychology
Applied Psychometrics: Writing-Up a Factor
Analysis Construct Validation Study with
Examples
Theodoros A. Kyriazos
Department of Psychology, Panteion University, Athens, Greece
Abstract
Factor analysis is carried out to psychometrically evaluate measurement in-struments with multiple items like questionnaires or ability tests. EFA and CFA are widely used in measurement applications for construct validation and scale refinement. One of the more critical aspects of any CFA or EFA is communicating results. This work described reporting essentials of EFA with goodness of fit indices and CFA research when they are used to validate a measurement instrument with continuous variables in a different population from the one originally created. An overview of the minimum information to be reported is included along with short extracts from real published reports. For each reported section basic information to be included is described along with an example-extract adapted from published factor analysis construct va-lidation studies. Additional issues covered include: Cross-vava-lidation, Measure-ment Invariance across Age and Gender, Reliability (α and ω), AVE-Based Va-lidity, Convergent and Discriminant Validity with Correlation Analysis and Normative Data. Properly reported EFA and CFA could contribute to the improvement of the quality of the measurement instruments. A summary of good practices in CFA and SEM reporting based on literature is also included.
Keywords
Write-Up, Factor Analysis, Latent Variable Models, EFA with Goodness of Fit Indices, Construct Validation across Cultures
1. General Overview & Study Purpose
Research articles in psychology follow a particular format as defined by the American Psychological Association (APA, 2001, 2010; APA Publications and Communications Board Working Group on Journal Article Reporting
Stan-How to cite this paper: Kyriazos, T. A. (2018). Applied Psychometrics: Writ-ing-Up a Factor Analysis Construct Valida-tion Study with Examples. Psychology, 9, 2503-2530.
https://doi.org/10.4236/psych.2018.911144 Received: August 13, 2018
Accepted: October 16, 2018 Published: October 23, 2018 Copyright © 2018 by author and Scientific Research Publishing Inc. This work is licensed under the Creative Commons Attribution International License (CC BY 4.0).
DOI: 10.4236/psych.2018.911144 2504 Psychology dards, 2018; Levitt et al., 2018; Appelbaum et al., 2018). The articles concerning factor analysis are special category articles that also follow specific guidelines (Beaujean, 2014). Additionally, specific sources elaborating on APA style (Beins, 2012; Phelan, 2007; McBride & Wagman, 1997; Smith, 2006) have not included guidelines on reporting Exploratory and Confirmatory Factor Analysis studies (EFA, CFA) or Structural Equation Modeling (SEM). “Structural equation mod-eling (SEM), also known as path analysis with latent variables, is now a regularly used method for representing dependency (arguably “causal”) relations in mul-tivariate data in the behavioral and social sciences” (McDonald & Ho, 2002: p. 64). CFA is a special case of SEM (MacCallum & Austin, 2000: p. 203). EFA when used with an estimator permitting goodness of fit indices (like ML, MLR c.f. Muthen & Muthen, 2012 or MLM, c.f. Bentler, 1995) to decide on the plausi-bility of a factor solution—could also be regarded as a special SEM case (Brown, 2015: p. 26), or at least can be up to a point treated as such. Regarding CFA, the measurement part of an SEM model is essentially a CFA model with one or more latent variables and observed variables representing the relationship pat-tern for those latent constructs (Schreiber, 2008: p. 91). EFA and CFA models are widely used in measurement applications for 1) construct validation and scale refinement, 2) multitrait-multimethod validation, and 3) measurement in-variance (MacCallum & Austin, 2000).
This work focuses on Exploratory (EFA) and Confirmatory Factor Analysis (CFA), that is the modeling of latent variables (Boomsma, Hoyle, & Panter, 2012) with continuous indicators (i.e. approximating interval-level data, Brown & Moore, 2012: p. 368).
Moreover, APA guidelines on CFA/SEM (2001, 2010) have been commented as too brief, containing only basic information to be included and only the im-portant issues to be addressed when conducting SEM studies (Schumacker & Lomax, 2016). Floyd and Widaman (1995) noted that many of the published factor analyses articles omit necessary information allowing readers to draw ac-curate conclusions about the models tested (also Boomsma, 2000; Schumacker & Lomax, 2016). For example, in EFA they tend to report only factor loadings that exceed a specific threshold, or in CFA, the initial proposed model and modifica-tions made to improve model fit should also be reported (Wang, Watts, Ander-son, & Little, 2013). Several guidelines can be found in literature on reporting SEM and CFA research (e.g. Steiger, 1988; Breckler, 1990; Raykov, Tomer, & Nesselroade, 1991; Hoyle & Panter, 1995; Boomsma, 2000; MacCallum & Austin, 2000; Schreiber, Nora, Stage, Barlow, & King, 2006; Schreiber, 2008).
The objective of this work is to describe reporting essentials of EFA with goodness of fit indices1 and CFA research when they are used to validate a mea-surement instrument with continuous indicators in a different population or cultural context from the one originally created, and they are completed in mul-tiple phases. This work is intended to build on more general standards on the reporting factor analysis and SEM in journal articles (see American
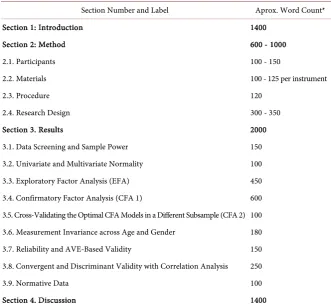
DOI: 10.4236/psych.2018.911144 2505 Psychology cal Association Publication and Communications Board Working Group on Journal Article Reporting Standards, 2018 and Kline, 2016). An overview of the minimum information to be reported is included here along with short extracts from published reports. See the sections proposed to be included on the report in Table 1. Table 1 contains the parts of a multi-phased construct validation method containing EFA with fit indices, CFA, cross-validation, measurement invariance, reliability analysis, convergent and discriminant analysis and norma-tive data. This sequence of steps is a complete procedure of construct validation of a measurement instrument called the 3-Faced Construct Validation Method (Kyriazos, 2018) for details about the method. It contains all basic steps of an EFA, CFA and measurement invariance thus it is used in this work as a blueprint to construct validation with factor analysis (see Kyriazos, 2018 for more details). The sequence of phases reported in a construct validation using factor analysis are contained in Table 1.
2. The Introduction Section Write-Up
[image:3.595.206.538.399.706.2]The Introduction is the first section of the main text of the report. The purpose of the Introduction is to: 1) define the study purpose, 2) relate the study with the previous research, and 3) justify the hypotheses tested (Smith, 2006). Authors
Table 1. Sections and approximate word allocation per section for a paper of 5000 - 6000 words.
Section Number and Label Aprox. Word Count* Section 1: Introduction 1400
Section 2: Method 600 - 1000 2.1. Participants 100 - 150
2.2. Materials 100 - 125 per instrument 2.3. Procedure 120
2.4. Research Design 300 - 350 Section 3. Results 2000 3.1. Data Screening and Sample Power 150 3.2. Univariate and Multivariate Normality 100 3.3. Exploratory Factor Analysis (EFA) 450 3.4. Confirmatory Factor Analysis (CFA 1) 600 3.5. Cross-Validating the Optimal CFA Models in a Different Subsample (CFA 2) 100 3.6. Measurement Invariance across Age and Gender 180 3.7. Reliability and AVE-Based Validity 150 3.8. Convergent and Discriminant Validity with Correlation Analysis 250 3.9. Normative Data 100 Section 4. Discussion 1400
DOI: 10.4236/psych.2018.911144 2506 Psychology usually arrange the Introduction so that general statements come first and more specific details pertaining to the presented research follow later (Beins, 2012).
Ideally, the introduction presents the theoretical underpinning of the path model(s) that will be specified (Hoyle & Panter, 1995; Boomsma, 2000; McDo-nald & Ho, 2002). When writing an introduction about a factor analysis of an instrument that you validate in a different population or cultural context from the one that was originally created the introduction section usually must contain the following: 1) a brief presentation of the construct behind the measure been validated in about two paragraphs, 2) review of instrument validation studies in different cultural contexts, 3) review of available translations of the instrument in different languages, 4) review of any special populations the instrument has been used, 5) reliability of the scale in other validation studies. Moreover, the goal of the introduction clarifies the research questions to be answered properly ordered and their importance for the nomological network (Campbell & Fiske 1959) of theoretical knowledge (Boomsma, 2000).
DOI: 10.4236/psych.2018.911144 2507 Psychology SES or age are usually reported, especially if pertinent to the results of the re-search that will follow.
What could happen if reviewing of relevant studies for the instrument is omitted? Possibly one might carry out a study that somebody has already pre-pared. And simple replication of an existing work is not equally respected by fellow researchers as original work (Beins, 2009: pp. 77-79). Another reason is to offer the reader a context for the validation at hand. A third reason is to fami-liarize with previous research and relevant limitations that you could be dis-cussed (Beins, 2012). Finally, to track models tested and their factorial method used and be included in your research.
The Introduction section in factor analysis construct validation studies closes usually with the study purpose outlined as follows:
“The purpose of this study is 1) To validate the BRS factor structure and
measurement invariance across gender and age using the 3-faced validation
method (Kyriazos, Stalikas, Prassa, & Yotsidi, 2018a, 2018b). 2) To model
the distinctiveness of BRS with EFA and CFA from depression and stress
evidencing construct validity further. 3) To examine internal consistency
reliability and 4) To evaluate Convergent and Discriminant validity”
(extract describing the purpose of the study adapted from Kyriazos, et al., 2018e: p. 1831).
Alternatively, research questions may be included (see also Finch, French, & Immekus, 2016) presented as follows:
“Three research questions emerge from the above goals:1) Can we identify
the underlying relationships between measured variables of TESC, Greek
version using Exploratory Factor Analysis?2) Can we confirm the structure
that emerged from Exploratory Factor Analysis with Confirmatory Factor
Analysis, evidencing construct validity?3) What is the internal consistency
reliability of TESC?”
(The above example is an extract adapted from Giotsa, Zergiotis, & Kyriazos, 2018: p. 1211 validating Teacher’s Evaluation of Student’s Conduct by Rohner, 2005).
However, as a rule, FA studies do not include research questions or hypothesis but only research purpose. See Table 2 for a list with all topics usually covered in the introduction section of an EFA or CFA study.
3. The Method Section Write-Up
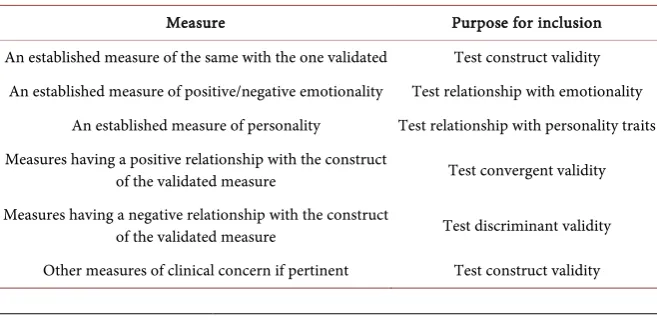
DOI: 10.4236/psych.2018.911144 2508 Psychology method, place of the study, basic sample description (marital status, education, job, income). It may also include any participants that interrupted their participa-tion in the study. 2) Materials: Description of the questionnaire (s) including items, Likert Scale (points and labels), Minimum and maximum scores, what higher and lower scores indicate, factors, the reliability of the original work. If this section includes only questionnaires—like in this instance—in some papers it can be featured as “Measures” (Aspelmeier, 2008). See the minimum set of measures usually included in construct validation of a scale with Factor Analysis in Table 3.
3) Procedure: Setting of the study comprising details about Inform consent, Ethics
Code, Place data collected, instructions given and by whom, translation method used (see Brislin, 1970; Brislin, Lonner, & Thorndike, 1973), if applicable.
[image:6.595.207.536.581.742.2]Finally, especially when the research includes multiple phases it is recom-mended (APA, 2010) to include a Research design section describing the phases of the research and the analyses carried out in each step of the process. This is essentially a research overview that many researchers provide background in-formation on statistical analyses that follow. This section is also called Analytic Strategy (APA, 2018). See Kyriazos, et al., 2018b: p. 1151 validating the Scale
Table 2. Outline of the topics covered in the Introduction section of an EFA or CFA study.
Purpose of the questionnaire Definition of the Construct Relationship with other constructs
Differentiation in demographics variables (Sex, age, marital status, SES) Previous EFA/CFA Research:
1. Cronbach Alpha coefficient (Cronbach, 1951), Omega coefficient (ω total; McDonald, 1999, Werts, Lim, & Joreskog, 1974) and Average Variance Extracted (AVE; Fornell & Larcker, 1981) 2. Factor Structure proposed by the author of the Questionnaire
3. Other Models proposed in Literature and their fit
4. If measurement invariance was established in any of the studies 5. Special populations the instrument was used in
6. Translations of the instrument in different languages that the original 7. Cultural Contexts the instrument was used in
Table 3. Minimum set of measures usually included in construct validation of a scale with Factor Analysis (described in the subsection Measures of the Method section).
Measure Purpose for inclusion An established measure of the same with the one validated Test construct validity
An established measure of positive/negative emotionality Test relationship with emotionality An established measure of personality Test relationship with personality traits Measures having a positive relationship with the construct
of the validated measure Test convergent validity Measures having a negative relationship with the construct
DOI: 10.4236/psych.2018.911144 2509 Psychology of Positive and Negative Experiences-SPANE—by Diener et al., 2010 and Kyria-zos, et al., 2018c: p. 1365 for two different approaches of this section.
An extract describing the research design of a construct validation using mul-tiples split samples is the following:
“The sample was split into three parts to study construct validity of MLQ in
different samples. More specifically, all analyses were carried out on two
le-vels:1) on three sub-samples (EFA, CFA1, and CFA2) to examine construct
validity and cross-validate it; 2) on the entire sample (Total sample), to
evaluate measurement invariance across gender, internal consistency
relia-bility and convergent/discriminant validity. In the first sample (EFA
Sam-ple), Exploratory Factor Analysis and Bifactor Exploratory Factor Analysis
were carried out. Independent Cluster Model Confirmatory Factor Analysis
(ICM-CFA), Bifactor Confirmatory Factor Analysis and Exploratory
Struc-tural Equation Modeling Analysis followed in the second sample (CFA1
Sample), testing seven alternative solutions. The third sample was used for
cross-validation of the optimal CFA model established from the second
sample (CFA2 Sample). Then, a multi-group CFA (MGCFA) was carried
out in the entire sample (N =1561) to test for the measurement invariance
of the MLQ across gender.”
(The above example is an extract adapted from Stalikas, Kyriazos, Yotsidi, Prassa (2018), pp. 353-354, validating the Meaning in Life Questionnaire by Steger et al., 2006).
Concerning the evaluation of reliability and validity if we calculate multiple coefficients and normative data we could alternatively conclude the section by the following:
“A reliability analysis (α and ω) followed in the entire sample. AVE
Con-vergent validity and ConCon-vergent/Discriminant validity based on correlation analysis were performed in the total sample using measures of mental dis-tress, well-being, positivity and quality of life. Next, a Bifactor CFA Subjec-tive Well-being Model was evaluated, using SPANE to measure affect.
Fi-nally, normative data were calculated over the entire sample”.
(The above example is an extract adapted from Kyriazos, et al., 2018b: p. 1151 validating the Scale of Positive and Negative Experiences-SPANE—by Diener et al., 2010)
Then the software used to carry out the factor analysis can be specified as follows:
“Data were analyzed using SPSS, Version 25 (IBM, 2017), Stata Version
14.2(StataCorp, 2015) and MPlus Version 7.0 (Muthen & Muthen, 2012)”.
(Example adapted from Kyriazos et al., 2018c: p. 1365).
4. The Results Section Write-Up
instru-DOI: 10.4236/psych.2018.911144 2510 Psychology ments with multiple items like questionnaires or ability tests (Brown, 2015; also quoting Floyd & Widaman, 1995). One of the more critical aspects of any CFA or EFA is communicating results (Loehlin & Beaujean, 2017). Generally, there is no typical way of writing the results of a factor analysis usable in any circums-tances i.e. the one size fits all approach (Howitt & Cramer, 2017). More specifi-cally, at the beginning of the results section the reported information follows a chronological order, thus first actions performed are presented first, and typi-cally that is the data screening and cleaning (c.f. Tabachnick & Fidell, 2013). The results comprise multiple subsections (see Table 1 for details of these sections and word allocation per section) described separately next. For each section ba-sic reported information is included along with an example-extract adapted from published factor analysis construct validation studies (using either EFA with goodness of fit indices or CFA).
4.1. Data Screening and Data Management
During data screening and preliminary analysis, the following issues are ad-dressed to prepare the data for further analysis (Tabachnick & Fidell, 2013: p. 674): 1) Outliers among cases, 2) Sample size and missing data, 3) Normality and linearity of variables, 4) Factorability of R, 5) Multicollinearity and singular-ity. How researchers choose to handle these issues it is suggested to be reported (Raykov, et al., 1991). Likewise, if there are overly-influential observations, a de-scription of the way they were handled is useful (Bollen 1989; Loehlin & Beau-jean, 2017).
Outliers could be reported as follows:
“Prior to the CFA analysis, the data were evaluated for univariate and
mul-tivariate outliers by examining leverage indices for each participant. An outlier was defined as a leverage score that was five times greater than the sample average leverage value. No univariate or multivariate outliers were
detected”
(Example proposed by Brown 2015: p. 137).
The amount of missing values is also of interest and if they are likely to be missing at random or not (McDonald & Ho, 2002). Likewise, it is usually sug-gested to report any missing values strategy and the reason for this course of ac-tion (Loehlin & Beaujean, 2017). However, one good way to avoid missing val-ues altogether in an electronic test battery is to set all battery fields as required (Kyriazos, 2018). This course of action could be reported as:
“The total sample included N =2272 cases. There were no missing values in
the data because all the digital test-battery fields were set as required (see
details in Procedure section)”.
(The above example is an extract adapted from Kyriazos et al., 2018d: p. 1796 validating the Flourishing Scale by Diener at al., 2010).
DOI: 10.4236/psych.2018.911144 2511 Psychology the percent of missing data and if they are missing randomly as follows:
“Missing values in all variables did not exceed 2%. Missing data analysis
followed to examine whether values were missing completely at random
(MCAR). Little’s MCAR test (Little, 1988) was not significant, Chi-Square
(14,972, N =1561)=15,128.87, p = .182, suggesting that values were miss-ing entirely at chance. Thus, missmiss-ing values in the dataset were estimated
with the Expectation-Maximization algorithm (EM)”.
(The above example is an extract adapted from Stalikas, Kyriazos, Yotsidi, Pras-sa, page 354, validating the Meaning in Life Questionnaire by Steger at al., 2006).
Next details on sample size and sample power calculations could be reported as follows:
“To examine the construct validity of BRS the total sample (N =2272) was
randomly split into three parts (20%, 40%, and 40%). EFA was carried out
in the first subsample (nEFA =452, 20%). CFA followed both in the second
subsample (nCFA1=910, 40%) and in the third (CFA 1 and CFA 2
respec-tively). The third subsample was of equal sample power to the second
(nCFA2 =910, 40%). CFA 2 was carried out to cross-validate the optimal
model established in CFA 1. The number of cases per BRS indicator for the
total sample, first subsample (EFA) and second and third subsamples (CFA
1 and CFA 2) was 378.67, 75.33 and 151.67 respectively”.
(The above example is an extract adapted from Kyriazos et al., 2018e: p. 1835 validating the Brief Resilience Scale by Smith et al., 2008).
4.2. The Normality Assumption
The multivariate normality assumption is mostly evaluated by Mardia’s (1970) multivariate skewness and kurtosis coefficients but additional tests could be used to reinforce results. Mardia’s (1970) test of multivariate skewness and kurtosis is widely available and should, therefore, be reported especially when using ML (McDonald & Ho, 2002). Additionally, when the multivariate normality as-sumption is true, univariate and bivariate normality is supposed to be true too (Wang & Wang, 2012: p. 59, also quoting Hayduk, 1987), but the inverse is not true. Univariate and multivariate normality of variables using multiple tests could then be reported (c.f. StataCorp,2015 for multivariate normality):
“The data in all four samples (Total, EFA, CFA1, and CFA2) violated the
normality assumption. Kolmogorov-Smirnov tests (Massey, 1951) on each
of the DASS-21 and DASS-9 items were statistically significant (p <.001),
indicating a univariate normality deviation. Multivariate normality was
es-timated by the following four tests: 1) Mardia’s multivariate kurtosis test
(Mardia, 1970);2) Mardia’s multivariate skewness test (Mardia, 1970);3)
Henze-Zirkler’s consistent test (Henze & Zirkler, 1990), and 4)
DOI: 10.4236/psych.2018.911144 2512 Psychology
was rejected for all four tests (with all p values < 0.0001), suggesting a
viola-tion of multivariate normality of the DASS-21 and DASS-9 scores in all four
samples (Total, EFA subsample, CFA1 subsample, CFA2 subsample)”.
(The above example is an extract adapted from Kyriazos et al., 2018a: p. 1103 validating the DASS-21 and DASS-9 by Lovibond & Lovibond, 1995 and by Yu-soff, 2013 respectively).Preliminary checks reported in classic EFA (beyond the scope of this work) evaluate multi-collinearity by reporting the value of the de-terminant. Additional preliminary tests reported include the Kaiser-Meyer-Olkin (KMO) Measure of Sampling Adequacy (Kaiser, 1970, 1974), and Bartlett’s test of sphericity (Bartlett, 1951, 1954).
4.3. Exploratory Factor Analysis (EFA)
When the EFA factor extraction method is a full information estimator (like ML, c.f. Lawley, 1940; MLR c.f. Muthen & Muthen, 2012 or MLM, c.f. Bentler, 1995) this allows for goodness-of-fit evaluation and statistical inference such as signi-ficance testing and confidence interval estimation (Grant & Fabrigar, 2007; Fa-brigar & Wegener, 2012; Brown, 2015). Therefore, it is helpful to consider EFA with goodness of fit indices as a special case of SEM, generating goodness-of-fit information for determining the appropriate number of factors, either along with or instead of the traditional eigenvalue-based approach. Various good-ness-of-fit statistics (such as chi-square and the root mean square error of ap-proximation/RMSEA; Steiger & Lind, 1980) are available. Therefore, EFA with goodness of fit indices is useful for alternative model comparison, specifying different numbers of factors and then comparing the fit of the alternative models (Brown, 2015: p. 26). The appropriate number of factors emerges by determin-ing the model in which one less factor signifies poorer fit one more factor does not drastically improve model fit (Grant & Fabrigar, 2007).
DOI: 10.4236/psych.2018.911144 2513 Psychology (Thompson, 2004): Kaiser-Guttman criterion (Kaiser, 1960), Scree test (Cattell, 1966), parallel analysis (Horn, 1965), and Velicer’s Minimum Average Partial Correlations test (a.k.a. Velicer’s MAP; Velicer, 1976). Newer options include also reporting: Revelle and Rocklin’s Very Simple Structure or VSS (1979), non-graphical alternatives of Scree Plot (Raiche, Walls, Magis, Riopel & Blais, 2013) or the Hull Method (HM, Lorenzo-Seva, Timmerman, & Kiers, 2011). The Pattern Matrix and the Structure Matrix coefficients should be presented in full either in one table or separately, along with the correlations emerged among the factors (Pallant, 2016). Moreover, an interpretation of all the factors in the final model is also included (Loehlin & Beaujean, 2017). Finally, in both EFA ap-proaches a table of factor loadings with all values it is also recommended. The focus of this paper is on the EFA approach with fit indices because the tradition-al EFA report is tradition-already extensively covered in EFA literature. For detailed in-formation on implementing and reporting EFA results without using fit indices refer to Tabachnick and Fidell (2013).
The EFA with fit indices reporting process (minimum requirements) of the validation of a measurement instrument in a different cultural context from the original is very similar to a CFA report without the path diagram. That is, factor loadings are reported instead and of course factorability of the data should be demonstrated. All factor loadings for the optimal model are usually reported in a table. Additionally, their range along with model fit and inter-factor correlation (if applicable) for all alternative models tested are usually presented in a table. First, the EFA (and Bifactor EFA if used) factor extraction and rotation method could be reported as:
“EFA was applied with the MLR estimator (c.f. Muthen & Muthen, 2012).
[…]. The factors were rotated with Geomin factor rotation in the standard
EFA model. Additionally, for the EFA Bifactor model, the technique
pro-posed by Jennrich and Bentler (2011) was applied”.
(The above example is an extract adapted from by Kyriazos, et al., 2018b: p. 1152 validating the Scale of Positive and Negative Experiences-SPANE—by Di-enet et al., 2010).
Then, goodness-of-fit measures used for factor selection and their suggested cutoffs could be described as:
“EFA model fit was evaluated by the standards proposed by Hu & Bentler
(1999) and Brown (2015): RMSEA (≤0.06, 90% CI ≤0.06), SRMR (≤0.08), CFI
(≥0.95), TLI (≥0.95), and the chi-square/df ratio less than 3 (Kline, 2016)”.
(The above example is an extract adapted from Kyriazos, et al., 2018b: p. 1152 validating the Scale of Positive and Negative Experiences-SPANE—by Dienet et al., 2010)
DOI: 10.4236/psych.2018.911144 2514 Psychology
“For SPANE-12, the following models were tested. MODEL 1a was
pro-posed by Diener et al. (2010) and contains only the 6 positive items of
SPANE-12(SPANE-P). Respectively, MODEL 1b contains only the 6
nega-tive items of SPANE-12(SPANE-N;Diener et al., 2010) to test the
assump-tion that Positive and Negative affect are independent measures of PA and
NA (Crawford & Henry, 2004). MODEL 2 is a bi-dimensional EFA model
with SPANE-P and SPANE-N in two separate factors (proposed by Singh et
al., 2017; attributed to Diener et al., 2010). Generally, this EFA model also
served as a benchmark for the subsequent Bifactor EFA model. MODEL 3,
is a Bifactor EFA model (Jennrich & Bentler, 2011). […] Additionally, this
Bifactor EFA model attempts to reproduce the hierarchical EFA structure
for affect proposed by Tellegen et al. (1999) with a General
Happi-ness/Sadness factor and PA and NA as specific factors”.
(The above example is an extract adapted from Kyriazos, et al., 2018b: p. 1153 validating the Scale of Positive and Negative Experiences-SPANE—by Dienet et al., 2010)
Reporting model fit of the models tested would follow:
“The fit for the models 1a and 1b was decent with all measures within
ac-ceptable or almost acac-ceptable bounds. For the 2-factor EFA model
(MODEL 2) and EFA Bifactor model (MODEL 3), fit measures (see
appro-priate Table) achieved the prerequisite limits, Chi-square = 135.82,
Chi-square/df =3.16, RMSE = 0.069, CFI = 0.952, and TLI = 0.926, SRMR =
0.033, factor loadings 0.358- 0.850, and factor correlation −0.724”.
(The above example is an extract adapted from Kyriazos, et al., 2018b: p. 1154 validating the Scale of Positive and Negative Experiences or SPANE by Dienet et al., 2010).
Note that a table with the fit measures is normally expected to be reported along with Chi-square, the degrees of freedom, and the probability of the chi-square test. APA permits the use of widely used acronyms. Since the publica-tion of the 5th edition of the APA Publication Manual, widely used fit indices such as the RMSEA require no definition in a table footnote (APA, 2001). Re-garding the use of tables or figures is generally recommended when they more clearly display results. The same data in both a table and a figure cannot be pre-sented (McBride & Wagman, 1997).
Then if CFA follows in a different dataset the then whole process is repeated (see also Table 4 for general suggestions).
4.4. Confirmatory Factor Analysis (CFA 1)
DOI: 10.4236/psych.2018.911144 2515 Psychology
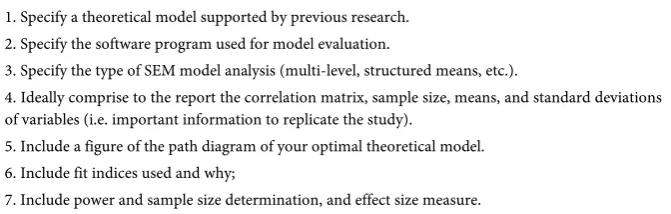
Table 4. Suggestions for reporting SEM research by Schumacker & Lomax (2016, p. 241).
1. Specify a theoretical model supported by previous research. 2. Specify the software program used for model evaluation.
3. Specify the type of SEM model analysis (multi-level, structured means, etc.).
4. Ideally comprise to the report the correlation matrix, sample size, means, and standard deviations of variables (i.e. important information to replicate the study).
5. Include a figure of the path diagram of your optimal theoretical model. 6. Include fit indices used and why;
7. Include power and sample size determination, and effect size measure.
Note. The power, sample size, and effect size will enable future meta-analysis studies, cross-cultural re-search, multi-sample or multi-group comparisons, results replication, and/or validation.
factor loadings per model and inter-factor correlation (when m > 1) and a path diagram with the factor loadings, error variances and factor intercorrelations of the optimal model are also included as a minimum information typically in-cluded (see, e.g. Bentler, 1990; Joreskog & Sorbom, 1992; Kelloway, 2015). Typi-cally, confidence intervals and significance tests for all estimates are also re-ported to assess the plausibility of the estimates (Porter & Fabrigar, 2007).
First, to report the model estimator, goodness-of-fit measures, and their cu-toffs:
“MLR was also used to estimate model parameters and goodness-of-fit of all
the CFA models was examined with: RMSEA ≤ 0.06(90% CI ≤ 0.06), SRMR
≤ 0.08, CFI ≥ 0.95, and TLI ≥ 0.95(Hu & Bentler, 1999;Brown, 2015).
Ad-ditionally, the chi-square/df ratio ≤3 rule was also used (Kline, 2016)”.
(The above example is an extract adapted from Kyriazos, et al., 2018e: p. 1837 validating the Brief Resilience Scale or BRS by Smith et al., 2008)
Next, model tested based on previous literature and relevant theory are gener-ally described:
“Based on previous literature and EFA that was carried out in the previous
phase, the following seven models were tested. MODEL 1 was the single
factor model originally proposed by Smith et al. (2008) and validated by
Amat et al. (2014) and de Holanda Coelho et al. (2016). MODEL 2 is a
vari-ation of MODEL 1 with error covariances added (items 3 - 4, 4 - 5 and 4 -
6). MODEL 3 was a two-factor model emerged in EFA with factor 1
con-taining the reversed items and factor 2 the non-reversed items. This model
also replicated the first order factor structure proposed by Rodriguez-Ray et
al. (2016) in a second-order model to account for the response bias effect
method (Alonso-Tapia & Villasana, 2014; Marsh, 1996; Wu, 2008; cited in
Rodríguez-Rey et al., 2016). MODEL 4 was a variation of Model 3 with the
Exploratory Structural Equation Model method (ESEM; Asparouhov &
Muthen, 2009). We did not test the higher order model proposed by
Rodríguez-Rey et al. (2016) because traditional higher-order CFA models
DOI: 10.4236/psych.2018.911144 2516 Psychology
(Wang & Wang, 2012). Instead, we tested a higher order CFA Bifactor
(Harman, 1976; Holzinger & Swineford, 1937) and ESEM Bifactor model
with two factors (MODEL 5 and 6 respectively) since Bifactor models do
not have this restriction (see Brown, 2015). MODEL 7 was a CFA Bifactor
model with the two-factor structure proposed by Chmitorz et al. (2018)”.
(The above example is an extract adapted from Kyriazos, et al. (2018e, pp. 1837-1838) validating the Brief Resilience Scale by Smith et al., 2008)
Finally, the fit of the models tested is reported:
“Regarding model fit, MODEL 1 showed an acceptable fit, except for the
RMSEA. MODEL 2 showed a remarkably improved fit after the addition of
error covariances to MODEL 1 with all measures within limits and with a
significant fit, factor loadings from 0.572 - 0.739. MODEL 3 achieved an
adequate fit with almost all measures within acceptability and RMSEA on
the verge of acceptability, factor loadings per factor from 0.626 - 0.685
(Factor 1) and 0.630 - 0.739(Factor 2), factor intercorrelation.828(see the
goodness-of-fit statistics for all models). MODELS 4 - 7 either failed to be
identified or to converge. Thus, two competing optimal models emerged, 1)
the single factor with error covariances (MODEL 2) and 2) the two factor
model with reversed and non-reversed items separated in 2 factors
(MODEL 3)”.
(The above example is an extract adapted from Kyriazos, et al. (2018e: p. 1838) validating the Brief Resilience Scale by Smith et al., 2008).
Generally, a table with the goodness-of-fit of models tested is always included along with the path diagram of the final CFA model tested. Typically, the path diagram contains the standardized path coefficients of the model (Schreiber, Nora, Stage, Barlow, & King, 2006; Schreiber, 2008), but there are also sugges-tions to optionally include a table with the unstandardized model coefficients too (Beaujean, 2014; Nicol & Pexman, 2010; Schreiber, 2008; Schreiber, Nora, Stage, Barlow, & King, 2006). Additionally, in an attempt to ensure a SEM re-search replicability (Schumacker & Lomax, 2016; Asendorpf et al., 2013) it is suggested as a good practice to include a matrix of the data used (McDonald & Ho, 2002; Raykov et al., 1991; MacCallum & Austin, 2000) or even the syntax used, if any (Beaujean, 2014; Loehlin & Beaujean, 2017).
4.5. Cross-Validating the Optimal CFA Models in a Different
Subsample (CFA 2)
Experts propose to cross-validate the CFA models tested in a different dataset to avoid overfitting promoting model replicability (Byrne et al., 1989, Byrne, 2012; Thompson, 1994; Thompson, 2013; Hill, Thompson, & Williams, 1997; Wang & Wang, 2012; Brown, 2015; Schumacker & Lomax, 2016; DeVellis, 2017; Kyria-zos, 2018).
DOI: 10.4236/psych.2018.911144 2517 Psychology
“In this phase of the 3-faced construct validation method, we cross-validated
the FS model that emerged from the CFA 1 subsample (40%, n =910) with
a second CFA in a new subsample of equal power (CFA 2, 40%, n =910).
The optimal FS structure that emerged from the CFA 1 subsample was the
single factor proposed by Diener et al. (2010) with error covariances added.
This model was successfully validated in the new subsample of equal power. All fit statistics were within acceptable limits achieving a good fit. Factor
loadings were also within adequate limits (0.482 - 0.642)”.
(The above example is an extract adapted from Kyriazos, et al., 2018d: pp. 1798-1799, validating the Flourishing Scale by Dienet et al., 2010).
The cross-validation is usually completed with a table with the model fit indices and a figure containing the path diagram of the model (minimum suggestions).
Review results of published SEM articles (MacCallum & Austin, 2000) sug-gested that researchers are susceptible to a confirmation bias, that is a predispo-sition favoring the model being evaluated as indicated by two symptoms of this bias: 1) a frequent excessively positive assessment of model fit; 2) a reluctance to search for alternative explanations of fit to the data (erroneous of judgments about models; Reichardt, 1992 as quoted by MacCallum & Austin, 2002). These effects, MacCallum and Austin (2000) continue could be potentially controlled by testing alternative models and by equivalent models. The theoretical value of the findings is enhanced when models that are (almost) equivalent to the one va-lidated is tested. Equivalent models fit the dataset (almost) as well as the original model under validation and potentially offer alternative theoretical interpreta-tions (Joreskog & Sorbom, 1988; Raykov et al., 1991). Thus, cross-validation could reinforce the support of a proposed model further protecting against con-firmation bias (MacCallum & Austin, 2000) and overfitting (Byrne et al., 1989). For more details on a method of cross-validation as an overfitting protection you can also refer to Kyriazos (2018).
4.6. Measurement Invariance across Age and/or Gender
DOI: 10.4236/psych.2018.911144 2518 Psychology Elements (a) to (c) could be described as:
“The invariance criteria used were ΔCFI ≤ −0.01, and ΔRMSEA ≤ 0.015
(Chen, 2007). For DASS-21 gender invariance of the 3-factor ICM CFA
model was tested separately in each gender group, as a baseline model
(males, N =832 versus females, N =1440). This model had a very good fit
for males (Chi-square 477.35, Chi-square/df =2.60, RMSEA = 0.044, CFI =
0.954) and sufficiently good for females (Chi-square 916.40, Chi-square/df
=5.00, RMSEA = 0.053, CFI = 0.941). Then, this baseline model was tested
in both gender groups concurrently”.
(The above example is an extract adapted from Kyriazos et al. (2018a: p. 1111) validating the DASS-21 and DASS-9 by Lovibond & Lovibond, 1995 and Yusoff, 2013 respectively).
While element (d) could be reported as:
“This model (M1) showed acceptable fit, suggesting that configural
inva-riance was supported. Then, factor loadings were constrained to equality.
As shown in the appropriate Table, both ΔCFI and ΔRMSEA for this
con-strained model (M2) indicated weak invariance. Then, all intercepts were
forced to be equal (M3), and both ΔCFI and ΔRMSEA showed strong
inva-riance. Finally, for the last test of measurement invariance (Wang & Wang,
2012), error variances were constrained to equality and ΔCFI and ΔRMSEA
suggested that strict measurement invariance is supported”.
(The above example is an extract adapted from Kyriazos et al. (2018a: p. 1111) validating the DASS-21 and DASS-9 by Lovibond & Lovibond, 1995 and Yusoff, 2013 respectively).
If strict subsequently measurement invariance across age is tested that is not fully supported, it could be reported as in the following extract:
“The process was repeated to evaluate invariance across age testing the
2-factor model separately in two age groups (18 - 32 years, 49% versus 33 -
69 years, 51%). The fit of this model was good for those aged from 18 - 32
years (Chi-square = 21.39, Chi-square/df = 2.67, CFI =.988, RMSEA =
0.039) and equally good for those aged from 33 - 69 years (Chi-square =
22.31, Chi-square/df =2.79, CFI = 0.989, RMSEA = 0.039). Next, the model
was evaluated in both age groups simultaneously. This model (M1) showed
good fit suggesting that configural invariance was supported. Then, factor
loadings (M2), indicator means (M3) and indicator residuals (M4) were
consecutively constrained to equality, evaluating weak, strong and strict
in-variance respectively. Model fit comparison between MODEL 2 to 1,
showed no statistically significant difference supporting weak invariance.
Model fit comparison between MODEL 3 to 2 and MODEL 4 to 3 indicated
that ΔCFI (but not ΔRMSEA) was beyond acceptability to support strong
invariance and strict invariance. This means that age comparisons in
DOI: 10.4236/psych.2018.911144 2519 Psychology (The above example is an extract adapted from Kyriazos, et al., 2018e: p. 1840 validating the Brief Resilience Scale by Smith et al., 2008).
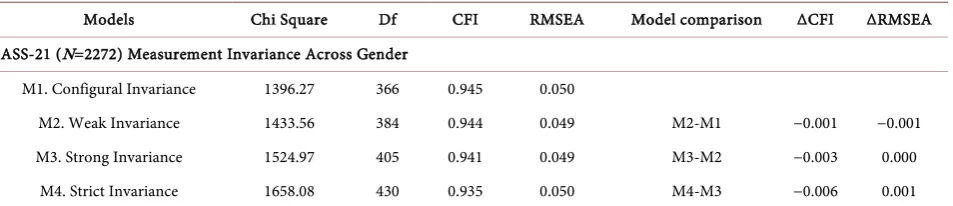
A table comparing the different models is mandatory when examining inva-riance. The table’s columns should report 1) chi-square, 2) degrees of freedom, 3) values of alternative fit indexes, and 4) the difference of fit indexes from the less constrained model. It is also useful to specify in the table the sample size, the model estimation method (Boomsma et al., 2012; Beaujean, 2014). A sample ta-ble containing measurement invariance results in Table 5.
4.7. Reliability (α and ω) and AVE
-Based Validity
Initially, the reliability and validity coefficients used are reported and their cut-off criteria like in the following example using Cronbach’s alpha (Cronbach, 1951), Omega total (McDonald, 1999, Werts, Lim, & Joreskog, 1974) and Aver-age Variance Extracted (Fornell & Larcker, 1981):
“To examine internal consistency reliability Cronbach’s alpha (α;Cronbach,
1951) and Omega coefficient (ω total;McDonald, 1999;Werts, Lim, &
Jo-reskog, 1974) were respectively estimated. Average Variance Extracted (AVE;
Fornell & Larcker, 1981) was also calculated to examine convergent validity
(Malhotra & Dash, 2011). Alpha and Omega values ≥ 0.70 are considered
adequate (Hair et al., 2010), whereas Kline (1999) suggested that alphas can
be as low as 0.60 for psychological constructs. The suggested threshold for
AVE is ≥ 0.50(Fomell & Larcker, 1981; Hair et al., 2010; Awang et al., 2015)”.
(The above example is an extract adapted from Kyriazos, et al., 2018e: p. 1841 validating the Brief Resilience Scale by Smith et al., 2008).
Then you can be more specific reporting coefficients:
“Cronbach’s alpha (Cronbach, 1951) in the total sample (Ν =2272) for the
entire BRS was 0.80. Omega Total (McDonald, 1999; Werts, Lim, &
Jo-reskog, 1974) in the total sample (Ν =2272) for the entire BRS was ω= 0.78
and Average Variance Extracted (AVE;Fornell & Larcker, 1981) was AVE
[image:17.595.64.541.584.687.2]= 0.44.”.
Table 5. Fit Measures of the nested models tested to validate measurement invariance. First column contains the level of inva-riance tested and the rest are the fit measures for that level.
Models Chi Square Df CFI RMSEA Model comparison ΔCFI ΔRMSEA DASS-21 (N=2272) Measurement Invariance Across Gender
M1. Configural Invariance 1396.27 366 0.945 0.050
M2. Weak Invariance 1433.56 384 0.944 0.049 M2-M1 −0.001 −0.001 M3. Strong Invariance 1524.97 405 0.941 0.049 M3-M2 −0.003 0.000
M4. Strict Invariance 1658.08 430 0.935 0.050 M4-M3 −0.006 0.001 The 3-factor original model (by Lovibond & Lovibond, 1995) was the baseline model. MLR estimator was used in all models.
DOI: 10.4236/psych.2018.911144 2520 Psychology (The example is an extract adopted from Kyriazos, et al., 2018e: p. 1841 vali-dating the Brief Resilience Scale-BRS—by Smith et al., 2008).
Alternatively, you can report mean values like in the following extract:
“Overall internal reliability for the entire DASS-21 was substantial and for
each factor significant (M = 0.89). Overall alpha for DASS-9 was adequate
and alphas per factor were also adequate (M = 0.76). For the total DASS-21,
omega was equally substantial and for each factor it was on average M =
0.81, indicating that the mean percentage of variance explained by each
DASS-21 factor score is 81%. For the total DASS-9, overall omega was also
substantial (0.91) and for each DASS-9 factor, it was on average, M = 0.76,
meaning that the mean percentage of variance explained by each DASS-9
factor score is 76%. Regarding the AVE for DASS-21, all values were
ac-ceptable, M = 0.53. For DASS-9 Mean AVE was marginally sufficient, M =
0.50”.
(The above example is an extract adapted from Kyriazos et al. 2018a: p. 1112 validating the DASS-21 and DASS-9 by Lovibond & Lovibond, 1995 and Yusoff, 2013 respectively).
Note that either way a table completes the report.
4.8. Convergent and Discriminant Validity with Correlation Analysis
Generally, correlation analysis is reported briefly and most information is con-tained in tables. When multiple measures are used, they can be grouped together by similarity of their construct reporting mean and range of correlation coeffi-cients. In-text information can be then presented as following:
“The correlation between BRS and other constructs was evaluated in the
total sample (N =2272) with 12 measures separated into five groups.
Cor-relations between BRS total and Groups of measures indicating Mental Dis-tress, Well-Being, Positivity, Affect, and Quality of Life were on average
medium to strong, M =−0.40, M = 0.36, M = 0.32, M = 0.47(SPANE-12 B
& SPANE-8 B), and M = 0.36 respectively (all significance levels at p < 0.001). Correlations ranged from 0.49 (Trait Hope by Snyder et al., 1991
and WEMWBS by Tennant et al., 2007) to −0.45(DASS-21 Depression by
Lovibond & Lovibond, 1995) and −0.42(DASS-9 Depression, Yussof, 2013
and Kyriazos et al., 2018a). For BRS Factor 1 (items 1, 3, 5) correlations
with Mental Distress, Well-Being, Positivity, Affect, and Quality of Life
group of measures were of weak to moderate magnitude, M = −0.30, M =
0.34, M = 0.30, M = 0.39(SPANE-12 B & SPANE-8 B), and M = 0.35
re-spectively (all significance levels at p < 0.001). They ranged from.46(Trait
Hope) to −0.35 (DASS-21 Depression) and −0.32 (DASS-9 Depression).
The BRS Factor 2(items 2, 4, 6) with Mental Distress, Well-Being,
Positivi-ty, Affect, and Quality of Life Group of measures was on average correlated
DOI: 10.4236/psych.2018.911144 2521 Psychology
(SPANE-12 B & SPANE-8 B), and M = 0.32, ranging from 0.44(SPANE-B)
to −0.44(DASS-21 Depression), all significance levels at p < 0.001. Second
largest positive correlations were with Trait Hope and WEMWBS (0.43)
and second largest negative with SPANE-N (−0.43).”
(The above example is an extract adapted from Kyriazos, et al., 2018e: pp. 1842-1843 validating the Brief Resilience Scale by Smith et al., 2008).
4.9. Normative Data
The normative data of the validated instrument is the last minimum required information to be included. It could be presented with the inclusion of a table as follows:
Across the total sample (N = 2272), mean BRS score was 3.46 (SD =.76),
corresponding to a point between “Neutral” (3) and “Agree” (4) of the
5-point Likert scale. The 25%, 50% and 75% of the respondents in this
sam-ple scored ≤3.00, ≤3.50 and ≤4.00 respectively. Smith et al., also reported
scores of 3.53 - 3.61 across four samples.
(The above example is an extract adapted from Kyriazos, et al., 2018e: pp. 1845-1846 validating the Brief Resilience Scale by Smith et al., 2008).
5. The Discussion Section Write-Up
Generally, the discussion is constructed in the following manner. First, the study purpose is restated. Key-findings are summarized next by stating whether they support hypotheses. The results are compared to previous research findings and conclusions are included (APA, 2001, 2010). The discussion usually is completed by commenting on any weaknesses of the research. Plausible explanations of differences or contradictions are suggested to be included (Boomsma, 2000). Fi-nally, implications of the findings and any future research directions may also be included. The discussion is completed by stating how the research findings add on existing knowledge.
More specifically, in every application of SEM (including CFA) MacCallum & Austin (2000) advised researchers to follow certain guidelines. They were urged to provide at a minimum the following information: clear specification of mod-els and variables, a list of the indicators of each latent variable; type of data ana-lyzed, the sample correlation or covariance matrix (a priori or upon request); the software used and method of estimation and/or rotation; and complete results. That is, multiple fit measures with their confidence intervals when necessary, all parameter estimates and associated confidence intervals or standard errors and finally clear criteria for model fit evaluation (MacCallum & Austin, 2000).
DOI: 10.4236/psych.2018.911144 2522 Psychology necessary. For the exploratory part of the conclusive statements are usually far more tentative (Boomsma, 2000). In both approaches, researchers are urged by MacCallum & Austin (2000) to clarify in the conclusions that other models may exist that fit the data at approximately the same level of goodness-of-fit. Thus, good fit does not necessarily equal to a correct or true model, but only a plausi-ble model. Thus conclusion about good-fitting models must be reasonably tem-pered. Finally, a good fit does not necessarily imply strong effects. Generally, it is suggested to inspect parameter estimates closely, even when the fit is very good (MacCallum & Austin, 2000). See also Major points of consensus and recom-mendations in the general literature of the SEM area in Table 6). See also minimum required information when reporting ML/MLR EFA, CFA or SEM research in Table 7.
6. The Abstract Section Write-Up
It usually contains: 1) Purpose of the study, 2) Method used, 3) Sample, 4) Re-sults of the optimal model (model fit), 5) Alternative models tested, 6) Reliability and validity results. It has no paragraphs and is a brief summary of the research in 120 - 200 words (Aspelmeier, 2008). It is followed by 5 - 7 key-words.
Table 6. Major points of Consensus and Recommendations in the general literature of the SEM area.
Consensus Points on best reporting practices in ML/MLR, CFA and SEM The best guide to assessing model fit is strong substantive theory.
The chi-square test statistic should not be the sole basis for determining model fit The use of multiple fit statistics promotes more reliable and conservative evaluations
We should not ignore the fit of the components of a model. The researchers should always examine the components of fit along with the overall fit measures.
it is better to examine several alternative models than only a single model. Recommendations
Outliers and influential cases should be traced and the distributional assumptions of an estimator should be satisfied as a perquisite. Next steps follow.
When reporting fit indices, choose ones that represent different families of measures or tap different aspects of the model.
Choose fit indices with sampling distribution means that are not or are only weakly related to the sample size.
Choose fit indices that take into consideration the model degrees of freedom
Evaluate the model adequacy based on prior studies. Decide on the optimal model on the basis of comparison
The objective of fitting SEMs is to understand a substantive area, not simply to obtain an adequate fit (e.g local optimum)
DOI: 10.4236/psych.2018.911144 2523 Psychology
Table 7. Minimum required information when reporting ML/MLR EFA, CFA or SEM research.
A theoretical underpinning for the hypothesized model
A description of how the model was specified (indicator variables for each latent variable and scal-ing, freely estimated and constrained parameters)
Sample description (sample size and sampling method)
The type of data used (e.g., nominal, continuous) and descriptive statistics of the dataset Tests of multivariate normality assumptions and parameter estimator of the model Missing data analysis
Software package utilized to fit the model
Measures of model fit, and the cutoff criteria used to indicate goodness of fit Any modifications to the original model based on specification searches
Beaujean, 2014: p. 34, Raykov et al., 1991: pp. 501-502.
7. Summary and Concluding Thoughts
When preparing a Factor Analysis report, at a minimum it is necessary to report the type of factor analysis (EFA or CFA) and why, the method of factor extrac-tion (in EFA) or the method of estimaextrac-tion (in CFA), the type of rotaextrac-tion (in EFA). This information is complemented by which fit statistics will be used and their cutoff limits. Goodness-of-fit tables of alternative models tested and a path diagram of the optimal model are also routinely reported in CFA and in EFA when fit statistics are used along with or in place of the eigenvalue-based ap-proach to decide on the number of factors to be retained. Testing alternative models and the existence of equally plausible models is a protection against con-firmation bias. Cross-validation is a protection against overfitting. For more in-formation, refer to Kyriazos (2018). For measurement, invariance is also re-quired to report the baseline model and how it emerged, the fit of this model in the groups evaluated separately and a Table with the goodness-of-fit of the nested models’ comparison. Generally, regarding SEM reporting, APA JARS-Quant Working Group urged authors to report a justification for the sta-tistical method or model testing strategies (like ML vs. a different estimator or trimming vs. building respectively, c.f. Schreiber, 2008). About model respecifi-cation, authors are urged to state a theoretical or statistical reason for modifying (Appelbaum, Kline, Nezu, Cooper, Mayo-Wilson, & Rao, 2018: p. 17).
For good practices about SEM research Kline (2016: p. 453) reproducing the work of Thompson (2000) listed 10 commandments on the use of SEM also useful in a CFA design and reporting: “No small samples, Analyze covariance, not correlation matrices, Simpler models are better, Verify distributional as-sumptions, Consider theoretical and practical significance Not just statistical significance, Report multiple fit statistics, Use two-step modeling for SR models, Consider theoretically plausible alternative models, Respecify rationally, Ac-knowledge equivalent models”.
DOI: 10.4236/psych.2018.911144 2524 Psychology report the results of structural equation models whereas Hatcher provides a sample write-up of an SEM analysis. For more recent approaches also refer to Hoyle and Isherwood (2013), O’Rourke and Hatcher (2013), Hancock and Mueller (2010) or Loehlin and Beaujean (2017). Useful information about APA reporting standards is available to the APA Publication Manual (6th edition, APA 2009, 2010). These sources cover publication content and number formats but it is beyond the scope of this work.
Additionally, examples from other studies were not included in the Discussion section and maybe this is a limitation of this work. However, the Discussion sec-tion is too dependent on results presented and an example would likely be of lit-tle use because of limited generalizability. Properly reported EFA and CFA in construct validation studies could contribute to the improvement of the quality of the measurement instruments and better measurement, as a rule, generates better inferences.
Conflicts of Interest
The authors declare no conflicts of interest regarding the publication of this pa-per.
References
American Psychological Association (2001). Publication Manual of the American Psy-chological Association (5th ed.). Washington DC: Author
American Psychological Association (2010). Publication Manual of the American Psy-chological Association (6th ed.). Washington DC: Author.
APA Publications and Communications Board Working Group on Journal Article Re-porting Standards (2018). ReRe-porting Standards for Research in Psychology: Why Do We Need Them? What Might They Be? American Psychologist, 63, 839-851.
https://doi.org/10.1037/0003-066X.63.9.839
Appelbaum, M., Kline, R. B., Nezu, A. M., Cooper, H., Mayo-Wilson, E., & Rao, S. M. (2018). Journal Article Reporting Standards for Quantitative Research in Psychology: The APA Publications and Communications Board Task Force Report. American Psy-chologist, 73, 3-25. https://doi.org/10.1037/amp0000191
Asendorpf, J. B., Conner, M., De Fruyt, F., De Houwer, J., Denissen, J. J. A., Fiedler, K. et al. (2013). Recommendations for Increasing Replicability in Psychology. European Journal of Personality, 27, 108-119. https://doi.org/10.1002/per.1919
Aspelmeier, J. A. (2008). Sample APA Paper: The Efficacy of Psychotheraputic Interven-tions with Profoundly Deceased Patients. Radford University: Author.
Bartlett, M. S. (1951). The Effect of Standardization on a 2 Approximation in Factor Analysis. Biometrika, 38, 337-344.
Bartlett, M. S. (1954). A Note on the Multiplying Factors for Various Chi Square Ap-proximations. Journal of the Royal Statistical Society (Series B), 16, 296-298.
Beaujean, A. A. (2014). Latent Variable Modeling Using R: A Step-by-Step Guide. New York, NY: Routledge. https://doi.org/10.4324/9781315869780
DOI: 10.4236/psych.2018.911144 2525 Psychology Beins, B. C. (2012). APA Style Simplified: Writing in Psychology, Education, Nursing,
and Sociology. London: John Wiley & Sons, Inc.
Bentler, P. M. (1990). Comparative Fit Indexes in Structural Models. Psychological Bulle-tin, 107, 238-246. https://doi.org/10.1037/0033-2909.107.2.238
Bentler, P. M. (1995). EQS Structural Equations Program Manual. Encino, CA: Multiva-riate Software.
Bollen, K. A. (1989). A New Incremental Fit Index for General Structural Equation Mod-els. Sociological Methods & Research, 17, 303-316.
https://doi.org/10.1177/0049124189017003004
Bollen, K. A., & Long, S. J. (1992). Tests for Structural Equation Models: Introduction.
Sociological Methods & Research, 21, 123-131.
https://doi.org/10.1177/0049124192021002001
Boomsma, A. (2000). Reporting Analyses of Covariance Structure. Structural Equation Modeling, 7, 461-483. https://doi.org/10.1207/S15328007SEM0703_6
Boomsma, A., Hoyle, R. H., & Panter, A. T. (2012). The Structural Equation Modeling Research Report. In R. H. Hoyle (Ed.), Handbook of Structural Equation Modeling (pp. 341-358). New York, NY: Guilford.
Breckler, S. J. (1990). Applications of Covariance Structure Modeling in Psychology: Cause for Concern? Psychological Bulletin, 107, 260-273.
https://doi.org/10.1037/0033-2909.107.2.260
Brislin, R. W. (1970). Back-Translation for Cross-Cultural Research. Journal of Cross-Cultural Psychology, 1, 185-216.https://doi.org/10.1177/135910457000100301
Brislin, R., Lonner, W., & Thorndike, R. (1973). Cross-Cultural Research Methods. New York, NY: John Wiley & Sons.
Brown, T. A. (2015). Confirmatory Factor Analysis for Applied Research (2nd ed.). New York, NY: Guilford Publications.
Brown, T. A., & Moore, M. T. (2012). Confirmatory Factor Analysis. In R. H. Hoyle (Ed.),
Handbook of Structural Equation Modeling (pp. 361-379). New York, NY: Guilford Publications.
Byrne, B. M. (2012). Structural Equation Modeling with Mplus: Basic Concepts, Applica-tions, and Programming. London: Routledge.
Byrne, B. M., & Stewart, S. M. (2006). The MACS Approach to Testing for Multigroup Invariance of a Second-Order Structure: A Walk through the Process. Structural Equa-tion Modeling, 13, 287-321.https://doi.org/10.1207/s15328007sem1302_7
Byrne, B. M., Shavelson, R., & Muthen, B. (1989) Testing for the Equivalence of Factor Covariance and Mean Structures: The Issue of Partial Measurement Invariance. Psy-chological Bulletin, 105, 456-466.https://doi.org/10.1037/0033-2909.105.3.456
Campbell, D. T., & Fiske, D. W. (1959). Convergent and Discriminant Validation by the Multitrait-Multimethod Matrix. Psychological Bulletin, 56, 81-105.
https://doi.org/10.1037/h0046016
Cattell, R. B. (1966). The Scree Test for the Number of Factors. Multivariate Behavioral Research, 1, 245-276. https://doi.org/10.1207/s15327906mbr0102_10
Cheung, G. W., & Rensvold, R. B. (2002). Evaluating Goodness-of-Fit Indexes for Testing Measurement Invariance. Structural Equation Modeling, 9, 233-255.
https://doi.org/10.1207/S15328007SEM0902_5
DOI: 10.4236/psych.2018.911144 2526 Psychology PLoS ONE, 13, e0192761. https://doi.org/10.1371/journal.pone.0192761
Cronbach, L. J. (1951). Coefficient Alpha and the Internal Structure of Tests. Psychome-trika, 16, 297-334.https://doi.org/10.1007/BF02310555
DeVellis, R. F. (2017). Scale Development: Theory and Applications (4th ed.). Thousand Oaks, CA: Sage.
Diener, E., Wirtz, D., Tov, W., Kim-Prieto, C., Choi, D, Oishi, S., & Biswas-Diener, R. (2010). New Well-Being Measures: Short Scales to Assess Flourishing and Positive and Negative Feelings. Social Indicators Research, 97, 143-156.
https://doi.org/10.1007/s11205-009-9493-y
Fabrigar, L. R., & Wegener, D. T. (2012). Exploratory Factor Analysis. New York, NY: Oxford University Press, Inc.
Finch, H. W., Immekus, J. C., & French, B. F. (2016). Applied Psychometrics Using SPSS and AMOS. Charlotte, NC: Information Age Publishing Inc.
Floyd, F. J., & Widaman, K. F. (1995). Factor Analysis in the Development and Refine-ment of Clinical AssessRefine-ment InstruRefine-ments. Psychological Assessment, 7, 286.
https://doi.org/10.1037/1040-3590.7.3.286
Fornell, C., & Larcker, D. F. (1981). Structural Equation Models with Unobservable Va-riables and Measurement Error: Algebra and Statistics. Journal of Marketing Research, 18, 382-388.https://doi.org/10.2307/3150980
Giotsa, A. Z., Zergiotis, A. N., & Kyriazos, T. (2018). Is the Greek Version of Teacher’s Evaluation of Student’s Conduct (TESC) a Valid and Reliable Measure? Psychology, 9,
1208-1227.https://doi.org/10.4236/psych.2018.95074
Grant, N., & Fabrigar, L. R. (2007). Exploratory Factor Analysis. In N. J. Salkind (Ed.),
Encyclopedia of Measurement and Statistics (pp. 332-335). Thousand Oaks, CA: Sage. Hancock, G. R., & Mueller, R. O. (2010). The Reviewer’s Guide to Quantitative Methods
in the Social Sciences. New York, NY: Routledge.
Hatcher, L. (1994). A Step-by-Step Approach to Using the SAS System for Factor Analysis and Structural Equation Modeling. Cary, NC: SAS Institute.
Hayduk, L. A. (1987). Structural Equation Modeling with LISREL: Essentials and Ad-vances. Baltimore, MD: The Johns Hopkins University Press.
Hill, C. E., Thompson, B. J., & Williams, E. N. (1997). A Guide to Conducting Consensual Qualitative Research. The Counseling Psychologist, 25, 517-572.
https://doi.org/10.1177/0011000097254001
Horn, J. L. (1965). A Rationale and Test for the Number of Factors in Factor Analysis.
Psychometrika, 30, 179-185. https://doi.org/10.1007/BF02289447
Howitt, D., & Cramer, D. (2017). Understanding Statistics in Psychology with SPSS (7th ed.). London: Pearson Education.
Hoyle, R. H., & Isherwood, J. C. (2013). Reporting Results from Structural Equation Modeling Analyses in Archives of Scientific Psychology. Archives of Scientific Psy-chology, 1, 14-22.https://doi.org/10.1037/arc0000004
Hoyle, R. H., & Panter, A. T. (1995). Writing about Structural Equation Models. In R. H. Hoyle (Ed.), Structural Equation Modeling: Concepts, Issues, and Applications (pp. 158-176). Thousand Oaks, CA: Sage.
Joreskog, K. G., & Sorbom, D. (1988). LISREL 7. A Guide to the Program and Its Applica-tion. Chicago: SPSS Inc.
DOI: 10.4236/psych.2018.911144 2527 Psychology Joreskog, K. G., & Sörbom, D. (1996). LISREL 8: User’s Reference Guide (2nd ed.).
Chi-cago: Scientific Software International.
Kaiser, H. (1970). A Second Generation Little Jiffy. Psychometrika, 35, 401-415.
https://doi.org/10.1007/BF02291817
Kaiser, H. (1974). An Index of Factorial Simplicity. Psychometrika, 39, 31-36.
https://doi.org/10.1007/BF02291575
Kaiser, H. F. (1960). The Applications of Electronic Computer to Factor Analysis. Educa-tional and Psychological Measurement, 20, 141-151.
https://doi.org/10.1177/001316446002000116
Kelloway, E. K. (2015). Using Mplus for Structural Equation Modeling. Thousand Oaks, CA: Sage.
Kline, R. B. (2016). Principles and Practice of Structural Equation Modeling (4th ed.). New York, NY: The Guilford Press.
Kyriazos, T. A. (2018). Applied Psychometrics: The 3-Faced Construct Validation Me-thod, a Routine for Evaluating a Factor Structure. Psychology, 9, 2044-2072.
https://doi.org/10.4236/psych.2018.98117
Kyriazos, T. A., Stalikas, A., Prassa, K., & Yotsidi, V. (2018a). Can the Depression Anxiety Stress Scales Short Be Shorter? Factor Structure and Measurement Invariance of DASS-21 and DASS-9 in a Greek, Non-Clinical Sample. Psychology, 9, 1095-1127. https://doi.org/10.4236/psych.2018.95069
Kyriazos, T. A., Stalikas, A., Prassa, K., & Yotsidi, V. (2018b). A 3-Faced Construct Vali-dation and a Bifactor Subjective Well-Being Model Using the Scale of Positive and Negative Experience, Greek Version. Psychology, 9, 1143-1175.
https://doi.org/10.4236/psych.2018.95071
Kyriazos, T. A., Stalikas, A., Prassa, K., Galanakis, M., Flora, K., & Chatzilia, V. (2018c). The Flow Short Scale (FSS) Dimensionality and What MIMIC Shows on Heterogeneity and Invariance. Psychology, 9, 1357-1382.https://doi.org/10.4236/psych.2018.96083
Kyriazos, T. A., Stalikas, A., Prassa, K., Galanakis, M., Yotsidi, V., & Lakioti, A. (2018e). Psychometric Evidence of the Brief Resilience Scale (BRS) and Modeling Distinctive-ness of Resilience from Depression and Stress. Psychology, 9, 1828-1857.
https://doi.org/10.4236/psych.2018.97107
Kyriazos, T. A., Stalikas, A., Prassa, K., Yotsidi, V., Galanakis, M., & Pezirkianidis, C. (2018d). Validation of the Flourishing Scale (FS), Greek Version and Evaluation of Two Well-Being Models. Psychology, 9, 1789-1813.
https://doi.org/10.4236/psych.2018.97105
Lawley, D. N. (1940). The Estimation of Factor Loadings by the Method of Maximumli-kelihood. Proceedings of the Royal Society of Edinburgh, 60, 64-82.
Levitt, H. M., Creswell, J. W., Josselson, R., Bamberg, M., Frost, D. M., & Suárez-Orozco, C. (2018). Journal Article Reporting Standards for Qualitative Primary, Qualitative Meta-Analytic, and Mixed Methods Research in Psychology: The APA Publications and Communications Board Task Force Report. American Psychologist, 73, 26-46. https://doi.org/10.1037/amp0000151
Loehlin, J. C., & Beaujean, A. A. (2017). Latent Variable Models: An Introduction to Fac-tor, Path, and Structural Equation Analysis. New York, NY: Taylor & Francis.
Lorenzo-Seva, U., Timmerman, M. E., & Kiers, H. A. L. (2011). The Hull Method for Se-lecting the Number of Common Factors. Multivariate Behavioral Research, 46,
340-364. https://doi.org/10.1080/00273171.2011.564527
DOI: 10.4236/psych.2018.911144 2528 Psychology Scales. Sydney: Psychology Foundation.
MacCallum, R. C., & Austin, J. T. (2000). Applications of Structural Equation Modeling in Psychological Research. Annual Review of Psychology, 51, 201-226.
https://doi.org/10.1146/annurev.psych.51.1.201
Mardia, K. V. (1970). Measures of Multivariate Skewness and Kurtosis with Applications.
Biometrika, 57, 519-530.https://doi.org/10.1093/biomet/57.3.519
McBride, D. M. (2012). Introduction to APA Publication. Illinois, IL: Author.
McBride, D. M., & Wagman, J. B. (1997). Rules for Reporting Statistics in Papers. Journal of APA Style Rules, 105, 55-67.
McDonald, R. P. (1999). Test Theory: A Unified Treatment. Mahwah, NJ: Erlbaum. McDonald, R. P., & Ringo Ho, M. (2002). Principles and Practice in Reporting Structural
Equation Analyses. Psychological Methods, 7, 64-82. https://doi.org/10.1037/1082-989X.7.1.64
Muthen, L. K., & Muthen, B. O. (2012). Mplus Statistical Software, 1998-2012. Los An-geles, CA: Muthen & Muthen.
Nicol, A. A. M., & Pexman, P. M. (2010). Presenting Your Findings: A Practical Guide for Creating Tables (6th ed.). Washington DC: American Psychological Association. O’Rourke, R., & Hatcher, L. (2013). A Step-by-Step Approach to Using SAS for Factor
Analysis and Structural Equation Modeling (2nd ed.). Cary, NC: SAS Institute. Pallant, J. (2016). SPSS Survival Manual (5th ed.). Berkshire: McGraw-Hill Education. Phelan, J. (2007). Guidelines for Writing an APA Style Lab Report. Illinois, IL: Author. Porter, R. D., & Fabrigar, L. R. (2007). Factor Analysis. In N. J. Salkind (Ed.),
Encyc-lope-Dia of Measurement and Statistics (pp. 341-345). Thousand Oaks, CA: Sage. Raiche, G., Walls, T.A., Magis, D., Riopel, M., & Blais, J.G. (2013). Non-Graphical
Solu-tions for Cattell’s Scree Test. Methodology, 9, 23-29.
https://doi.org/10.1027/1614-2241/a000051
Raykov, T., Tomer, A., & Nesselroade, J. R. (1991). Reporting Structural Equation Mod-eling Results in Psychology and Aging: Some Proposed Guidelines. Psychology and Aging, 6, 499-533.https://doi.org/10.1037/0882-7974.6.4.499
Reichardt, C. S. (1992). The Fallibility of Our Judgments. Evaluation Practice, 13,
157-163.https://doi.org/10.1016/0886-1633(92)90001-R
Revelle, W., & Rocklin, T. (1979) Very Simple Structure—Alternative Procedure for Es-timating the Optimal Number of Interpretable Factors. Multivariate Behavioral Re-search, 14, 403-414. https://doi.org/10.1207/s15327906mbr1404_2
Rohner, R. P. (2005). Teacher’s Evaluation of Student’s Conduct (TESC): Test Manual. In R. P. Rohner, & A. Khaleque (Eds.), Handbook for the Study of Parental Acceptance and Rejection (4th ed., pp. 323-324). Storrs, CT: Rohner Research Publications. Schreiber, J. B. (2008). Core Reporting Practices in Structural Equation Modeling.
Re-search in Social and Administrative Pharmacy, 4, 83-97. https://doi.org/10.1016/j.sapharm.2007.04.003
Schreiber, J. B., Nora, A., Stage, F. K., Barlow, E. A., & King, J. (2006). Reporting Struc-tural Equation Modeling and Confirmatory Factor Analysis Results: A Review. Journal of Educational Research, 99, 323-337.https://doi.org/10.3200/JOER.99.6.323-338
Schumacker, R. E., & Lomax, R. G. (2016). A Beginner’s Guide to Structural Equation Modeling (4th ed.). New York, NY: Routledge.