ISSN Print: 2327-5952
DOI: 10.4236/jss.2019.72016 Feb. 20, 2019 185 Open Journal of Social Sciences
Digital Assets Price Forecast Based on POW
Mining Mechanism
Zhihong Li
1, Jie Wang
1, Kexin Li
21School of Business Administration, South China University of Technology, Guangzhou, China 2School of Journalism and Communication, Shandong University, Shandong, China
Abstract
With the birth of blockchain technology, digital assets such as Bitcoin have also rapidly developed. In recent years, although the development of digital assets has been blocked by national policies, it is still favored by many inves-tors in the capital market. Today, the price of Bitcoin has reached as high as 4000 $, and some early investors in Bitcoin have received rich returns. But the fluctuations in bitcoin prices are also difficult for investors to ponder, and even let some people lose their money. By analyzing the factors affecting the price of bitcoin, this paper predicts the trend of bitcoin price through linear regression model through the difficulty of mining based on POW mechanism and people’s attention to digital assets (Google Trend Index), thus providing investors with some reference comments.
Keywords
Blockchain, Digital Assets, POW, Regression Model
1. Introduction
The currency plays an important role in advancing the development of human culture and is a milestone in all stages of human civilization development. The history of currency evolution has gone through five important stages: physical currency, weighing currency, banknotes, electronic money, and digital assets. A person named Satoshi Nakamoto released a blockchain network design called Bitcoin: A Peer-to-Peer Electronic Cash System at the Cryptography Forum in October 31, 2008 [1]. In 2009, the source code of the blockchain technology network was published. And in January 3, 2009, the world’s first asset with blockchain technology was born. Despite controversy, blockchain technology is indeed a milestone innovation in Internet technology development. PoW-based How to cite this paper: Li, Z.H., Wang, J.
and Li, K.X. (2019) Digital Assets Price Forecast Based on POW Mining Mechanism. Open Journal of Social Sciences, 7, 185-198. https://doi.org/10.4236/jss.2019.72016
Received: January 4, 2019 Accepted: February 17, 2019 Published: February 20, 2019
Copyright © 2019 by author(s) and Scientific Research Publishing Inc. This work is licensed under the Creative Commons Attribution International License (CC BY 4.0).
http://creativecommons.org/licenses/by/4.0/
DOI: 10.4236/jss.2019.72016 186 Open Journal of Social Sciences blockchain digital assets are constantly being solved by miners using computer CPU/GPU computing power, a so-called workload proof mechanism (POW)
[2]. After successful cracking, a certain number of digital assets can be obtained as rewards. If you want to calculate a special solution problem, you need to pay the corresponding probability of calculation [3]. Whoever has more computing power, the possibility of calculating the special solution is even greater. There-fore, the use of the POW mechanism to participate in mining will pay amount of computing power. A certain number of special solutions will be set in the back-ground. The number of special solutions set in the background is fixed. There-fore, the number of digital assets in a blockchain network based on the POW mechanism is limited, and the calculation difficulty of the special solution will be continuously improved, so as to control the number of digital assets that can be mined [4]. Similarly, the amount of gold in the earth is also limited.
There are two forms of obtaining digital assets. The first form is based on the POW mechanism, which solves special solutions. The second form is purchased through a trading platform. Cracking special solutions is the competition about computing power. The better the computer performance, the more likely it is to dig into digital assets. However, in today’s huge mining market, relying on per-sonal computer mining efficiency is very low [5]. Therefore, in order to increase the mining efficiency, in addition to continuously optimizing the performance of mining equipment, joint mining which called mining pool came into being. The mining is gradually upgraded from the individual to the organization and even the company level. Both parties to a digital asset transaction need a “wallet” and an “address”, and the process can be analogized to communication between emails. Both parties to the transaction can use the mobile phone or personal computer to log in to a trading platform to conduct trading. Online purchases on the trading platform are an important channel for acquiring digital assets, and most of the purchase and withdrawal functions can be implemented on the trading platform [6] [7].
2. Theoretical Background
The article combines “positivism” and “human behavior” to rationally analyze the market changes of the blockchain digital assets based on the POW mechan-ism and the factors affecting their prices. First, we conducted an analysis of the price fluctuations of digital assets through surveys, and summarized the main price basis of digital assets in the emerging stage. Secondly, we propose thinking and hypothesis about blockchain digital assets for the current research and mar-ket status. Finally, empirical analysis of a large number of data to obtain regres-sion-related conclusions, and test the other digital assets based on the POW mechanism [8].
2.1. POW Mining Mechanism
DOI: 10.4236/jss.2019.72016 187 Open Journal of Social Sciences technology. The essence of the blockchain technology can be traced back to the famous “Byzantine General” issue, the intrinsic meaning of the byzantine gener-al problem is that in the absence of a trusted third party, that is, the authoritative node, how to quickly converge to reach a consensus across the network. Block-chain technology is a good solution to the classic byzantine general problem, reaching no central node, that is, in a distributed situation, the consensus of the whole network is reached [9] [10]. Blockchain technology primarily addresses the issue of reaching consensus in a distributed scenario. The POW mechanism is the main algorithm and means to achieve efficient consensus [11]. The POW mechanism makes blockchain transactions unpredictable and tamper-proof. The core idea of the POW mechanism is to calculate a special solution through the competition of distributed nodes. This special solution is a SHA256 math prob-lem that solves complex difficulties but is easier to verify. The solution to this special solution is the fastest, the miner has the billing rights for the block and will receive a certain amount of bitcoin rewards, and the block is also counted in the longest blockchain [12] [13] [14]. It can be seen that miners participating in the POW mechanism will pay a lot of computing power.
Digital assets based on blockchain technology are gradually becoming familiar to the public. However, in the foreseeable future of blockchain digital assets, it cannot replace the mainstream currency. We assume that the 21 million bitcoin blockchain digital assets can replace the competing currencies and value the dig-ital assets. Comparing cash in circulation (M0) with 21 million bitcoin block-chain digital assets, you can estimate the price of a single digital asset, but in the long run, the valuation of digital assets in this way can only be used as a refer-ence for valuation [15].
spe-DOI: 10.4236/jss.2019.72016 188 Open Journal of Social Sciences culative capital takes turns, the predictability of its price becomes more difficult
[18].
2.2. Main Factors Affecting the Price of Blockchain Digital Assets
Blockchain digital asset market is like a roller coaster. We notice that whenever there is a hot event related to blockchain, it will cause the price of this digital as-set to skyrocket. According to the analysis of historical price fluctuations in the previous section, and in the development stage of chain digital assets, the fol-lowing factors are the main factors leading to price fluctuations of blockchain digital assets.1) Security
From the events affecting the price fluctuation of digital assets in the block-chain, it can be seen that the security issue is the primary factor affecting the price of digital assets. Hackers attack blockchain networks or trading platform problems. Once such negative events occur, the numbers will be met. Asset prices have a big impact. For example, in June 2011, the hacking incident on the blockchain trading website caused a big sensation in the Bitcoin blockchain network community, which shook the confidence of investors and the price fell. In 2012, Linode, as a web host, lost more than 40,000 bitcoins due to the leak of its server’s super-administrative password, causing the price to drop to around $4. On February 7, 2014, Mt. Gox suspended the blockchain digital asset re-demption business due to technical loopholes, and transaction services were still available, but led to a decline in bitcoin prices. According to the China Informa-tion Security Comprehensive Report for the First Half of 2013 issued by the In-formation Security Research and Service Center of China National InIn-formation Center, the primary target of hacker attacks and cyber fraud in China is Bitcoin. Its total number is limited and its value is constantly rising. Due to its high ano-nymity, it is difficult to trace back once it is stolen. This feature has attracted widespread attention from hackers because of the high level of digital assets in the Bitcoin blockchain. The returnibility and high anonymity that is difficult to trace, make security the primary factor in the price fluctuations of blockchain digital assets.
2) Related policies
DOI: 10.4236/jss.2019.72016 189 Open Journal of Social Sciences difficult to predict, which will increase the sensitivity to the price of blockchain digital assets. For example, on October 22, 2015, according to the European Court of Justice, digital assets in blockchains in European countries should be treated equally with traditional currencies, and policies to exempt VAT were greatly encouraged, and the supporters of digital assets in the blockchain were greatly encouraged. On January 17, 2018, the price of bitcoin digital assets fell by as much as 25%, because many governments have strengthened the control over the digital assets of the blockchain.
3) Market recognition
The market’s recognition of the value of blockchain digital assets will also af-fect the price of Bitcoin. For example, from 2009 to 2010, blockchain network technology has just emerged, development is relatively slow, the market is in the early stage of cognition, and the digital asset acceptance of blockchain is not high. In December 2013, Lamborghini dealers announced that Bitcoin block-chain digital assets could be used as payment instruments for Tesla electric ve-hicles. In 2016, more and more people recognized the value of blockchain digital assets. At the beginning of the year, the People’s Bank of China held a seminar on digital currency, aiming to launch a national legal digital currency and dis-cuss the application of digital currency in different scenarios, which greatly in-spired Chinese digital currency practitioners and investors. The price of digital assets in the blockchain chain also rose. From the historical market point of view, when the blockchain digital assets or related events are approved by the mainstream market, it will trigger domestic and foreign media to report, which will have a significant upward adjustment of the blockchain digital asset prices. Therefore, the recognition and acceptance of blockchain digital assets will be an important factor driving the price increase of blockchain digital assets.
4) Mining cycle that is halved in four years
According to the basic supply relationship of economics, if demand increases and supply decreases, prices will inevitably rise. The fact that the number of bit-coin blockchain network mining is halved is a well-known fact. On November 28, 2012, the number of bitcoin blockchain network mining was halved, from 7200 to 3600, due to supply halving. The quantity is in short supply, which makes the price increase. On July 10, 2016, entering the second four-year cycle of production halving, resulting in a shortage of demand and rising prices. Therefore, in the time when the number of mining in the blockchain network is halved, it is worthy of investors’ attention. The shortage of output will inevitably lead to an increase in prices.
5) Hard forks and other digital assets
DOI: 10.4236/jss.2019.72016 190 Open Journal of Social Sciences solves the performance problem of the blockchain, and more people will accept the blockchain network before and after the fork. And the holder of the digital asset before the fork can get the same amount of forked assets. The forked digital assets are mirrored from the original blockchain, but have different agreements with the previous ones. The new forked digital assets differentiate the capital flow and market attention, so the price of blockchain digital assets will fall in the short term, due to the dilution of the value. The impact of hard forks on block-chain digital assets is short-term, and its price will rise in the long run. Hard forks can be seen as a slowdown in the price of blockchain digital assets.
Due to the open source nature of the Bitcoin blockchain network technology, there are many other blockchain digital assets issued, such as Ethereum. Its ideas and techniques are derived from Nakamoto’s first blockchain network, which is arguably the first blockchain digital asset super-issue. Other digital assets are emerging one after another. The first blockchain digital assets have no absolute technical advantage. Due to its open source nature, the market only sees its high price, mining is difficult, other digital assets are cheaper, and it is easier to spe-culate. Therefore, the existence of digital assets in other blockchains will certain-ly share the market and affect the price of Bitcoin blockchain assets.
In summary, whether it is security issues, the introduction of national policies, market acceptance, four-year mining halving, forks and other digital assets, it will cause big reports from domestic and foreign media, and blockchain digital assets will gradually entering the public’s field of vision, people’s attention to the blockchain network will also increase.
3. Blockchain Digital Assets Valuation Model
The previous section analyzed the factors affecting the price of digital assets. Cost, safety, national policy, market acceptance, halving of four-year mining quantities, forks and other digital assets all contribute to the value of digital as-sets. This chapter will use positivism to analyze data on other factors such as cost and safety, national policy control, and mathematical regression fitting model analysis.
3.1. Correlation between Mining Calculation Difficulty and Digital
Assets Value
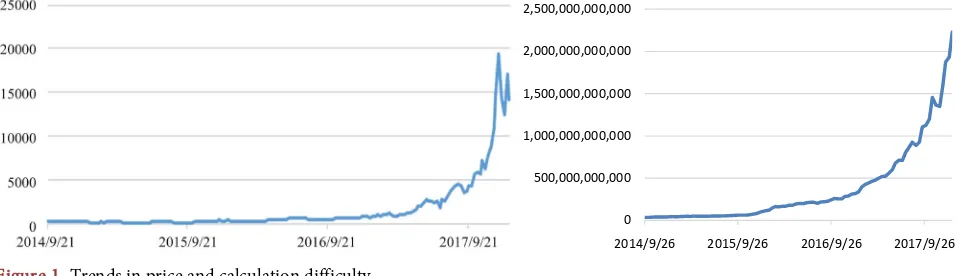
DOI: 10.4236/jss.2019.72016 191 Open Journal of Social Sciences trend of the cost of digital assets in the blockchain. In order to prove whether the blockchain digital asset price has certain correlation with the mining calculation difficulty, we select the bitcoin blockchain network price history data provided by Investing.com and the historical mining calculation difficulty data provided by “Bitfan” between September 21, 2014 and January 7, 2018. The data is in weekly units. As shown in Figure 1, we can see that the price movements are basically the same as the calculation difficulty, and generally show an upward trend.
According to Metcalfe’s law, as the number of squares of users increases, the usefulness of the network increases. In other words, the value of the network is V = K × N2 (K is the value coefficient, N is the number of users),and the for-mula indicates that the value of the network is proportional to the square of the number of connected users. For example, the telephone network is proportional to the square of the number of telephone users. Due to the increasing number and technical advancement of mining equipment in various parts of the world, the number of digital assets in the blockchain that can be excavated by equip-ment with unit computing capacity has gradually decreased, so the cost of bit-coin is rising rapidly, as shown in Figure 1.
Analogy to Metcalf, we make assumptions and verify that the more miners the network is engaged in mining, the more difficult it is to mine, and the higher the value of the blockchain network. Therefore, we suspect that the square of the difficulty of mining calculation is linear with the price of blockchain digital as-sets, so we plot the historical price of the bitcoin and the square of the difficulty of historical mining calculation into a scatter plot, as shown in Figure 2. As shown, it can be seen that there is a certain linear relationship between the price and the square of the difficulty of mining calculation, so we perform regression analysis on the two variables to further verify the relationship.
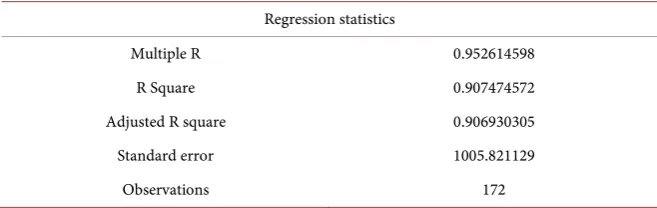
[image:7.595.59.538.581.719.2]It can be seen from Table 1 that the correlation coefficient Multiple R, which measures the degree of correlation between the price and the square of the diffi-culty of mining calculation, R = 0.9526, indicating that the price is highly corre-lated with the square of the difficulty of mining calculation, and is positively correlated. The coefficient R2 = 0.9075, which is a high degree of fitting. The ability to explain the price is 90.75%, and the fitting effect is strong. Adjusted R
Figure 1. Trends in price and calculation difficulty.
0 500,000,000,000 1,000,000,000,000 1,500,000,000,000 2,000,000,000,000 2,500,000,000,000
DOI: 10.4236/jss.2019.72016 192 Open Journal of Social Sciences
Figure 2. The scatter plot of price and calculation difficulty squared.
Table 1. Topics focus on correlation between volume and issue number.
Regression statistics
Multiple R 0.952614598
R Square 0.907474572
Adjusted R square 0.906930305
Standard error 1005.821129
Observations 172
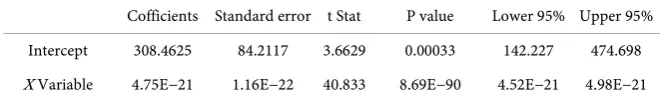
square = 0.9069, indicating that the square of the mining calculation difficulty can explain 90.69% of the price. Table 2 shows the regression effect of the F-significant statistic to determine the price and the mining difficulty square re-gression model. The P value in the analysis of the price and mining calculation difficulty is equal to 8.69135 × 10−90, which is not significant. The regression ef-fect of the squared regression model of price and mining difficulty is more sig-nificant. It can be seen from Table 3 that the P value of the square of the diffi-culty of mining calculation is 8.6910 × 10−90, which is much smaller than the sig-nificance level of 0.05, indicating that the regression coefficient of the square of mining difficulty is very significant, and the square of mining difficulty is related to price [19] [20] [21] [22].
From the above regression analysis, we prove that the square of the difficulty of mining calculation has a significant linear relationship with the price.
3.2. Correlation between Search Volume and Price of Digital Prices
In fact, the rise and fall of blockchain digital assets is formed by cost information combined with market information. In the short-term and medium-term pers-pectives, the media’s positive and bad news has a great impact on digital asset holders or investors. Every time, the blockchain digital assets skyrocketed and plunged almost always accompanied by hot events. These hot events are ana-lyzed in the previous chapter on the behavior of digital asset prices (security,0.00 5,000.00 10,000.00 15,000.00 20,000.00 25,000.00
[image:8.595.209.538.291.395.2]DOI: 10.4236/jss.2019.72016 193 Open Journal of Social Sciences
Table 2. Variance analysis table of price and calculation difficulty squared.
df SS MS F Significance F
Regression analysis 1 1.69E+09 1.69E+09 1667.3 8.69E−90 residual 170 1.72E+08 1011676
total 171 1.86E+09
Table 3. Variance regression of price and calculation difficulty squared.
Cofficients Standard error t Stat P value Lower 95% Upper 95% Intercept 308.4625 84.2117 3.6629 0.00033 142.227 474.698 X Variable 4.75E−21 1.16E−22 40.833 8.69E−90 4.52E−21 4.98E−21
policy introduction, market acceptance, four-year halving mining rules, hard forks and other digital assets, etc.). According to Robert Shillerr, the trend of blockchain digital asset prices is particularly in line with the definition of spe-culative bubbles. People are eager to hold digital assets, hoping to gain wealth through value-added, and blockchain digital asset investment is gradually famil-iar and understood. The most direct response of the news media to the psycho-logical impact of the public can be reflected in the public’s attention to this mat-ter. Therefore, we assume that the news media’s coverage of the blockchain digi-tal asset will attract public attention, which indirectly will cause changes in the price of digital assets in the blockchain.
Public attention is an abstract concept. Fortunately, the search engine pro-vides us with a lot of quantitative information. The representative Google Trend provides search and click popularity data for specific keywords. So we down-loaded Google Trend’s search volume data for the keyword “Bitcoin” (in a weekly cycle, standardized 0 - 100 numerical scale), which indirectly reflects the value of the Bitcoin blockchain network. We selected the bitcoin price from September 21, 2014 to January 7, 2018 to analyze the search volume of Bitcoin. As shown in Figure 3, we can see that the price trend is basically similar to the search volume of Bitcoin, which is generally on the rise.
[image:9.595.208.539.186.236.2]DOI: 10.4236/jss.2019.72016 194 Open Journal of Social Sciences
[image:10.595.207.539.246.338.2]Figure 3. Trends in price and search volume.
Table 4. Regression statistics for price and search.
Regression statistics
Multiple R 0.942552
R Square 0.888404
Adjusted R square 0.887747
Standard error 1104.626
Observations 172
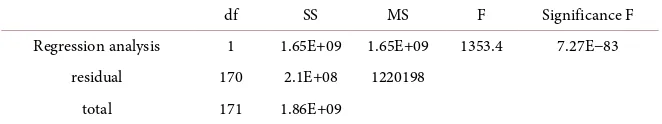
Table 5. Regression statistics for price and search.
df SS MS F Significance F
Regression analysis 1 1.65E+09 1.65E+09 1353.4 7.27E−83
residual 170 2.1E+08 1220198
total 171 1.86E+09
Table 6. Variance regression parameters for price and search volume.
Cofficients Standard error t Stat P value Lower 95% Upper 95% Intercept 76.21922 95.4564 0.7985 0.425711 −112.213’ 246.6516 X Variable 210.2274 5.714584 36.78788 7.27E−83 1.99E+02 221.5081
that the regression coefficient of the search volume is significant, and the search volume has a correlation with the price.
From the above regression analysis, the search volume has a significant linear relationship with the price. Because the amount of search is related to the user, according to Metcalf’s law, the network value is proportional to the square of the number of users participating in the network. We make assumptions to test the regression between the square of the search volume and the price of the bitcoin blockchain network. As shown in Figure 4, the coefficient of R2 = 0.598 is not good for the estimation model. Therefore, the linear relationship between search volume and price is more obvious.
3.3. Multivariate Analysis of Digital Asset Valuation Regression
According to the above single variable analysis, we use the mining difficulty and 0.005,000.00 10,000.00 15,000.00 20,000.00 25,000.00
2014/9/21 2015/9/21 2016/9/21 2017/9/21
0 20 40 60 80 100 120
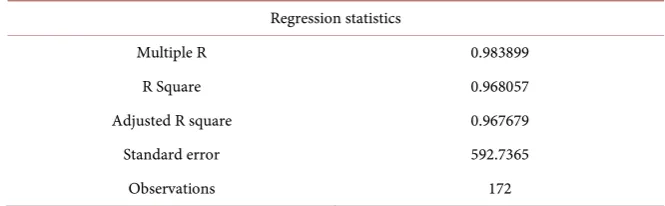
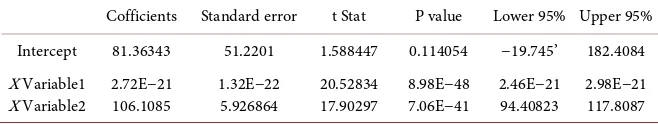
[image:10.595.209.540.372.434.2] [image:10.595.210.539.468.515.2]DOI: 10.4236/jss.2019.72016 195 Open Journal of Social Sciences search volume based on the POW mechanism as the independent variable, the mining difficulty squared and the search volume as the detection factor, and the bitcoin blockchain digital asset price as the dependent variable for multivariate Regression fitting analysis. It can be seen from Table 7 that Multiple R is equal to 0.9839, indicating that the correlation between the independent variable and the dependent variable is high and positively correlated. R Square is equal to 0.9681, and the square of the mining difficulty is highly matched to the price of the search volume. Adjusted R Square has a value equal to 0.9677, indicating that the two independent variables can account for 96.77% of the bitcoin price, and 3.23% is explained by other factors. Table 8 uses Significance F to determine the regression effect of the multivariate regression model. The P value of the analysis is equal to 4.2 × 10−127, which is much smaller than the significance level of 0.05, indicating that the regression effect of the multivariate regression model is more significant. It can be seen from Table 9 that the P value of the square of difficulty in
[image:11.595.206.539.518.621.2]Figure 4. Scatter plot of prices and search volume squared.
Table 7. Multivariate regression statistics.
Regression statistics
Multiple R 0.983899
R Square 0.968057
Adjusted R square 0.967679
Standard error 592.7365
Observations 172
Table 8. Multivariate variance analysis table.
df SS MS F Significance F
Regression analysis 2 1.80E+09 9.0E+08 2560.81 4.20E−127 Residual 169 5937588 351336.5
Total 171 1.86E+09
R² = 0.598
0 5000 10000 15000 20000 25000
[image:11.595.212.542.654.723.2]DOI: 10.4236/jss.2019.72016 196 Open Journal of Social Sciences
Table 9. Multivariate variance analysis table.
Cofficients Standard error t Stat P value Lower 95% Upper 95% Intercept 81.36343 51.2201 1.588447 0.114054 −19.745’ 182.4084 X Variable1
X Variable2 2.72E−21 106.1085 1.32E−22 5.926864 20.52834 17.90297 8.98E−48 7.06E−41 2.46E−21 94.40823 2.98E−21 117.8087
mining calculation is 8.98 × 10−48, and the P value of the search quantity is 7.06 × 10−41 which is much smaller than the significance level of 0.05, indicating that the regression coefficients of the two independent variables are significant.
In summary, we use the mining difficulty x1 and the search volume x2 as the independent variables, and the bitcoin blockchain digital asset price Y as the de-pendent variable to obtain the multivariate regression linear equation, which is:
21 2
1 2
2.72 10 106.1085 81.3634
Y= ∗ − x + ∗x + +µ
We add a random perturbation term μ to the regression equation, where the random disturbance term includes the influence of the neglected factors in the two independent variables of the mining calculation difficulty and the search volume, the observation error influence of the two independent variable obser-vations, and the model relationship setting error, and impact of the effects and other random factors.
4. Conclusions
In summary, for the analysis of blockchain digital asset price estimates, we should combine the “human behavior” and “positivism” methods, first of all, based on the mainstream news media reports to analyze the main basis of the impact of blockchain digital asset prices, including safety events, national poli-cies, market recognition, halving of mining cycles, forks and other digital assets, and then based on the Proof of Work (POW) mechanism, using mining calcula-tion difficulty and keyword search variable. According to the analysis method proposed in the paper, the price of the blockchain digital assets is predicted and judged, and the price trend of the blockchain digital assets is comprehensively analyzed, and rational investment is made.
DOI: 10.4236/jss.2019.72016 197 Open Journal of Social Sciences
Conflicts of Interest
The authors declare no conflicts of interest regarding the publication of this pa-per.
References
[1] Nakamoto, A. (2008) Bitcoin: A Peer-to-Peer Electronic Cash System.
[2] Conrad, C., Custovic, A. and Ghysels, E. (2018) Long- and Short-Term Cryptocur-rency Volatility Components: A GARCH-MIDAS Analysis. Social Science Elec-tronic Publishing.
[3] Hong, K.H. (2017) Bitcoin as an Alternative Investment Vehicle. Information Technology & Management, 18, 265-275.
https://doi.org/10.1007/s10799-016-0264-6
[4] Cocco, L. and Marchesi, M. (2016) Modeling and Simulation of the Economics of Mining in the Bitcoin Market. PLoS ONE, 11, e0164603.
https://doi.org/10.1371/journal.pone.0164603
[5] Jang, H. and Lee, J. (2018) An Empirical Study on Modeling and Prediction of Bit-coin Prices with Bayesian Neural Networks Based on Blockchain Information. IEEE Access, 6, 5427-5437. https://doi.org/10.1109/ACCESS.2017.2779181
[6] Iwamura, M., Kitamura, Y., Matsumoto, T., et al. (2014) Can We Stabilize the Price of a Cryptocurrency? Understanding the Design of Bitcoin and Its Potential to Compete with Central Bank Money. Discussion Paper.
[7] Takaishi, T. (2018) Statistical Properties and Multifractality of Bitcoin. Physica A:
Statistical Mechanics and its Applications, 506, 507-519.
https://doi.org/10.1016/j.physa.2018.04.046
[8] Kristoufek, L. (2018) On Bitcoin Markets (in)Efficiency and its Evolution. Physica A: Statistical Mechanics and its Applications, 503, 257-262.
https://doi.org/10.1016/j.physa.2018.02.161
[9] Vitt, D.C. (2013) Breaking Bitcoin: Does Cryptocurrency Exchange Activity Lead to Increased Real Activity Outside Cryptocurrency Exchanges? SSRN Electronic Jour-nal.
[10] Palamara, E., Zacharias, N., Xanthopoulou, M., et al. (2016) Technology Issues of Byzantine Glazed Pottery from Corinth, Greece. Microchemical Journal, 129, 137-150. https://doi.org/10.1016/j.microc.2016.06.008
[11] Bentov, I., Lee, C., Mizrahi, A., et al. (2014) Proof of Activity: Extending Bitcoin’s Proof of Work via Proof of Stake.
[12] Zhang, R. and Preneel, B. (2017) On the Necessity of a Prescribed Block Validity Consensus: Analyzing Bitcoin Unlimited Mining Protocol. International Confe-rence.
[13] Huberman, G., Leshno, J.D. and Moallemi, C.C. (2017) Monopoly without a Mo-nopolist: An Economic Analysis of the Bitcoin Payment System. Columbia Business School Research Paper No. 17-92. https://doi.org/10.2139/ssrn.3025604
[14] Hornberger, J. and Hirth, R.A. (2012) Financial Implications of Choice of Dialysis Type of the Revised Medicare Payment System: An Economic Analysis. American Journal of Kidney Diseases, 60, 280-287. https://doi.org/10.1053/j.ajkd.2012.03.010 [15] Katsiampa, P. (2017) Volatility Estimation for Bitcoin: A Comparison of GARCH
DOI: 10.4236/jss.2019.72016 198 Open Journal of Social Sciences
and Cryptocurrency Technologies: A Comprehensive Introduction. Princeton Uni-versity Press, Princeton.
[17] Elbahrawy, A., Alessandretti, L., Kandler, A., Pastor-Satorras, R. and Baronchelli, A. (2017) Evolutionary Dynamics of the Cryptocurrency Market. Royal Society Open Science, 4, Article ID: 170623. https://doi.org/10.1098/rsos.170623
[18] Bianchetti, M., Ricci, C. and Scaringi, M. (2018) Are Cryptocurrencies Real Finan-cial Bubbles? Evidence from Quantitative Analyses. SoFinan-cial Science Electronic Pub-lishing, Rochester.
[19] Thrane, C. (2015) On the Relationship between Length of Stay and Total Trip Ex-penditures: A Case Study of Instrumental Variable (IV) Regression Analysis. Tour-ism Economics, 21, 357-367. https://doi.org/10.5367/te.2014.0357
[20] Wang, J., Huang, D., Chang, S.C. and Brant, L. (2013) On-Site Earthquake Early Warning with Multiple Regression Analysis: Featuring Two User-Friendly Applica-tions for Excel. Computers & Geosciences, 58, 1-7.
https://doi.org/10.1016/j.cageo.2013.04.018
[21] Balcilar, M., Demirer, R., Gupta, R. and Wohar, M.E. (2017) Differences of Opinion and Stock Market Volatility: Evidence from a Nonparametric Causality-in-Quantiles Approach. Journal of Economics and Finance, 42, 339-351.
https://doi.org/10.1007/s12197-017-9404-z