ASSESSMENT OF THE GENETIC DIVERSITY AND THE RELATIONSHIP AMONG COMMON BEAN
(
PHASEOLUS VULGARIS
1
Matondo, N.K.,
2Yao, K.N.,
5
Tshilenge, D.K.
1
National Institute for Study and Agronomic Research, Research Centre of Mvuazi,
2
Biosciences eastern and central Africa
3
Department of Biological Sciences, Laurentian University, Su
4
Faculty of Agronomy, .National Teachi
5
Faculty of Agronomy, University of Kinshasa
6
Faculty of Agronomy, University of Lubumbashi, B.P.1825 Lubumbashi, DR
ARTICLE INFO ABSTRACT
The genetic diversity of Common bean accessions from the germplasm of INERA in DR
assessed to understand their phylogeny relationship using SSR molecular markers. A set of 91 accessions, comprising 21 from CIA
Gandajika, were genotyped with 12 SSR markers that generated 89 alleles with an average of 7 alleles per locus. Polymorphism information content (PIC) value was 0.64 indicating a fair diversity with a range of 0.40
as 1% among the populations, 64% within individual and 35% within population. Clustering analysis based on the genetic similarity grouped the 91 Common bean
Information generated from this study can be driven to select parents for breeding or develop hybrid lines for yield increase, high biomass, resistance against abiotic/biotic stresses and segregating populations to
Copyright©2017, Matondo et al.This is an open access article distributed under the Creative Commons Att distribution, and reproduction in any medium, provided the original work is properly cited.
INTRODUCTION
Common bean is one of the four main legume crop cultivated in DR-Congo. The national agricultural production statistics of the decade 1999-2009 indicates that beans occupy the 8 and agricultural production of beans in which Common bean occupy the 1st place of most cultivated beans in DR (SENSA,2009). Common bean is one of the most important food crops in the country, playing important role in the human food and providing more than 45% of proteins consumed (Allen et al., 1996). It constitutes also a source of indispensable nutrients for food of the rural resource poor (Mbikayi, 2007), and for those having a limited access to meat, fish and milk, and being satisfied to food proteins with high
*Corresponding author: Matondo, N.K.,
National Institute for Study and Agronomic Research, Research Centre of Mvuazi, BP. 2037, Kinshasa 1, DR-Congo.
ISSN: 0975-833X
Article History:
Received 27th December, 2016
Received in revised form 21st January, 2017
Accepted 19th February, 2017
Published online 31st March, 2017
Key words:
Genetic diversity,
Single sequence repeats (SSR) markers, Common bean.
Citation: Matondo, N.K., Yao, K.N., Kyalo, M., Skilton, R., Nkongolo, K.K., Mumba, D. et al.
diversity and the relationship among common bean ( markers”, International Journal of Curent Research
RESEARCH ARTICLE
ASSESSMENT OF THE GENETIC DIVERSITY AND THE RELATIONSHIP AMONG COMMON BEAN
L.) ACCESSIONS FROM DR-CONGO GERMPLASM USING
SSR MOLECULAR MARKERS
Yao, K.N.,
2Kyalo, M.,
2Skilton, R.,
3Nkongolo, K.K.,
Tshilenge, D.K. and
6Lubobo, A.K.
National Institute for Study and Agronomic Research, Research Centre of Mvuazi,
Kinshasa 1, DR-Congo
eastern and central Africa - International Livestock Research Institute (BecA
30709, Nairobi 00100, Kenya
Department of Biological Sciences, Laurentian University, Sudbury, Ontario, Canada, P3E 3C6
Faculty of Agronomy, .National Teaching University, BP. 8815
Kinshasa-Faculty of Agronomy, University of Kinshasa, BP. 117 Kinshasa XI, DR
Faculty of Agronomy, University of Lubumbashi, B.P.1825 Lubumbashi, DR
ABSTRACT
The genetic diversity of Common bean accessions from the germplasm of INERA in DR
assessed to understand their phylogeny relationship using SSR molecular markers. A set of 91 accessions, comprising 21 from CIAT/Columbia, 36 from Mvuazi, 30 from Mulungu and 4 from Gandajika, were genotyped with 12 SSR markers that generated 89 alleles with an average of 7 alleles per locus. Polymorphism information content (PIC) value was 0.64 indicating a fair diversity with a range of 0.40-0.82. The average heterozygosity level per locus was 0.24. The variability was as low as 1% among the populations, 64% within individual and 35% within population. Clustering analysis based on the genetic similarity grouped the 91 Common bean genotypes into 2 main distinct clusters. Information generated from this study can be driven to select parents for breeding or develop hybrid lines for yield increase, high biomass, resistance against abiotic/biotic stresses and segregating populations to map genes/QTLs for yield in Common bean in the western DR
is an open access article distributed under the Creative Commons Attribution License, which distribution, and reproduction in any medium, provided the original work is properly cited.
of the four main legume crop cultivated Congo. The national agricultural production statistics of 2009 indicates that beans occupy the 8th rank and agricultural production of beans in which Common bean ltivated beans in DR-Congo (SENSA,2009). Common bean is one of the most important food crops in the country, playing important role in the human food and providing more than 45% of proteins consumed 1996). It constitutes also a source of ispensable nutrients for food of the rural resource poor (Mbikayi, 2007), and for those having a limited access to meat, fish and milk, and being satisfied to food proteins with high
nd Agronomic Research, Research Congo.
biologic quality (Anonyme, 1991). By its substantial content in micro-elements Iron and Zinc, it is one of the bio fortified foods (Harvest Plus, 2009) classified among f
choice to pregnant women, children and vulnerable groups (Mbikayi, 2007) as well as to the HIV/AIDS patients (PABRA/ECABREN/SABRN/CIAT, 2006). It also is one of the most important food crops, as source of incomes to the producers, and because of its ecological diversity. DR presents various potentialities of production, big potentialities in the high altitude zone of the East of the country and as well as of middle potentialities on low altitude of Kongo Central and Katanga (Wortmann et al.,
varieties distributed in the country of 500
(Matondo et al., 2000) is less to the one of 1,500 kg/ha of the three countries of the under-region of Big Lakes of Africa (CPGL), caused by abiotic/biotic factors (Wort
Allen, 1994) of which the weak International Journal of Current Research
Vol. 9, Issue, 03, pp.47814-47821, March, 2017
INTERNATIONAL
OF CURRENT RESEARCH
Matondo, N.K., Yao, K.N., Kyalo, M., Skilton, R., Nkongolo, K.K., Mumba, D. et al. 2017.
p among common bean (phaseolus vulgaris l.) accessions from dr-congo germplasm using ssr molecular
International Journal of Curent Research, 9, (02), 47814-47821.
ASSESSMENT OF THE GENETIC DIVERSITY AND THE RELATIONSHIP AMONG COMMON BEAN
CONGO GERMPLASM USING
Nkongolo, K.K.,
4Mumba, D.,
National Institute for Study and Agronomic Research, Research Centre of Mvuazi, BP. 2037,
International Livestock Research Institute (BecA-ILRI Hub), P.O.Box
dbury, Ontario, Canada, P3E 3C6
-Binza, DR-Congo
, BP. 117 Kinshasa XI, DR-Congo
Faculty of Agronomy, University of Lubumbashi, B.P.1825 Lubumbashi, DR-Congo
The genetic diversity of Common bean accessions from the germplasm of INERA in DR-Congo was assessed to understand their phylogeny relationship using SSR molecular markers. A set of 91 T/Columbia, 36 from Mvuazi, 30 from Mulungu and 4 from Gandajika, were genotyped with 12 SSR markers that generated 89 alleles with an average of 7 alleles per locus. Polymorphism information content (PIC) value was 0.64 indicating a fair diversity with a 0.82. The average heterozygosity level per locus was 0.24. The variability was as low as 1% among the populations, 64% within individual and 35% within population. Clustering analysis genotypes into 2 main distinct clusters. Information generated from this study can be driven to select parents for breeding or develop hybrid lines for yield increase, high biomass, resistance against abiotic/biotic stresses and segregating
for yield in Common bean in the western DR-Congo.
ribution License, which permits unrestricted use,
biologic quality (Anonyme, 1991). By its substantial content in elements Iron and Zinc, it is one of the bio fortified foods (Harvest Plus, 2009) classified among food ofadvisable choice to pregnant women, children and vulnerable groups (Mbikayi, 2007) as well as to the HIV/AIDS patients (PABRA/ECABREN/SABRN/CIAT, 2006). It also is one of the most important food crops, as source of incomes to the se of its ecological diversity. DR-Congo presents various potentialities of production, big potentialities in the high altitude zone of the East of the country and as well as of middle potentialities on low altitude of Kongo Central t al., 1998). The potential of varieties distributed in the country of 500 – 750 kg/ha 2000) is less to the one of 1,500 kg/ha of the region of Big Lakes of Africa (CPGL), caused by abiotic/biotic factors (Wortmann and Allen, 1994) of which the weak- fertility of soil, water deficit INTERNATIONAL JOURNAL
OF CURRENT RESEARCH
2017. “Assessment of the genetic
caused by stress of the present climatic changes, insects pests and illnesses (Allen and Edje, 1990; Allen et al., 1989; Allen et al., 1996; ECABREN, 2000). This weak potential yield is also subjugated by the weak level of improved quality of varieties and the weak acceptability varieties released to the users, by poor technical management and lack of coherent policies of production and merchandising. So, INERA (National Institute for Study and Agronomic Research)(NARS) has various Common bean collection maintained in Mvuazi (Bas-Congo) for low altitude, and Mulungu (Southern Kivu) in the high altitude, and the efforts of its National Grain Legume Program (PNL) is to release interesting varieties in relation with objectives assigned in its classic selection. The diversity of the accessions maintained by INERA still remains apparently little known and not much exploited, however the Common bean benefits from a migratory flux releasing varieties trough the country. To get solution, INERA by its breeding program and others structures (PABRA/CIAT, ECABREN, ASARECA, Consortium CIALCA (Bioversity International, in partnership with IITA and CIAT)) make efforts to introduce new genetic materials for improving agricultural livelihoods, and are working towards development of high-yielding varieties and hybrids with better quality, disease resistance, drought tolerance and agronomic traits (Klein et al. 2008).
Important efforts (breakthrough) are made in developing and releasing common bean varieties for food production and food security, commercial cultivation and guarantee of incomes.
Butto date, there is insufficient data on genetic diversity in Common bean germplasm collections in DR-Congo. A research program aimed to enhance the capacity to use and develop participatory approaches to managing the agricultural biodiversity is being implemented. A more comprehensive assessment of genetic diversity would allow curators and users to manage and access ex situ collections more efficiently. Moreover, the knowledge of the genetic variation within accessions from germplasm collection is essential to the choice of strategy to incorporate useful diversity into the program and to facilitate the introgression of genes of interest into commercial cultivars. It will be also important to understand the evolutionary relations among accessions; to better sample germplasm diversity and to increase conservation efficiency using acquired knowledge (Fu, 2003, Mudibu et al., 2011). The methods for detecting and assessing genetic diversity have extended from analysis of discrete morphological and molecular traits. Several DNA marker systems are now in common use with success in diversity studies of plants, like RAPD (Randomly Amplified Polymorphic DNA), ISSR (Inter Single Sequence repeats), SSR (Simple Sequence Repeat), etc (Nkongolo et al., 2011).
The simple sequence repeat (SSR) markers are useful tools for genetic assessment of variation. Polymorphism generated by SSR assays have been used for assessment of variation germplasm identification and genetic mapping in different species.Many studies have recommended the use of SSR markers in analyses of genetic diversity due to their high degree of polymorphism (Geletaet al., 2006; Ali et al., 2008; Shehzad et al., 2009). They are codominant markers dispersed throughout the genome, and have multiple alleles that often have conserved loci between related species (Brown et al., 1996; Schulman, 2006). Powell et al. (1996) stated that SSRs are able to discriminate among closely related individuals, and have advantage over other markers in their ability to trace pedigrees in plants. Genetic similarity estimates among
genotypes are important in selecting parental combinations for creating segregating populations so as to maintain genetic diversity in a breeding program (Becelaere et al. 2005),to develop mapping populations for detecting quantitative trait loci (QTL) (Varshney, 2011) and to categorize lines into heterotic groups for hybrid crop breeding (Menz et al.,2004). Simple sequence repeats (SSR), also known as microsatellites, are based on tandem repeats of one to six core nucleotide elements, and are multiallelic and codominant and contain considerable genetic variation (Blair et al., 2003; Song et al., 2004; Cabral et al., 2011).Microsatellites are short tandem repeats of DNA, generally distributed throughout the genome of an organism. Microsatellites markers (SSRs) are becoming the markers of choice in plant breeding programs. They are polymerase chain reaction (PCR)-based, codominants, easily reproducible, highly multiallelic and can be genotyped on semi-automated DNA sequences using multiplex assays, allowing for high throughput DNA typing (Buso et al., 2006).
The aim of this study is to assess the genetic variation among the main accessions of the Common bean germplasm maintained by INERA in DR-Congo. To achieve this aim, the study sought to address the following objectives:
To identify the level of existing polymorphism among the principal common bean accessions maintained by INERA;
To evaluate the diversity and the genetic relations of the bean accessions common using molecular markers SSR.
This study is focused on the following assumptions:
Existence of the same level of variation between the morphological and agronomic characteristics with the genetic variability of the common bean accessions maintained by the INERA (RD-Congo),
Existence of several phylogenic groups among the accessions in relation to their morphological and agronomic characteristics, and their origins.
MATERIALS AND METHODS
Germplasm collection
The plant material was constituted by a set of 91 accessions coming from INERA’s research centre of Mvuazi (Kongo Central), selected as: 36 from Mvuazi, 4 from Gandajika, 30 from Mulungu and 21 from CIAT/Columbia. The main accessions targeted the Common bean of various origin (local, exotic, inbred lines) maintained in Mvuazi (Kongo Central), representing the big diversity of accessions and varietiesof INERA. Ten to twenty seeds descended of the progeny of each 91main accessions concerned, harvest during the year, in holds at random, constituted the basis materials for this study.
Preparation of the material
Ten seeds descended of the progeny of each 91 accessions concerned, harvested in holds and at random, were sown in the green house. After ten days, two young leaves were harvested per accession, puled into micro tubes with liquid nitrogen at -80°C (Mudibu et al., 2011a) and stocked in a ultra low temperature freezer until AND extraction operation and analysis.
DNA extraction
The total genomic DNA was extracted from individual young leaves (10 days old). DNA was extracted from leave samples, using the method of ZR Plant/seed DNA MiniPrep, Catalog n°D6020 of The Epigenetics Company (USA). DNA from individual seedlings was extracted to access the level of genetic diversity within each accession. The quantity and purity of the DNA were checked using a Nano Drop spectrophotometer ND 8000 and 0,8 % agarose gel was done as for quality check, and this was also necessary for DNA normalisation.
PCR and SSRassay
Twelve SSR primers, formerly adapted for Common bean (directly labelled from Applied Biosystems), were used for their clear polymorphism patterns random their position in the Common bean genome, screening then narrow down to two markers per chromosome for diversity study. Upon dilution of DNA samples to 20 ng µL-1, a 10µL PCR mix consisting of 20 ng of DNA, 10 X reaction buffer, 2 mM MgCL2, 0.2
mMdNTPs, 2 pmols of forward and reverse primers, O.5 U Taq polymerase was prepared for each genotype.Temperature cycling was carried out using the GeneAmp PCR systems 9700 (PE-Applied Biosystems) using a program with an initial denaturation at 95°C for 3 min followed by 30 cycles at 94°C for 45 s, 58°C for 1 min, and 72°C for 2 min with a final hold at 72°C for 20 min, and 15°C for ∞. Aftrer the PCR, a few accessions in each primer were randomly selected and their PCR products (3 µl) run on agarose (2%) gel electrophoresis stained with gel red (2.5 µl) at a voltage of 100 V for 40 minutes.Genotyping was carried out by capillary electrophoresis using the ABI PRISM 3730 (Applied Biosystems). DNA fragments were denatured and size-fractioned using capillary electrophoresis. The peaks were sized and the alleles called using Gene-Mapper software and the internal GS500 (-250) LIZ standard.
Cluster analyses
SSR that gave consistent profiles across populations were selected. Dissimilarity indices was estimated using allelic data by simple allele matching and cluster analysis based on unweighted neighbor-joining (Gascuel, 1997) was carried using DARwin 5.0 dissimilarity analysis software (Perrier et al., 2003). To ascertain the statistical strength of genetic relationships identified through this analysis, bootstrapping of the data (10,000 permutations) was performed. The total number of alleles detected, the number of common alleles with allelic frequencies of at least 5%, the observed size range (in base pairs; bp), the allele size differences (in bp) and the polymorphism information content (PIC) values (Smith et al., 2000), and frequencies of unique alleles was calculated for each SSR marker using PowerMarker V3.25 (Liu and Muse, 2005).
Data analysis
Faint bands were not recorded for analysis; the alleles were called and scored using the Gene-Mapper version 3.7 software and the data was subjected to Allelobin software to check the quality of the SSR markers. The data generated from Allelobin was analyzed using Power-Marker version 3.25 to calculate the Polymorphic Information Content (PIC), heterozygosity,
number of alleles for each marker, percentage of polymorphic loci estimates, and genetic diversity among the accessions and their genetic distances. Allele and genotype frequencies were scored using haplotype diversity values with PowerMarker version 3.25 (Schenider et al. 2000). Darwin Version 5.0 software was used to calculate the principle coordinate analysis (PoCA) and clustering among the genotypes. To determine the genetic relationships and differentiation; the 91 Common bean accessions were clustered based on the matrix of genetic similarities using the Un-weighted Pair Group Method using the Arithmetic Averages (UPGMA) algorithm. Dissimilarity Index was calculated from allelic data by simple matching. The distances were computed for microsatellite data (11 loci) and trees constructed using the neighbour-joining method with DARwin Version 5.0 software.
The genetic distance between accessions was subjected to sequential agglomerative hierarchical nested (SAHN) with un-weighted, pair-group analysis (UPGMA) using Dice’s indices as provided in DARwin 5.0. Major clusters were generated from Nei (1987) genetic distance matrices. Analysis of molecular variance (AMOVA, Excoffier et al. 1992) was used to partition SSR variation among groups. Significance levels for variance component estimates were computed by a non-parametric permutation procedure using 100 permutations. AMOVA and Fst indices were calculated using the GenAlEx program, version 6.5 (Peakall, R. and Smouse P.E., 2012). Dendrograms was constructed using the neighbour-joining analysis. The method starts with a starlike tree with no hierarchical structure and in a stepwise fashion was find the two operational taxonomic units that minimize the total branch length at each cycle of clustering. The unrooted tree generated by the Neibour joining method was constructed under the principle of minimum evolution. The degree of affinity of similarity based on the data on SSR was be calculated, the significance of the interrelationship was determined.
RESULTS
Marker characterization and allele frequencies
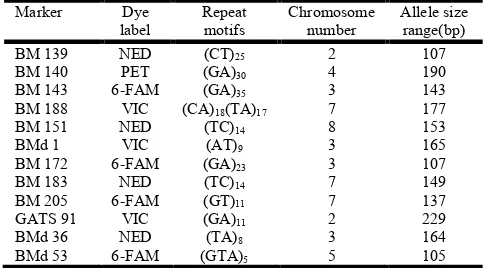
[image:3.595.311.553.617.751.2]The SSRs used in the study represented di nucleotide repeat units. The allele sizes among the genotypes for all the 12 microsatellites varied from 107 to 229bp (Table 1).
Table 1. The 12 SSR markers used in the study, dyes label, repeat motif, chromosome number and allele size range (http://isa.ciat.cgiar.org/molphas/; Cordoba et al., 2010)
Marker Dye
label
Repeat motifs
Chromosome number
Allele size range(bp)
BM 139 NED (CT)25 2 107
BM 140 PET (GA)30 4 190
BM 143 6-FAM (GA)35 3 143
BM 188 VIC (CA)18(TA)17 7 177
BM 151 NED (TC)14 8 153
BMd 1 VIC (AT)9 3 165
BM 172 6-FAM (GA)23 3 107
BM 183 NED (TC)14 7 149
BM 205 6-FAM (GT)11 7 137
GATS 91 VIC (GA)11 2 229
BMd 36 BMd 53
NED 6-FAM
(TA)8
(GTA)5
3 5
164 105
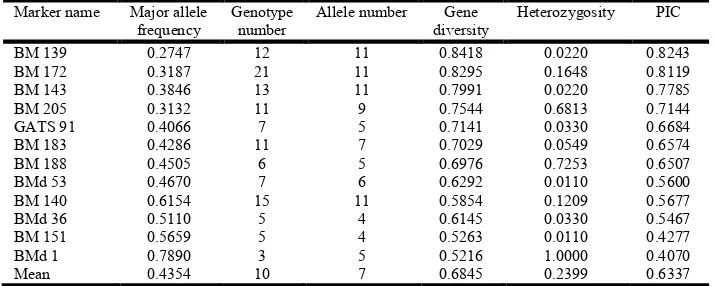
The 12 SSRs revealed a total of 91 alleles with a mean of 7 alleles per marker (Table 2). This was the same average obtained in Common bean accessions of the bean gene bank (Buso et al.,2006; Burle et al., 2010).This was lower than the average of 14 and 10 previously reported in Common bean genepools and in genotypes from the Great Lakes region of Central Africa (Matthew et al., 2012; Matthew et al., 2010) but higher than the average reported fromthree genomic libraries of Phaseolus vulgaris L. (Gaitan-Soils et al., 2002) who reported 6.0 alleles per locus, and also higher than the average of 4 alleles (Cabral et al, 2011) and 2.4 allele per locus reported in Common bean landraces (Khaidizar etal., 2012). The highest number of alleles was 11 in markersBM 139, BM 140, BM 143 and BM 172 with allele size range of between 107-229 base pairs and the lowest number of alleles was two, in markers BM 139 and BM 172 with allele size ranges of 107 base pairs. The PIC value over the 12 SSR markers averaged 0.63, ranging from 0.082 for marker BM 139 to 0.81 for marker BM 172. The mean level of heterozygosity per SSR marker was 0.24. This level of heterozygosity is fairly higher than 0.19 to what was reported by Matthew et al. (2010) (Table 2).
Heterozygosity level ranged from 0.011 for markersBM 151 and BMd 53 to 1.00 for marker BMd 1. Marker BM 139 had the highest gene diversity of 0.84 while marker BMd 1 had the lowest gene diversity of 0.52. The mean gene diversity per SSR marker was 0.68 (Table 2). All the loci were polymorphic with Mvuazi population having the highest number of private alleles (Table 3).
Population structure
There was a clear genetic differentiation among individuals within populations, and within the individuals using significance tests based on 1,000 permutations calculated according to Weir and Cockerham (1984) with the Arlequin software (Table 3). However genetic differentiation among populations was low. The percentage variation among populations was 1% compared to the variation within individuals which was 64%, and that within population was 35%. The FST value was 0.013 indicating negligible genetic
[image:4.595.119.477.81.224.2]differentiation among the population analyzed, and was 0.65 indicating a very great genetic differentiation within individuals and within population analyzed (Table 4).
Table 2. Allele frequency, allele number and diversity indices of 91 Common bean genotypes
Marker name Major allele
frequency
Genotype number
Allele number Gene
diversity
Heterozygosity PIC
BM 139 0.2747 12 11 0.8418 0.0220 0.8243
BM 172 0.3187 21 11 0.8295 0.1648 0.8119
BM 143 0.3846 13 11 0.7991 0.0220 0.7785
BM 205 0.3132 11 9 0.7544 0.6813 0.7144
GATS 91 0.4066 7 5 0.7141 0.0330 0.6684
BM 183 0.4286 11 7 0.7029 0.0549 0.6574
BM 188 0.4505 6 5 0.6976 0.7253 0.6507
BMd 53 0.4670 7 6 0.6292 0.0110 0.5600
BM 140 0.6154 15 11 0.5854 0.1209 0.5677
BMd 36 0.5110 5 4 0.6145 0.0330 0.5467
BM 151 BMd 1
0.5659 0.7890
5 3
4 5
0.5263 0.5216
0.0110 1.0000
0.4277 0.4070
[image:4.595.55.538.256.325.2]Mean 0.4354 10 7 0.6845 0.2399 0.6337
Table 3. Genetic diversity for each Common bean populations
Genetic Diversity
Population Sample size % Polymorphic Loci Private alleles Na(SE) He(SE) Ho(SE)
Mvuazi 37 100 5 5.000(0.628) 0.632(0.033) 0.267(0.109)
Gandajika 4 75 2 2.417(417) 0.441(0.084) 0.333(0.128)
Mulungu 29 100 5 4.833(588) 0.628(0.028) 0.232(0.112)
CIAT/Colu-mbia 21 100 4 4.750(0.509) 0.629(0.028) 0.267(0.103)
Overall mean 23 93.75 4 4.25(0.5353) 0.582(0.04325) 0.275(0.113)
[image:4.595.118.477.372.434.2]He = Expected heterozygosity; Na= No. of different alleles; Ho =Observed heterozygosity; SE= Standard Error
Table 4. AMOVA partitioning SSR variation among populations, within individuals, and within population of 91 Common bean genotypes
Source d.f Sum of squares
(SS)
Variance components (MS)
P-value Percentage of
variation
Fst
Among Population 3 26.966 8.989 0.054 1 0.013
Within Individuals 87 589.534 6.776 2.668 64 0.650
Within Population 91 131.000 1.440 1.440 35 0.654
[image:4.595.160.436.464.517.2]Total 181 747.500 5.735 4.162 100 0.316
Table 5. Genetic distance matrices calculated according to Nei (1987) for the 91 Common bean genotypes
Country or Location CIAT/Columbia Gandajika Mulungu Mvuazi
CIAT/Columbia 0.000
Gandajika 0.162 0.000
Mulungu 0.005 0.225 0.000
Mvuazi 0.060 0.243 0.056 0.000
FST values up to 0.05 indicate negligible genetic differentiation
whereas>0.25 means very great genetic differentiation within the population analyzed.
Genetic diversity within regions
The allele frequency based pair-wise genetic distances between the locations calculated using Power- Marker version 3.25 revealed the relatedness of genotypes on a location by location basis (Table 5). Genotypes from Mulungu and Mvuazi were the most distant whereas genotypes from Gandajika and CIAT/Columbia were the closest genetically.
Cluster analysis
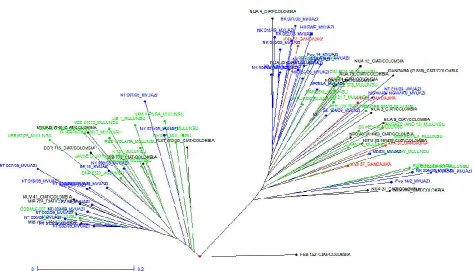
[image:5.595.60.535.334.605.2]The pair-wise dissimilarity indices among the common bean genotypes were estimated using allelic data by simple allele matching followed by cluster analysis using unweighted neighbor-joining algorithm. All the 91 genotypes fell into two (I and II) clusters corresponding mainly to their geographic
Figure 1. Tree diagram (phenogram) of Common bean genotypes used in the study
Figure 1 (bis): Tree diagram (phenogram) of Common bean genotypes used in the study values up to 0.05 indicate negligible genetic differentiation
0.25 means very great genetic differentiation within
wise genetic distances between Marker version 3.25 revealed the relatedness of genotypes on a location by location basis (Table 5). Genotypes from Mulungu and Mvuazi were
tant whereas genotypes from Gandajika and CIAT/Columbia were the closest genetically.
wise dissimilarity indices among the common bean genotypes were estimated using allelic data by simple allele lysis using unweighted joining algorithm. All the 91 genotypes fell into two (I and II) clusters corresponding mainly to their geographic
rigin and pedigree. The biggest cluster, cluster I had 52 genotypes with clusters II having 38 genotypes (fig
Figure 2).
DISCUSSION
With the availability of complete Common bean genomic sequence, simple sequence repeats (SSRs) can be used among the preferred markers of choice for studying genetic diversity Common bean (Kumar et al., 2006; Menz
al., 2005; Shabib et al., 2013; Cordoba
their co-dominance, multi-allelic nature, ease of use and repeatability. The level of allelic diversity observed in the present study was fairly high with SSRs generating 91 alleles. The average number of alleles
in the present study was 7 and was higher to that detected by Gaitan-Soils et al., 2002, Cabral
al., 2012. This could be due to levels of polymorphism of SSR markers, the phenotypic diversity of
Tree diagram (phenogram) of Common bean genotypes used in the study
Figure 1 (bis): Tree diagram (phenogram) of Common bean genotypes used in the study
Mvuazi
rigin and pedigree. The biggest cluster, cluster I had 52 genotypes with clusters II having 38 genotypes (figure 1 and
With the availability of complete Common bean genomic sequence, simple sequence repeats (SSRs) can be used among the preferred markers of choice for studying genetic diversity 2006; Menz et al., 2004; Tams et 2013; Cordoba et al., 2013) owing to allelic nature, ease of use and repeatability. The level of allelic diversity observed in the present study was fairly high with SSRs generating 91 alleles. The average number of alleles revealed per SSR locus detected in the present study was 7 and was higher to that detected by 2002, Cabral et al., 2011 and Khaidizar et 2012. This could be due to levels of polymorphism of SSR markers, the phenotypic diversity of genotypes that is very Tree diagram (phenogram) of Common bean genotypes used in the study
high in the Grates lakes region (Matthew et al., 2010 and the sensitivity of DNA fragment separation systems. The allele number ranged from 4 (BMd 36 and BM 151) to 11 (BM 139; BM 172; BM 143 and BM 140). All the markers were polymorphic and gave multiple alleles in the range from 4 to 11. Marker BM 139 was highly polymorphic compared to other genomic markers. SSRs with di-nucleotide repeats are the most polymorphic marker class followed by tri-, tetra- and penta-repeat units. A direct relationship exists between marker information content and the number of repeat units (Weber 1990; Innan et al., 1997; Schloss et al., 2002).PIC provides an estimate of the discriminatory power of a locus or loci by the number of alleles expressed and the relative frequencies of those alleles. According to PIC values, no markers were slightly informative (PIC<0.25),2 (BM 151 and BM BMd 1) were reasonably informative (0.25<PIC<0.5, mean PIC = 0.42), 10 (BM 139, BM 172, BM 143, BM 205, GATS 91, BM 183, BM 188, BMd 53, BM 140, BMd 36) were highly informative (0.5<PIC>0.75, mean PIC = 0.68). The overall mean of heterozygosity (0.24) is high than 0.19 observed by Matthew et al., 2010. This high heterozygosity may be also a reflection of the high genetic diversity of the accessions and crossing between accessions though seeds are selected. The gene diversity observed in this study (Mean PIC = 0.63) is similar to the diversity value (0.62) reported by Matthew et al. (2010). The average of observed heterozygosity (0,17) was also high than the one observed by Matthew et al. (2010), reflecting the conditions under the accessions were multiplied and their origin.The SSR loci BM 139, BM 172, BM 143, BM 140 and BM 205were rich in allelic diversity exhibiting (9-11) alleles with highest PIC of 0.82. These primers could be of great use in DNA fingerprinting to characterize Common genetic stocks in view of the emerging needs for
Distinctiveness, Uniformity and Stability (DUS) characterization and plant varietal registration, and SSRs are ideal for gene mapping and highly efficient for linkage studies, variety protection, market-assisted selection, studies of diversity, etc (Song et al., 2004; Leal et al., 2010; Cabral et al., 2011).
Conclusion
This study identified a high level of genetic diversity in the accessions. The diversity is valuable considering the high level of Common bean production in the region, which, compared to other regions of the world, and is among the most concentrated and vitally important to its inhabitants. Common bean is an agriculturally complex crop in DR-Congo. It is a source of diversity for breeding programs that may be preserved and prioritized for the crop improvement. This study showed the importance of Common bean SSR markers in the understanding similarities and affiliations among the set of 91 genotypes of Common bean. Based on the above results, the genetic diversity at genetic level exists in Common bean collection. So, pairs of genotypes was identified and can be used to select parents for breeding program to maximize Common bean yield or resistance to abiotic/biotic factors for development of segregating populations in Common bean.
Acknowledgement
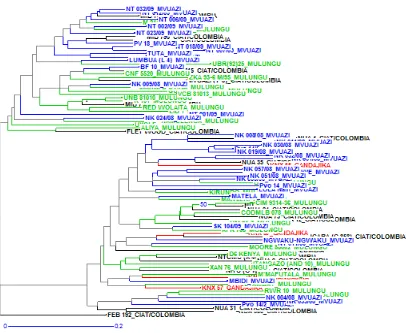
[image:6.595.104.510.53.386.2]We are very grateful to BecA-ILRI Huband ASARECA for awarding us an African Biosciences Challenge Fund Fellowship (ABCF) and the technical support of the BecA-ILRI Hub team that enabled us to conduct this research. We extend special thanks to Dr. R. Skilton from Biosciences eastern and central Africa (BecA-ILRI Hub) for guidance. Figure 2. Dendrogram representation of Common bean genotypes used in the study
REFERENCES
Ali, M.L., Rajewski, J.F., Baenziger, P.S., Gill, K.S., Eskridge, K.M., Dweikat, I 2008. Assessment of genetic diversity and relationship among a collection of US sweet sorghum germplasm by SSR markers. MolecularBreeding, v.21, p.497-509.
Allen, D.J. and Edje, O.T. 1990: Common bean in African farming systems. In Smithson, J.B. (ed.). Progress in improvement of common bean in eastern and southern Africa: CIAT African Workshop Series.N° 12, Dar es Salaam, Tanzanie, pp. 20-32.
Allen, D.J., Ampofo, J.K.O. et Wortmann, C.S., 1996. Ravageurs, maladies et carences nutritives du haricot commun en Afrique : guide pratique. CIAT, Cali, Colombie. CTA, Wageningen, Pays-Bas, 132 p.
Allen, D.J., Dessert, M., Trutmann, P. and Voss, J., 1989: Common bean in Africa and their constraints. In Schwartz, H.P. and Pastor-Corrales, M.A. (eds.). Bean production problems in the tropics, 2d edition. CIAT, Cali, Colombie, p. 9-31.
Anonyme, 1991. Plan Directeur de la Recherche Agronomique au Zaïre (PDRA). Ministère de l’Enseignement Supérieur, Universitaire et de la Recherche Scientifique, Kinshasa, RD. Congo, 117 p.
Becelaere, G.V., Edward, L.L., Paterson, A.H., Chee, P.W. 2005. Pedigree-vs. DNA marker-based genetic similarity estimates in Cotton. Crop Sci. 45: 2281-2287.
Blair, M. W., Laura, F.G, Kimani, P.M., Butare, L. 2010. Genetic diversity, inter-gene pool introgression and nutritional quality of Common beans (Phaseolus vulgaris L.) from Central Africa. Theor. Appl. Genet.121: 237-248. Blair, M.W., Pedraza, F., Buendia, H., Gaitan-Soils, E.,
Breebe, S., Gepts, P., Tohme, J. 2003. Development of a genome-wide anchored microsatellite map for common bean (Phaseolus vulgaris L.). Theor. Appl. Genet. 107: 1362-1374.
Blair, M.W., Soler, A., Cortés, A.J. 2012. Diversification and population structure in common beans (Phaseolus vulgaris L.). PLOS One/www.plosone.org November 2012, volume 7, issue 11, 12 p.
Brown, S.M., Hopkins, M.S., Mitchell, S.E., Senior, M.L., Wang, T.Y., Duncan, R.R., Gonzalez-Candelas, F., Kresovich, S. 1996. Multiple methods for the identification of polymorphic simple sequence repeats (SSRs) in sorghum [Sorghum bicolor (L.)Moench.]Theor. Appl. Genet. 93: 190-198.
Burle, M.L., Fonseca, J.R., Kami, J.A., Gepts, P. 2010. Microsatellite diversity and genetic structure among common bean (Phaseolus vulgaris L.) landraces, a secondary center of diversity. Theor. Appl. Genet 121: 801-813.
Buso, G.S.C., Amaral, Z.P.S., Brondani, R.P.V..and Ferreira M.E. 2006. Primer note: Microsatellite markers for common bean Phaseolus vulgaris. Molecular Ecology Notes 6: 252-254.
Cabral, P.D.S., Soares, T.C.B., Lima, A.B.P., de Miranda F.D., Souza F.B. and Gonçalves L.S.A. 2011. Genetic diversity in local and commercial dry bean (Phaseolus vulgaris) accessions based on microsatellite markers. Genetics and Molecular research 10 (1): 140-149.
Cordoba, J.M., Chavarro, C., Rojas, F., Munoz, C. and Mattew, W.B. 2013. Identification and mapping of simple sequence repeat markers from common bean (Phaseolus vulgaris L.) bacterial artificial chromosome and sequences
for genome characterization and genetic-physical map integration. The Plant Genome, November 2010, vol. 3, n° 3: 154-165.
Cordoba, J.M., Chavarro, M.C., Rojas, F., Munoz, C., Blair, M.W. 2010. Identification of BAC-end SSR markers from common bean (Phaseolus vulgaris L.) and use in integrated genetic and physical mapping. The Plant Genome, 3, 154-165.
ECABREN (Eastern and Central Africa Bean Research Network), 2000 : Initial research framework adopted by ECABREN planning meeting, 20-22 march 2000, Nairobi, Kenya, Draft, unpublished.
Excoffier, L., Smouse, P.E., Quattro, J.M. 1992. Analysis of molecular variance inferred from metric distances among DNA haplotypes: Application to human mitochondrial DNA data. Genetics 131: 479-491.
Fu, Y.B., 2003. Applications of bulking in molecular characterization of plant germplasm: a critical review. Plant Gen. Ress., 1, pp. 161-167.
Gaitan-Soils E., Duque MC., Edwards KJ. and Tohme J. et al., 2002. Microsatellite repeats in common bean (Phaseolus vulgaris): Isolation, characterization, and cross-species application in Phaseolus ssp. Crop Sci. 42: 2128-2136. Gascuel, O. 1997. Concerning the NJ algorithm and its
unweighted version, UNJ.In : Mathematical Hierachics and Biology. DIMACS workshop, Series in Discrete Mathematics and Theoretical Computer Science. Am. Mathematical Soc. 37 : 149-170.
Geleta, N., Labuschagne, M.T., Viljoen, C.D. 2006. Genetic diversity analysis in sorghum germplasm as estimated by AFLP, SSR and morpho-agronomical markers. Biodiversity and Conservation, v.15, p.3251-3265, 2006. Harvest Plus, 2009. Améliorer les cultures pour une meilleure
alimentation : L’agriculture, un outil pour améliorer l’alimentation de l’homme. Note d’information, Avril, 2009, HarvestPlus C/o IFPRI, Washington, DC, 4 p. http//isa.ciat.cgiar.org/molphas/
Innan, H., Terauchi, R., Miyashita, T. 1997. Microsatellite polymorphism in natural populations of the wild plant Arabidopsis thaliana. Genetics 146:1441–1452.
Khaidizar, M.I., Haliloglu, K., Elkoca, E., Aydin, M., Kaniar, F. 2012. Genetic diversity of common bean (Phaseolus vulgaris L.) landraces grown in northeast Anatolia of Turkey assessed with simple sequence repeat markers. Turkish Journal of Field Crops, 17 (2): 145-150.
Klein, R.R., Mullet, J.E., Jordan, D.R., Miller, F.R., Rooney, W.L., Menz, M.A., Franks, C.D., Klein, P.E. 2008. The effect of tropical sorghum conversion and inbred development on genome diversity as revealed by high-resolution genotyping. Plant Genome, 1: 12-26.
Kumar, A.A., Reddy, B.V.S., Sharma, H.C., Hash, C.T., Srinivasa Rao, P., Ramaiah, B., Sanjana Reddy, P. 2011. Recent advances in sorghum genetic enhancement research at ICRISAT. Am. J. Plant Sci., 2: 589-600.
Leal, A.A., Mangolin, C.A., do Amaral, A.T.J., Goncalves, L.S., et al. 2010. Efficiency of RAPD versus SSR markers for determining genetic diversity among popcorn lines. Genet. Mol. Res. 9:9-18.
Liu, K., Muse, S.V. 2005. PowerMarker: An integrated analysis environment for genetic marker analysis. Bioinformatics, 21:2128-2129.
au Réseau ECABREN/ASSARECA, INERA, MVUAZI, unpublished.
Mbikayi, N. 2007. Catalogue de diffusion des variétés de haricot commun. INERA, Mulungu, 36 p.
Menz, M.A., Klein, R.R., Unruh, N.C., Rooney, W.L., Klein, P.E., Mullet, J.E. 2004. Genetic diversity of public inbreds of sorghum determined by mapped AFLP and SSR markers. Crop Sci. 44: 1236-1244.
Mudibu, J., Nkongolo, K.K.C., Mehes-Smith, M. and Kalonji-Mbuyi, A., 2011a. Genetic analysis of a soybean genetic pool using ISSR marker: effect of gamma radiation on genetic variability. International Journal of Plant Breeding and Genetics, 1-11.
Nei, M. 1987. Molecular Evolutionary Genetics, Columbia University Press, New York
Nkongolo, K.K., Mbuya, K.,Mehes-Smith, M. and Kalonji-Mbuyi, A., 2011: Molecular analysis of quality protein (QPM) and normal maize varieties from the DR-Congo breeding program. AfricanJournal of Biotechnology, Vol. 10(65), pp.14293-14301, AcademicJournals.
PABRA/ECABREN/SABRN/CIAT, 2006. Des haricots de meilleure qualité pour l’Afrique. Note d’information générale, PABRA (Alliance panafricaine de recherche sur le haricot), Kampala, Uganda, 8 p.
Paterson, A.H., Bowers, J.E., Bruggmann, R., Dubchak, I., Grimwood, J. et al., (Provide Complete Name), 2009. The Sorghum bicolor genome and the diversification of grasses. Nature, 457: 551-556.
Peakall, R. and Smouse, P.E. 2012. Gen ALEx 6.5: genetic analysis in Excel. Population genetic software for teaching and research-an update.
Perrier, X, Flori, A, Bonnot, F. 2003. Data analysis methods.InGenetic Diversity of Cultivated Tropical Plants (eds. Hamon P, Seguin M, Perrier X, Glaszmann JC), pp. 43-76. Science Publishers, Enfield, Montpellier.
Powell, W.W., Machery, G.C., Provan, J. 1996. Polymorphism revealed by simple sequence repeats. Trends Gen. 1:76-83. Schloss, S.J., Mitchell, S.E., White, G.M., Kukatla, R., Bowers, J.E., Paterson, A.H., Kresovich, S.(2002). Characterization of RFLP probe sequences for gene discovery and SSR development in Sorghum bicolor (L.) Moench. Theoretical and Applied Genetics, v.105, p.912-920, 2002.
Schneider, S., Roessli, D., Excoffier, L. 2000. A software for population genetics data analysis, Arlequin ver. 2000 User Manual, Genetics and Biometry Lab, Dept. of Anthropology, University of Geneva, Geneva.
Schulman, A.H. 2006. Molecular markers to assess genetic diversity. Euphytica: DOI10.1007/s10681-006-9282-5. SENSA, 2009. Evolution de la production agricole en RD.
Congo.C.\Documents and Settings\SNSA\Mes documents Division des Enquêtes\Statistiques de la production (1990-2009). xls. Ministère de l’agriculture et du développement rural, Kinshasa, RDC.
Shabib, J.M., Shahata, A.I., Al-Hazzani, AA. And Al-rumalh M. 2013. Assessment the genetic diversity of common bean Phaseolus vulgaris collection by microsatellite SSR markers. Afr. J; Agric. Res. Vol 8 (40), pp. 5032-5046. Shehzad, T., Okuizumi, H., Kawase, M., Okuno, K. 2009.
Development of SSR based sorghum (Sorghum bicolor (L.) Moench) diversity research set of germplasm and its evaluation by morphological traits. Genetic Resources and Crop Evolution, V.56, p. 809-827.
Smith, C.W., Frederiksen, R.A. 2000. Sorghum: origin, history, technology and production. Wiley, New York. Preface, pp vii–ix.
Song, Q.J., Marek, L.F., Shoemaker, R.C., Lark, K.G., et al. 2004. A new integrated gnetic linkage map of the soybean. Theor. Appl. Genet. 109:122-128.
Tams, S.H., Melchinger, A.E., Bauer, E. 2005. Genetic similarity among European winter triticale elite germplasms assessed with AFLP and comparisons with SSR and pedigree data. Plant Breed. 124:154-160.
Varshney, R.K. 2011. Application of next generation sequencing and genotyping technologies to develop large-scale genomic resources in SAT legume crops. In: Muralidharan K and Siddiq EA (eds.). Genomics and crop improvement: Relevance and Reservations. Institute of Biotechonology, Acharya NG Ranga Agricultural University, Rajendranagar, Hyderabad 500030, India. Weber, J.L. 1990. Informativeness of human (dC-dA)n
(dG-dT)n polymorphisms. Genomics, 7: 524-530.
Weir, B.S., Cockerham, C.C. 1984. Estimating F-statistics for the analysis of population structure. Evolution 3 8:1358-1370.
Wortmann, C.S. and Allen, D.J., 1994: African bean production environments: Their definition, characteristics and constraints. CIAT AfricanOccasionnal Publication Series, n° 11, Dar es Salam, Tanzanie, 47 p.
Wotmann, C.S., Kirkby, R.A., Eledu, C.A., Allen, D.J. 1998. Atlas of common bean (Phaseolus vulgaris L.) production in Africa.CIAT Pan-African Bean Research Alliance. www.zymoresearch.com
47821 Matondo et al. Assessment of the genetic diversity and the relationship among common bean (phaseolus vulgaris l.) accessions from dr-congo germplasm using ssr molecular markers