An Analysis of the Effects of Operating
Margin and Beta for Performance on
Ford Motor Company
Wong, Mei Kait
Universiti Utara Malaysia
18 November 2019
An Analysis of the Effects of Operating Margin and Beta for Performance on Ford Motor Company
Wong Mei Kait
Universiti Utara Malaysia
ABSTRACT
The aim of this study to conduct the general performance of Ford Motor Company where it can be affected by internal factors and external factors attributable to corporate governance failure and inefficient management. This paper aim to investigate the relationship between the determinant variable which is Return on Assets (ROA) and the external variables which are internal factors (operational ratio, quick ratio, operating margin, average-collection period, current ratio, corporate governance index, debt to income) and external factors (exchange rate, unemployment rate, interest rate, gross domestic product (GDP), beta, inflation) on and how they influenced ROA of Ford Motor Company from 2014 to 2018. The findings and analysis show that the internal factors (operating margin) and the external factors (Beta or also known as market risk) were positively significant to the ROA and influenced ROA the most.
Keywords: Return on Assets (ROA), operating margin, Corporate Governance, Beta, Market
Source: [1] Encyclopaedia Britannica, 1998; https://www.britannica.com/topic/Ford-Motor-Company [2] Car Sales Statistics, 2019; https://www.best-selling-cars.com/usa/2018-full-year-usa-ford-sales-americas-favorite-car-brand/
[3] Reuters, 2019; https://www.reuters.com/article/us-ford-electric/ford-makes-big-electric-push-in-europe-with-new-launches-idUSKCN1VV1CZ
1.0INTRODUCTION
1.1Background of the Company
Ford Motor Company is an internationally based company headquartered in Dearborn, Michigan with about 199,000 employees. Ford Motor Company produces, designs, operates and markets a full range of Ford cars, electrified vehicles, sports utility vehicles (SUVs), luxury vehicles and trucks through Ford Motor Credit Company LLC (Ford Credit), and pursues leadership positions in electrification, autonomous vehicles, and mobility solutions.
Ford Motor Company is an American multinational automaker that was founded on June 16, 1903, by Henry Ford and 11 associate investors. The main headquarters of the company are in Dearborn, Michigan, a suburb of Detroit. The company manufactures automotive parts and accessories, tractors, trucks and a passenger car.[1]
America’s best-selling vehicle for the 42nd year is the Ford F-Series. In 2018,
Ford F-Series sold with a record of 10 months straight above 70,000 pickups. They sold 909,330 trucks in 2018 and had record transaction prices in 2018 on demand for high-series pickups.[2]
Source: [4] The New York Times, 2019; https://www.nytimes.com/2019/02/21/business/ford-emissions.html
1.2Scandal of Company
Employees of Ford Motor Company reported possible flaws with the company’s
computer models and therefore, Ford is exploring the fuel efficiency and emissions data of its vehicles. Ford Motor Company had reported to the Environmental Protection Agency regarding the cases and they hired a law firm to evaluate specifications it used in the trial. Due to the company disclose inaccurate data to regulators or customers, the investigation had not indicated as it did not require
software or hardware known as “defeat devices” that are designed to cheat on
emissions tests. Through these incidents, Ford Motor Company did not show accountability in this incident as they did not disclose the correct results to the outsider and, they increase their operational risk as this is case arises from deficient internal processes, people and systems. Few employees show concerns about the computations used in examine cars for emissions certifications and fuel economy ratings in September. Ford had recognized potential issues with its computations and was assessing vehicles in a statement beginning with the 2019 Ranger, a pickup truck. Ford runs into problems in the past for dramatizing the fuel efficiency of its vehicles. Gas mileage ratings are lowered on few hybrid cars by one to seven miles
per gallon in 2013 and 2014. Therefore, the E.P.A. stated that Ford’s “investigation
is ongoing and the information too incomplete” for them to conclude. The agency
said that they will take the potential problems solemnly and followed up with the company to thoroughly understand the conditions behind this news.[4]
1.3Corporate Governance
1.3.1 Openness, Honesty, and Transparency
Ford Motor Company has the concept of openness, honesty, and transparency. Openness is a willingness that will provide financial information to individuals and groups. Honesty is important in a company as it is a sign that shareholders and investors believe that the company's statement is a true statement by the Board of Directors (BOD) and transparency allows the outsider to observe and analyze the company and its actions in a meaningful way. As a benchmark to observers, Ford Motor Company discloses enough information in financial and non-financial aspects. We used both GAAP (Generally Accepted Accounting Principles) and GAAP accounting measures to make operating and financial decisions. The non-GAAP financial metrics provide a useful perspective on the underlying business performance and patterns, as well as a way of measuring our operations over a period to help investors better understand the financial results of Ford Motor Company.
1.3.2 Independence
The second concept is independence which means when someone is free from the influence of others. Ford Motor Company is required to consist of at least three directors under audit committee and each of them must be independent as they have no material connection with the company and encounter the necessity for
“independence” under the rules of the New York Stock Exchange and any other applicable legal or regulatory requirement. Furthermore, Ford Motor Company is a family business, therefore, William Clay Ford, Jr took few posts in the company which is the Director, Executive Chairman, Chairman of the Board, Chair of the Office of the Chairman and Chief Executive, and Chair of the Finance Committee and James P. Hackett is the President and the Chief Executive Officer (CEO). Due to duality in a corporate which might lead to having a conflict of interest among them.
1.3.3 Accountability
focus on guiding the organization to perform its strategic plan while the president is focused on leading the board.
1.3.4 Responsibility
Responsibility is another key matter in Corporate Governance when determining who should take the responsibility, whether the directors should be responsible for their performance to the stakeholders, and their shareholders. The
Board of Directors’ appointment and governance committee is responsible for
evaluating any application from any director or executive officer for a waiver under the code of ethics of Ford Motor Company.
1.3.5 Fairness
Then, fairness is the concept that all shareholders should be given identical consideration. Ford Motor Company is subject to share-based compensation where the compensation of their executives is related to success against established indicators that are consistent with their strategic goal of promoting and concentrating executive actions on improving financial performance and enhancing their company over the long term.
1.3.6 Reputation
As an individual, a company or business will be widely known for its reputation. Ford Motor Company has a good reputation as they are influenced by ethics code, corporate social responsibility (CSR) and staff fairness.
1.3.7 Social Responsibility
1.4Problem Statement
Corporate governance is a framework of rules, relationships, and systems by which the company is directed and controlled. Corporate governance in a company is very important as good corporate governance maintains investors’ confidence which will raise the company capital efficiently and effectively. Hence, a positive impact on the share price. Furthermore, good corporate governance ensures that the company organization is managed in a manner that fits the best interests. Therefore, this research is important as it will determine how significant is the company internal factor and external factor that will affect the Return on Assets of Ford Motor Company.
1.5Research Objective
The study aim to determine the determinants that will affect the Return on Assets of Ford Motor Company. The objectives of this study are:
1. To determine the internal factors that influence the Return on Assets of Ford
Motor Company from 2014 to 2018.
2. To determine the external factors that influence the Return on Assets of Ford
Motor Company from 2014 to 2018.
3. To determine the internal and external factors that influence the Return on Assets of Ford Motor Company from 2014 to 2018.
1.6Research Question
1. What are the internal factors that influence the Return on Assets of Ford Motor Company from 2014 to 2018?
2. What are the external factors that influence the Return on Assets of Ford Motor Company from 2014 to 2018?
2.0LITERATURE REVIEW
In this literature review, the goals from this study observe the secondary records which may be obtained from articles, news, books, journals, and other relevant sources. This part evaluates related literature in the areas of general concept, definition, importance, and methods of various elements like corporate governance, company performance and risk (operation risk, market risk, liquidity risk, and credit risk).
2.1Corporate Governance
Corporate governance consists of systems of rules where a company is being controlled and directed. Corporate governance is defined as a mechanism where it controls management operations with a set of a system of laws and rules. Corporate governance can be divided into external and internal corporate governance mechanisms where internal deals with the accomplishment of processes in the company and external mechanism and control structures resulting from legal regulations and requirements of the financial institutions and markets. 21 different corporate governance codes have been issued by 14 transnational institutions at the end of 2014, and 91 countries had issued and revised national corporate governance codes, mostly in Europe. These different corporate governance codes vary considerably in their coverage, scope, and enforcement due to dissimilarity in the institutional setting. (Eisenschmidt, K., & Vanini, U., 2019)
According to Millstein, 1993, suggested that corporate governance is the mechanism where the manager’s control is under monitored and held fairly to enhance more corporate profit and shareholder gain. (Marie L’Huillier, B., 2014)
According to Rafael La Porta, 2000, the existing corporate governance arrangements have benefited both politicians and reinforced economic interests, including families running the largest companies in most countries around the world, as financial markets need some protection from outside investors such as courts, government agencies or market participants. (La Porta, R., Lopez-de-Silanes, F., Shleifei, A., & Vishny, R., 2000)
removing the Chairman and the CEO and relying on the smaller boards. On the other hand, limiting the number of other boards on which a member of the board can serve and imposing mandatory retirement ages, or limiting the term can also improve a company's corporate governance. (Core, J. E., Holthausen, R. W., & Larcker, D. F., 1999)
2.2Company Performances
According to Ata Ghalem, 2016, performance is like the act or process of performing a task or an action and how well or badly that it has been done. (GHALEM, Â., Chafik, O. K. A. R., CHROQUI, R., & EL ALAMI, S. E. M. M. A.)
Ford is still wedded to a limited version of the connection between individual motivation, work organization, and organizational performance. The technical innovations in Ford are not even unique or unprecedented. In 1908, the ramping up of production volumes and the launching of Model T started Ford’s market supremacy and unequaled profitability for more than 10 years. (Wilson, J. M., & McKinlay, A., 2010)
Due to the recall of Firestone tires and the associated Explorer accidents, Ford Motor Company lost significant market value. These capital market losses exceed anything that could be described in direct costs and this result shows that the additional capitalization losses are almost similar and can be described by factoring in and adding to the direct costs estimates of the nearly worst future litigation costs, loss of reputation and regulatory compliance costs. (Govindaraj, S., Jaggi, B., & Lin, B., 2004)
Source: [5] Panmore Institute, 2017; http://panmore.com/ford-motor-company-swot-analysis
[6] Investopedia, 2019; https://www.investopedia.com/financial-edge/0512/how-inflation-has-affected-the-price-of-cars.aspx
development and market penetration, Ford Motor Company could grow. By expanding its supply chain to reach superior economies of scale and lower production costs, Ford can also enhance its financial position. Opponents like Toyota and General Motors which take part in aggressive marketing and innovation also consider as a big threat towards Ford as well as Google and Apple in technology as their effort of making driverless cars that could challenge against Ford's product. Christine Rowland suggested that Ford should increase its investment in research and development and expand its speed of innovation to address aggressive competition and the entry of high-tech companies into the industry. Finally, Ford also needs to expand its production network in order to expand economies of scale where it can reduce the costs and prices that make Ford cars more attractive.[5]
According to Greg Mcfarlane, 2019, Henry Ford accomplishes business everlastingness by establishing the car and putting the model T as his signature since it can be outreach by ordinary people. In 1909, Model T is just sold for $850 and
the car industry isn’t static. Small-scale fuel consumption cars became more famous throughout North America since, during the 60s and early 70s, they sell at unprecedented prices with a historic oil crisis at loaded pitch and gas. But cars have gotten corresponding more costly over the years as Model T was sold for $850 during the pre-First World War era and in the year 2012, by applying Consumer Price Index (CPI) to modify the dollar value, the price of Model T has changed to $22,000. With the rise of effectiveness, the synthesis of low-price and more long-lasting materials, and economies of scale as well as the real price of economy cars ought to decrease with time. [6]
Source: [7] Bloomberg, 2019; https://www.bloomberg.com/news/articles/2019-01-14/unhappy-with-ford-s-performance-ceo-looks-to-rival-for-relief
[8] The Guardian, 2019; https://www.theguardian.com/business/2019/jun/27/ford-to-cut-12000-jobs-in-europe-amid-struggling-car-market
[9] Reuters, 2019; https://www.reuters.com/article/us-ford-investors/ford-says-2017-performance-will-fall-from-2016-levels-as-costs-rise-idUSKCN11K1D0
leaving Europe as General Motor Co. did in 2017 when it sold its Opel and Vauxhall units to the PSA Group in France.[7]
According to Jasper Jolly, 2019, Ford is planning to cut almost one in four of the Global workforces of the car group across Europe as it tries to turn around the struggling business expected to fall this year in a European car market for the first time in six years. By the end of 2020, the plan would close 6 of Ford's 24 European plants, and they will also shut their British headquarters in Warley, Essex. Ford has said that for the full year 2019, its financial performance would be significantly higher as it cuts costs. Stuart Rowley, president of Ford's European operations, says Ford will be a more targeted business in Europe, consistent with the global redesign of the company, generating higher returns by focusing on customer needs and a lean structure. Cost-cutting would allow the company to invest in its commercial vehicles and target more electrified vehicles and utility vehicles.[8]
According to Bernie Woodall and David Shepardson, 2016, the financial performances of Ford Motor Co's in 2017, will collapse as it continues to expand
the spending on “emerging opportunities” for example like self-driving cars and so on. Limited production of all the industry will abandon U.S. factories and go to low-cost Mexico over the next two to three years as Ford stock dropped to $12.14 by 1.9 percent. We plan to achieve cost efficiencies on average of $3 billion annually between 2016 and 2018 to improve Ford's company and plan to add a new process such as zero-based budgeting, for example. Automotive income was 4.9 billion in 2016. Instead, in 2018, it will grow to 5.6% and fall after 2018. The bulk of the capital allocation will be allocated to investors and for the production of vehicles.[9]
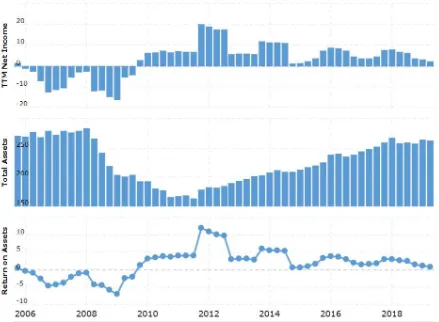
The Return on Assets (ROA) compute the profit per dollar of assets and can be interpreted as an indicator of how profitable a company is relative to its total asset and gives the manager, investor, or analyst to know how effective a company’s management is at using its assets to generate earnings. Figure 1 shows the ROA of Ford Motor Company from the year 2006 to the year 2019. At the beginning of the year 2006 to the year 2009, the ROA shows declined which is bad for the company as it shows the company is not making sufficient income from the use of its assets. From the year 2009 to the year 2012, the ROA increases rapidly which shows the
2019, the ROA goes slightly up and down which shows stability throughout the year.
Return of Assets (ROA) = 𝑁𝑒𝑡 𝐼𝑛𝑐𝑜𝑚𝑒
𝑇𝑜𝑡𝑎𝑙 𝐴𝑠𝑠𝑒𝑡𝑠
[image:12.595.79.518.152.474.2]Source: Macrotrends; https://www.macrotrends.net/stocks/charts/F/ford-motor/roa
Figure 1 shows the Return on Assets (ROA) of Ford Motor Company from the year 2006 to the year 2019.
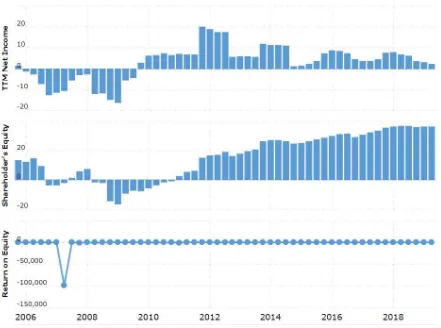
The Return of Equity (ROE) compute how the stockholders fared during the years as advantages to the shareholders is our target. ROE measures for every dollar in equity and determines a corporation’s profitability by disclosing how much payback a company generates with the money shareholders have funded. ROE can also be known as the sum of net income returned as a percentage of shareholders’ equity. Figure 2 shows the ROE of Ford Motor Company from the year 2006 to the year 2019. At the beginning of the year 2006 to the year 2019 it shows almost constant ROE except during the year 2007 which shows a drastic decline. This declined in the year 2007 shows that the company at that time is not generating
Return of Equity (ROE) = 𝑁𝑒𝑡 𝐼𝑛𝑐𝑜𝑚𝑒
𝑇𝑜𝑡𝑎𝑙 𝐸𝑞𝑢𝑖𝑡𝑦
[image:13.595.80.521.112.440.2]Source: Macrotrends; https://www.macrotrends.net/stocks/charts/F/ford-motor/roe
Figure 2 shows the Return on Equity (ROE) of Ford Motor Company from the year 2006 to the year 2019.
2.3Risk
2.3.1 Operational Risk
Operational risk events can happen in any place not merely just in business. Business risk of loss due to deficient internal processes, systems, people, or even from the external events is called operational risk. (Coleman, R., 2010)
Source: [10] Investopedia, 2019; https://www.investopedia.com/terms/o/operational_risk.asp
[11] Simplicable, 2019; https://simplicable.com/new/operational-risk
One of the problematic risks when applied to institutions is called operational risks like staff and systems are also considered as a loss as it includes all forms of the potential damage to a company. Due to insufficient of consciousness among managers and lack of appreciation of the issue that appear in the course of day-to-day operations, the companies will face severe problems in seeking to pinpoint the operational risk and in the requirement to adapt to external events. In other words, Wahlstrom, 2006 stated that expansion of skills in a company can lower the human errors that cause operational risk. (Hemrit, W., & Arab, M. B., 2012)
According to Troy Segal, operational risk sums up the potential risks and hazard of a company's encounter when it struggles to do its day-to-day business operations within a given field or industry. Operational risk can also be defined as a human hazard of business transactions that fail because of human error.[10]
According to John Spacey, 2015, operational risk is the chance of a loss due to the day-to-day operations of an organization. First examples of operational risk are human error where human tends to make some mistakes which affect the company. Information technology where it might face some technical problems and process failure due to lack of training is also one of the examples for operational risk. The last example of operational risk is a quality risk where quality assurance system which detects 99.99% of defects in their products and expects 0.01% of their products to have a minor defect and develop a return policy which enables consumers to receive a replacement product.[11]
Source: [12] Investopedia, 2019; https://www.investopedia.com/terms/m/marketrisk.asp [13] Investopedia, 2019; https://www.investopedia.com/ask/answers/042415/what-are-primary-sources-market-risk.asp
[14] Pocketsense, 2019; https://pocketsense.com/manage-market-risk-6564904.html
2.3.2 Market Risk
Market risk is defined as the total of needs for positions in foreign exchange, interest rates, equities, and gold and commodities for a financial institution. (Giot, P., & Laurent, S., 2003)
The importance of market risk is our needs and desire can be fulfilled by the supply and demand of most goods and services where it is balanced by the market prices in our modern economics. Corporates have become more unsheltered to market risks like commodity risks and foreign exchange risks because of globalization. (Alexander, C., 2008)
Exchange rate is the major source of uncertainty for multinationals, being typically four times as volatile as the interest rate and 10 times as volatile as inflation as it will affect the value of the firm. (Jorion, P., 1990)
According to James Chen, 2019, the chance of an investor to encounter losses where they involved due to the factors affecting the general performance of the financial market is called market risk because it affects the whole market and is difficult to hedge as diversification will not help. Changes to interest rates, exchange rates, geopolitical events, or recessions involved market risk.[12]
According to Steven Nickolas, 2018, the factor that influences the whole market or asset class which causes risk of loss is called market risk. The main sources of risk that exert influence on the whole market is the interest rate risk where the risk of growth fluctuating due to a change of interest rates. The risk that occurs from the risk of a decrease in the value of security or security price fluctuations is called equity price risk where it also affects the overall market. The foreign exchange rate also affects the market where they are a configuration of risk that appears when there is volatility in currency exchange rates and lastly the commodity price risk where the volatility in the market price due to price variation of a commodity.[13]
Source: [15] InflationData, 2019;
https://inflationdata.com/Inflation/Inflation_Rate/CurrentInflation.asp?reloaded=true
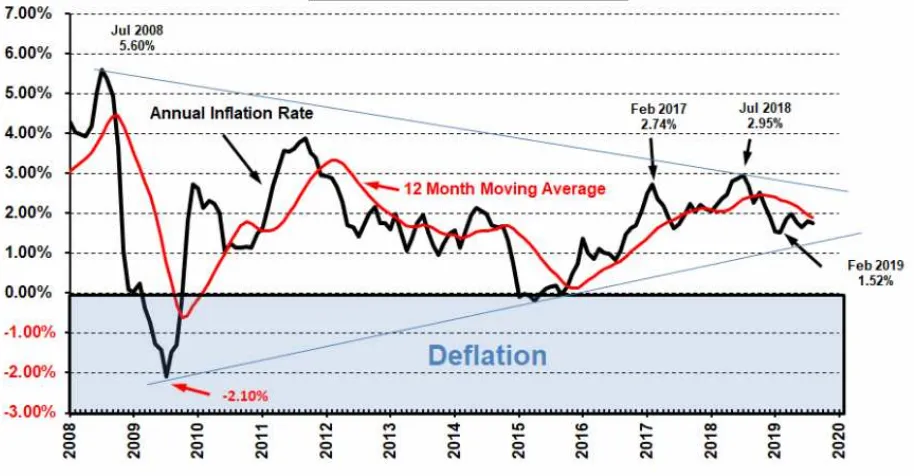
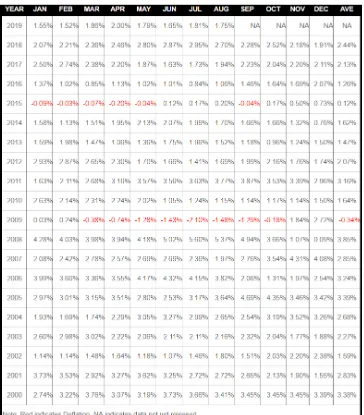
According to Tim Mcmahon, 2019, the inflation rate defines the health of an economy where countries with significantly higher inflation rates are said to have hyperinflation and when this takes place, the economy is nearly collapsing. Because high inflation is detrimental to the economy as a whole, but it benefits the government as it enables them to repay their debt with "cheaper dollars." Inflation largely results in a monthly or even annual increase in the supply of money. Figure 3 and Figure 4 demonstrate the latest US annual inflation rate map and table.[15]
[image:16.595.79.536.226.464.2]Source: InflationData; https://inflationdata.com/Inflation/Inflation_Rate/CurrentInflation.asp?reloaded=true
Source: InflationData; https://inflationdata.com/Inflation/Inflation_Rate/CurrentInflation.asp?reloaded=true
Figure 4 shows the Current Annual Inflation Rate in the U.S.
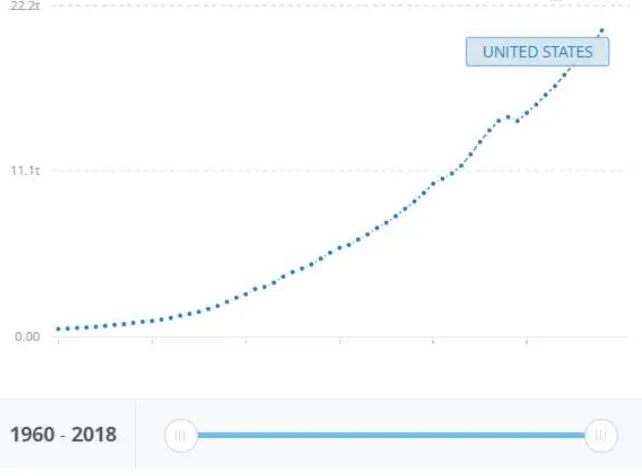
Gross Domestic Product (GDP) is a monetary measure of market value as well as measuring the value of economic activity within a country. Sum of gross value added by all resident producers in the economy plus any product taxes and minus
any subsidies not included in the value of the products is called GDP at purchaser’s
Source: The World Bank; https://data.worldbank.org/indicator/NY.GDP.MKTP.CD?locations=US
Figure 5 shows the GDP (current US$) in the United States based on the World Bank.
According to Kimberly Amadeo, 2019, a rise in the price of goods and services over certain time is called inflation. Inflation lowers the purchasing power of each unit of currency and U.S. inflation has lower the value of the dollar. The inflation rate is the percentage of expansion or decline in prices for a specific time. Figure 6 shows the inflation rate in the U.S.
Source: International Monetary Fund; https://www.imf.org/external/datamapper/PCPIPCH@WEO/USA
[image:18.595.122.479.502.706.2]
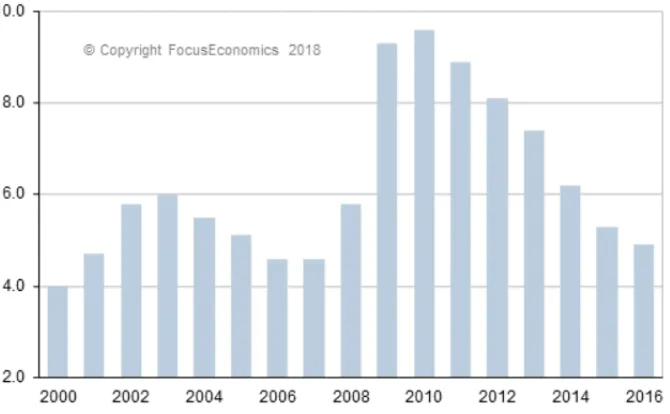
According to Jim Chappelow, 2019, unemployment is when someone is unable to find a job and is often used as a measure of the health of the economy. Based on figure 7, the unemployment rate is decreasing year by year which shows there are lesser available workers for each job opening. The current rate appears to be a good thing since the rate drops steadily which indicates the economy is strong.
[image:19.595.133.468.197.404.2]Source: Focus Economics; https://www.focus-economics.com/country-indicator/united-states/unemployment
Figure 7 shows the Unemployment Rate in the U.S.
2.3.3 Liquidity Risk
The risk that arises from a company’s lack of ability to meet its obligations when they come due without incurring intolerable losses is called liquidity risk. This risk becomes the top priority of a company’s management because it can influence both the company’s earnings and capital to make sure the availability of enough funds to meet upcoming demands. Liquidity risk can also define as the potential loss to an institution due to the lack of ability to meet its obligations or to fund rising in assets as they decline due without incurring not acceptable cost or losses. (Arif, A., & Nauman Anees, A., 2012)
Source: [16] Investopedia, 2019; https://www.investopedia.com/terms/l/liquidityrisk.asp
[17] Investopedia, 2019; https://www.investopedia.com/articles/trading/11/understanding-liquidity-risk.asp
[18] U.S.News, 2012; https://money.usnews.com/money/blogs/the-smarter-mutual-fund-investor/2012/12/03/investing-basics-why-liquidity-matters
and that is priced. This risk is important as it can explain the returns in several asset classes and can be thought of as a universal risk factor. (Chacko, G., 2005)
The time-series test is a popular method to show how important is liquidity risks in asset pricing. The results based on time-series tests should be evaluated as a shred of supporting evidence to confirm the pricing of risk factors but not as a piece of evidence in favor of or against a particular asset pricing model. (Lee, K. H., 2011)
According to Beverly Bird and Will Kenton, 2019, the capacity of the company to pay its loans without enduring catastrophic losses is called liquidity. The smaller the size of the defense, the greater the volatility hazard, under the rule of thumb. If an individual company is unable to satisfy its short-term debt obligations, liquidity risk may arise. Because of a lack of customers or an unstable market, the company is requiring the assets and profits to give up because they may not be able to convert an asset into cash. Investors, managers and creditors therefore use the liquidity measurement ratio when deciding on an organization's level of risk.[16]
According to David R.Harper, 2019, a term used to point out how effortlessly an asset or security can be purchase or sell in the market is called liquidity. Liquidity can express how quickly something can be turned into cash. Liquidity risk is classified into two categories: liquidity or cash flow risk funding and liquidity or asset or product risk market risk. A corporate treasurer's chief's concern is the financing liquidity risk that asks if the company can fund its liabilities. The current ratio and rapid ratio are the main metrics that would be a key mitigant for this hazard and credit line (LOC). The inability to exit a position quickly is also known as market liquidity risk where the resources are illiquidity.[17]
Source: [19] Investopedia, 2019; https://www.investopedia.com/terms/c/creditrisk.asp
[20] Marketing91, 2019; https://www.marketing91.com/what-is-credit-risk/
2.3.4 Credit Risk
Credit risk in the bank is a very significant risk as it includes loans that are not paid back. This hazard applies to a bank's probability of default due to the inability of loan debtors to pay on time or fulfill their obligations under their agreements with the lender. (Yurdakul, F., 2014)
Credit risk is perceived to be the most significant risk for financial institutions as the activities of internal credit risk management to access their capital requirements. Support for viability and competitiveness via active credit risk management and contribute to financial stability and efficient capital allocation in the economy. (Psillaki, M., Tsolas, I. E., & Margaritis, D., 2010)
Credit rating is a specific indicator of the credit risk of a company and is useful for categorizing businesses by credit risk. Moody's Investor Services is one of the rating companies that assign a rating based on the analysis of the financial statements of the company to a company. Credit ratings range from Aaa to businesses with the highest credit value and Ccc for companies that are likely to default. (Wilson, T. C., 1998)
According to Olivia Labarre, 2019, stated that the failure of a borrower to repay the loan or meet the contractual obligations which cause the possibility of loss is called credit risk. Traditionally, credit risk refers to the risk faced by the lender when the lender might not receive back their owed principal and interest. Lenders
must look at the five C’s which are credit history, capacity to repay, capital, the
loan’s conditions, and associated collateral to access credit risk on a consumer loan.
Usually, when a consumer posing a higher credit risk, they end up paying higher interest rates on loans.[19]
Source: [21] Investopedia, 2019; https://www.investopedia.com/ask/answers/022415/what-factors-are-taken-account-quantify-credit-risk.asp
3.0METHODOLOGY
Methods applied to a field of study is the systematic, theoretical analysis is called methodology. The methodology is a guiding principle for solving a problem and its benefits managers as it provides information to plan, review and control projects. (Ishak, I. S., Alias, R. A., 2005)
3.1IBM Statistical Package for the Social Sciences (SPSS)
Multiple regression analysis is one of the most widely used statistical procedures as it fostered by its applicability to varied types of data and problems. (Mason, C. H., & Perreault Jr, W. D., 1991) IBM Statistical Package for the Social Sciences (SPSS) version 25 was exercised to run the data analysis of this study. In this research, IBM SPSS Statistics was used to compute descriptive analysis, correlation, model summary (adjusted R square), ANOVA and coefficient between independent variables and dependent variables based on quantitative data extracted from annual reports.
3.2Data Sampling
3.3Framework
Dependent Variable
Independent Variable
3.4Data Analysis
There are 8 internal factors and 4 external factors in this study. Internal factors contain return on assets (ROA), current ratio, quick ratio, average-collection period, debt to income, operational ratio, operating margin and corporate governance index. Conversely, external factors contain gross domestic product (GDP), inflation, interest rate, exchange rate, beta, and unemployment rate.
The dependent variable of the study is ROA. It was measured by net income divided by its total assets. The formula is as below:
Return on Assets (ROA) = 𝑁𝑒𝑡 𝐼𝑛𝑐𝑜𝑚𝑒
𝑇𝑜𝑡𝑎𝑙 𝐴𝑠𝑠𝑒𝑡𝑠
3.5Model
Model 1: Linear Regression Model of ROA with internal factors.
Performance ROA= ai + a1 Current Ratio + a2 Quick Ratio + a3 Average-Collection
Period + a4 Debt to Income + a5 Operational Ratio + a6 Operating Margin + a7
Corporate Governance Index + e
Model 2: Linear Regression Model of ROA with external factors.
Performance ROA= ai + a1 GDP + a2 Inflation + a3 Exchange Rate + e
Return on Assets (ROA)
Internal
Model 3: Linear Regression Model of ROA with internal factors and external
factors.
Performance ROA= ai + a1 Current Ratio + a2 Quick Ratio + a3 Average-Collection
Period + a4 Debt to Income + a5 Operational Ratio + a6 Operating Margin + a7
Corporate Governance Index + a8 GDP + a9 Inflation + a10 Interest Rate + a11
4.0ANALYSIS AND FINDINGS
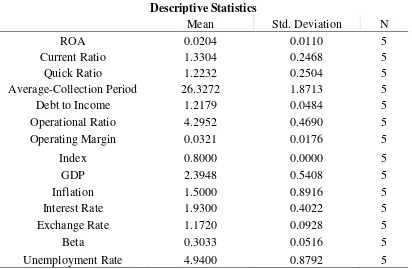
4.1Descriptive Statistics
Descriptive Statistics
Mean Std. Deviation N
ROA 0.0204 0.0110 5
Current Ratio 1.3304 0.2468 5
Quick Ratio 1.2232 0.2504 5
Average-Collection Period 26.3272 1.8713 5
Debt to Income 1.2179 0.0484 5
Operational Ratio 4.2952 0.4690 5
Operating Margin 0.0321 0.0176 5
Index 0.8000 0.0000 5
GDP 2.3948 0.5408 5
Inflation 1.5000 0.8916 5
Interest Rate 1.9300 0.4022 5
Exchange Rate 1.1720 0.0928 5
Beta 0.3033 0.0516 5
[image:26.595.94.506.144.413.2]Unemployment Rate 4.9400 0.8792 5
Table 1 shows the descriptive statistics.
The average of return on assets (ROA) is 0.0204 and its standard deviation is 0.0110. The mean value of ROA shows that on average the firm generates $ 0.02 of income from $ 1.00 of its assets. It shows that Ford is not using its assets well in generating profits. Since the standard deviation is low, therefore, the dispersion is very low, and the values tend to be close to the mean within 5 years.
The mean value of the current ratio is 1.3304 which indicates that $ 1.33 of current assets from $ 1.00 of current liabilities. The standard deviation of the current ratio is 0.2468 where the dispersion is considered low as well within 5 years and indicates that there is 24.68% of the variation for the current ratio of Ford.
The average value of the quick ratio is 1.2232 and its standard deviation is 0.2504. $ 1.22 of the quick assets shows $ 1.00 of the current liabilities. The values of the quick ratio tend to be close to the mean as the standard deviation is very low within 5 years and indicates that there is 25.04% of the variation for the quick ratio of Ford.
The standard deviation is quite high among all the values which are 1.8713 indicates that there is 187.13% of the variation for the average-collection period of Ford. This shows that the value spread further from the mean and the variation is higher than the other values within 5 years.
The mean value of debt to income is 1.2179 which means there is $ 1.22 of total liabilities shows $ 1.00 of total income (revenue and operating income). The standard deviation of debt to income within 5 years is 0.0484 indicates that there is 4.84% of the variation for debt to income of Ford.
The mean value of the operational ratio is 4.2952 which means that there are $ 4.30 operating expenses that show $ 1.00 net sales of Ford Motor Company. The standard deviation of the operational ratio is 0.4690 which indicates that there is 46.9% of the variation for the operational ratio of Ford within 5 years.
The mean value of the operating margin is 0.0321 which means that there are $ 0.03 earnings before interest and taxes (EBIT) show $ 1.00 revenue of Ford Motor Company. The standard deviation of the operating margin is 0.0176 which indicates that there is 1.76% of the variation for the operating margin of Ford within 5 years.
The mean value of the corporate governance index is 0.8 and the standard deviation of the corporate governance index is 0 which means that there are no changes in the corporate governance index within 5 years.
The mean value of the gross domestic product (GDP) is 2.3948% shows that on average the economy of the US has increased by 2.39% within 5 years. The standard deviation of GDP is 0.5408 which indicates that there is 54.08% of the variation for GDP within 5 years.
The mean value of inflation is 1.5% shows that the average inflation rate in the US within 5 years is 1.5%. The standard deviation of inflation is 0.8916 which indicates that there is 89.16% of the variation for inflation within 5 years.
The mean value of the interest rate is 1.93% shows that the average interest rate in the US within 5 years is 1.93%. The standard deviation of interest rate is 0.4022 which indicates that there is 40.22% of the variation for interest rate within 5 years.
The mean value of standard deviation which is also known as beta based on the price change each year is 0.3033 and its standard deviation is 0.0516 which indicates that there is 5.16% of the variation within 5 years.
The mean value of the unemployment rate is 4.94% shows that the economy in the US was doing well as unemployed people are less since the mean value is low within 5 years. The standard deviation of the unemployment rate is 0.8792 which indicates that there is 87.92% of the variation for the unemployment rate within 5 years.
4.2Return on Assets (ROA)
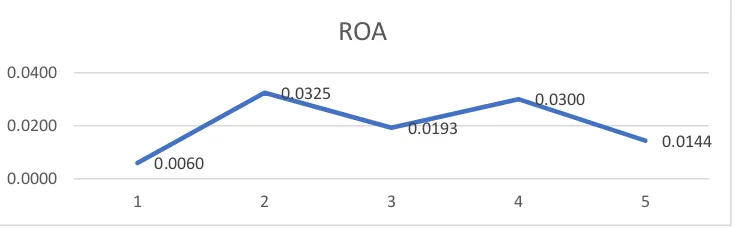
[image:28.595.125.494.445.559.2]Based on Figure 8 below, Ford Motor Company produced $0.006 net income on each $1 total assets in the year 2014 where we can say that the company has very low efficiency to manage their assets to produce profits. Despite that, it had increased back in the year 2015 which is $0.03 net income on each $1 total assets and the ROA of the company is going up and down and reaches $0.01 in the year 2018. These show that the company is not making sufficient income from the use of its asset, ineffective use of company facilities as well as poor management.
Figure 8 shows the ROA of Ford Motor Company from the year 2014 to the year 2018.
4.3Operational Ratio
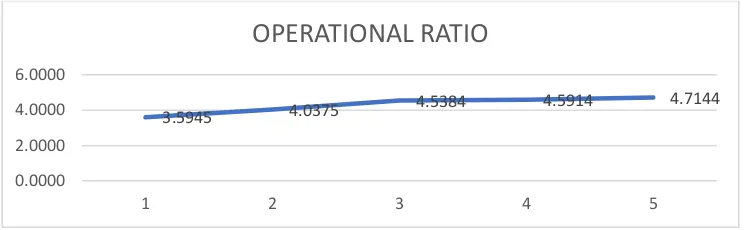
Based on Figure 9 below, the operational ratio of Ford Motor Company was 3.59 in the year 2014 which means every $1 of net sales shows $3.59 of operating expenses. The operational ratio increases from the year 2014 to the year 2018 and reaches 4.71 in the year 2018. This increasing ratio is less favorable as there will be a lower margin of profit obtainable for the purpose of payment and dividend and
0.0060
0.0325
0.0193
0.0300
0.0144
0.0000 0.0200 0.0400
1 2 3 4 5
creation of reserves. The trend of the operating ratios is almost constant for the 5 years.
Figure 9 shows the Operational Ratio of Ford Motor Company from the year 2014 to the year 2018.
4.4Operating Margin
Based on Figure 10 below, the operating margin has increased from $0.01 in the year 2014 to $0.05 in the year 2015 for every $1 revenue. The operating margin goes up and down and reaches 0.02 operating margin in the year 2018. The decrease in the operating margin may due to the company had happened changes in senior management, poor marketing, poor compensation plan, sales alignment, and others.
Figure 10 shows the Operating Margin of Ford Motor Company from the year 2014 to the year 2018.
4.5Current Ratio
Based on Figure 11, the current ratio of Ford Motor Company was 1.77 in the year 2014 which means every $1 of current liabilities shows $1.77 of current assets. The current ratio of Ford Motor Company has dropped slightly from 1.77 in the year 2014 to 1.20 in the year 2018. Considering these facts alone, in the year 2018 is a less favorable position to obtain short-term liability due to a lower amount of current ratio.
3.5945 4.0375
4.5384 4.5914 4.7144
0.0000 2.0000 4.0000 6.0000
1 2 3 4 5
OPERATIONAL RATIO
0.0085
0.0493
0.0302
0.0493
0.0229
0.0000 0.0200 0.0400 0.0600
1 2 3 4 5
[image:29.595.121.484.442.554.2]Figure 11 shows the Current Ratio of Ford Motor Company from the year 2014 to the year 2018.
4.6Quick Ratio
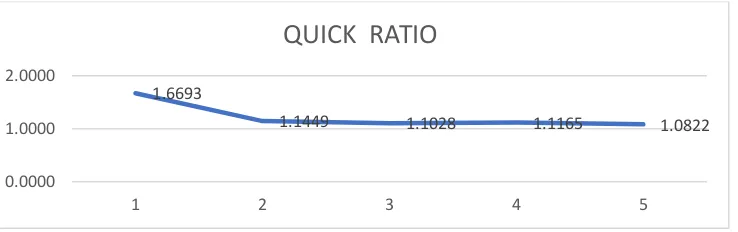
Based on Figure 12, the quick ratio was 1.67 in the year 2014 which shows the quick assets of $1.67 show $1 of current liabilities. The quick ratio also decreases slightly from 1.67 in the year 2014 to 1.08 in the year 2018. The quick ratio which is more than 1.0 shows that a company is sufficiently able to face its short-term obligations based on the rule of thumb. Besides, a lower quick ratio might be
delivering few messages about a company such as the company’s balance sheet is
over-leveraged, drop-in company sales, difficulty in accumulating its account receivables or even paying their bills too fast. In this case, the quick ratio for Ford Motor Company shows the company is facing difficulties in collecting debts as well as paying its bills in a short period.
Figure 12 shows the Quick Ratio of Ford Motor Company from the year 2014 to the year 2018.
1.7703
1.2460 1.2014 1.2347 1.1996
0.0000 1.0000 2.0000
1 2 3 4 5
CURRENT RATIO
1.6693
1.1449 1.1028 1.1165 1.0822
0.0000 1.0000 2.0000
1 2 3 4 5
4.7Average-Collection Period
[image:31.595.116.485.246.362.2]Based on Figure 13 below, in the year 2014, the average-collection period of Ford Motor Company is 29.25. This result indicates that it takes the firm, on average, 29.25 days to collect an account receivable. The average-collection period of Ford Motor Company decreases slightly from 29.25 in the year 2014 to 25.14 in the year 2018. The decreasing in the average-collection period shows the ability of Ford Motor Company to collect its account receivable becomes stronger as time goes.
Figure 13 shows the Average-Collection Period of Ford Motor Company from the year 2014 to the year 2018.
4.8Debt to Income
Based on Figure 14, the debt to income in the year 2014 shows 1.16 which shows every $1 of total income shows $1.16 of total liabilities. The debt to income increases from 1.16 in the year 2014 to 1.27 in the year 2017 and decrease slightly to 1.26 in the year 2018. These high debts to income mean more of your income is spent on debt which lesser money spent on other bills or save and invest. Ford Motor Company shows a high debt to income which means they have too much debt.
Figure 14 shows the Debt to Income of Ford Motor Company from the year 2014 to the year 2018.
29.2544 26.5791 26.3289
24.3382 25.1357
0.0000 20.0000 40.0000
1 2 3 4 5
AVERAGE-COLLECTION PERIOD
1.1591 1.1833
1.2157
1.2740 1.2573
1.1000 1.2000 1.3000
1 2 3 4 5
[image:31.595.115.485.603.720.2]4.9Corporate Governance Index
Based on Figure 15, the corporate governance index shows constant from the year 2014 to the year 2018 which is 0.8. Corporate governance index measures the corporate governance of a company by combining several good indicators. This measure of good indicators consists of accountability (the availability of the meetings in the board), transparency (the availability of audit committee in the board), independence (consist more than 50 non-executives in the board), fairness (availability of female in the board) and sustainability (consist of programs such as charity, CSR, green technology). Ford Motor Company is lack of independence due to insufficient of non-executives in the board. On the other hand, Ford Motor Company is a family business, therefore, there are many dualities in the company which might induce conflict among the committees.
Figure 15 shows the corporate governance of Ford Motor Company from the year 2014 to the year 2018.
4.10 Price Change
Based on Figure 16, shows an upward trend of price change of Ford Motor Company from the year 2014 to the year 2018. The highest point is during the year 2018 which is $0.10045 whereas the lowest is during the year 2014 which is -$5.01845. The average price change is -$2.59864 and the standard deviation is 1.246096.
0.8 0.8 0.8 0.8 0.8
0 0.5 1
1 2 3 4 5
Figure 16 shows the price change of Ford Motor Company from the year 2014 to the year 2018.
4.11 Beta
Based on Figure 17, shows the beta from the year 2014 to the year 2018. In the beginning, it shows a decreasing trend from the year 2014 to the year 2017 which is from 0.3528 dropped to 0.2222 and then it increases to 0.3076 in the year 2018. The dispersion of the price change is not huge as all the value is under the range of 0.2 to 0.4.
Figure 17 shows the beta of Ford Motor Company from the year 2014 to the year 2018.
0.352841777 0.341860035
0.291828835
0.222217512
0.307649675
0 0.2 0.4
1 2 3 4 5
4.12 Gross Domestic Product (GDP)
Gross domestic product (GDP) is a measurement of the value of the economic activity and known as the monetary value of all finished goods and services made within a country during a specific period. Based on Figure 18, GDP from the year 2014 to the year 2016 showed a fluctuating trend. GDP in the year of 2014 is 2.45 and it increases slightly to 2.88 in the year 2015 and dropped to 1.57 in the year 2016. From the year 2016 to the year 2018 showed an upward trend as it increases from 1.57 in the year 2016 to 2.22 in the year 2017 and to 2.86 in the year 2018.
Figure 18 shows the Gross Domestic Product of Ford Motor Company from the year 2014 to the year 2018.
4.13 Inflation
A general increase in prices and fall in the purchasing value of money is called inflation. Based on Figure 19, inflation dropped rapidly from the year 2014 to the year 2015 which is from 1.60% to 0.10%. Then, from the year 2015 to the year 2018, it showed an increasing trend as it increases from 0.10% to 2.4%. These increasing trends might cause by an increase in demand for goods relative to supply. This increasing trend of inflation is not good for the economy or individuals as it will reduce the value of money unless the interest rates are higher than the inflation.
Figure 19 shows the inflation of Ford Motor Company from the year 2014 to the year 2018.
2.45 2.88
1.57
2.22
2.86
0.00 2.00 4.00
1 2 3 4 5
GDP
1.60
0.10
1.30
2.10 2.40
0.00 1.00 2.00 3.00
1 2 3 4 5
4.14 Interest Rate
The amount charged and is expressed as a percentage of a principal by the lender to a borrower for the usage of assets. Based on Figure 20, the interest rate increases from the year 2014 to the year 2016 which is from 1.33% to 2.39%. Then it shows a decreasing trend from 2.39% in the year 2016 to 1.80% in the year 2018.
Figure 20 shows the interest rate of Ford Motor Company from the year 2014 to the year 2018.
4.15 Exchange Rate (USD to EURO)
[image:35.595.126.496.200.309.2]The value of one currency for the purpose of conversion to another or the comparison of currencies between two different countries is known as the exchange rate. The exchange rate can be influenced by interest rate, inflation, political stability, and economic performance. Based on Figure 21, the exchange rate of the U. S. Dollar to Euro from the year 2014 to the year 2015 decreases from 1.33% to 1.11%. After that, the exchange rate started to increase slightly from the year 2015 to the year 2018 which is from 1.11% to 1.18%.
Figure 21 shows the exchange rate of Ford Motor Company from the year 2014 to the year 2018.
1.33
2.17 2.39 1.96
1.80
0 1 2 3
1 2 3 4 5
Interest Rate
1.33
1.11 1.11 1.13
1.18
1 1.2 1.4
1 2 3 4 5
4.16 Unemployment Rate
Unemployment rate is the percentage of jobless workers in the total labor force. Those workers who are jobless are considered as an unemployed person. Based on Figure 22, the unemployment rate showed a downward trend. The highest unemployment rate was during the year 2014 which is 6.2%. It decreased by 2.3% become 3.9% in the year 2018, which is the smallest unemployment rate among these five years. This shows that the unemployment rate in the US is getting lesser and lesser from the year 2014 to the year 2018.
Figure 22 shows the unemployment rate of Ford Motor Company from the year 2014 to the year 2018.
6.2
5.3 4.9
4.4 3.9
0 5 10
1 2 3 4 5
4.17 Correlations Correlations ROA Current Ratio Quick Ratio Average-Collection Period Debt to Income Operational Ratio Operating
Margin Index GDP Inflation Interest
Rate
Exchange Rate Beta
Unemployment Rate Pearson
Correlation
ROA 1.000
Current ratio -0.677 1.000 Quick Ratio -0.673 0.999 1.000 Average-Collection
Period
-0.621 0.873 0.889 1.000
Debt to Income 0.345 -0.695 -0.718 -0.937 1.000
Operational Ratio 0.341 -0.866 -0.878 -0.913 0.911 1.000
Operating Margin 0.997*** -0.693 -0.692 -0.669 0.412 0.391 1.000 .
Index .*** . . . 1.000 . . . .
GDP 0.063 0.089 0.075 0.023 -0.097 -0.222 0.033 . 1.000 Inflation -0.454 0.015 -0.014 -0.349 0.650 0.476 -0.383 . -0.104 1.000
Interest Rate 0.684 -0.830 -0.811 -0.531 0.290 0.563 0.676 . -0.418 -0.409 1.000
Exchange Rate -0.835** 0.935 0.926 0.749 -0.504 -0.683 -0.838 . 0.206 0.293 -0.941 1.000 Beta -0.458 0.534 0.551 0.804 -0.861 -0.719 -0.529 . 0.425 -0.497 -0.346 0.500 1.000 Unemployment
Rate
-0.328 0.826 0.844 0.926 -0.927 -0.959 -0.375 . -0.055 -0.520 -0.402 0.593 0.639 1.000
[image:37.842.76.772.140.450.2]P value < 0.10 *, P value < 0.05**, P value < 0.001***.
Sources: [22] European Social Survey, 2019;
http://essedunet.nsd.uib.no/cms/topics/regression/4/2.html
Pearson correlation is used to determine and measure the statistical relationship between the dependent variables, which is Return on Assets (ROA) and the independent variables, which are average-collection period, quick ratio, debt to income, operational ratio, current ratio, operating margin, beta, corporate governance index, inflation, interest rate, exchange rate, GDP, and unemployment rate. Table 2 above shows the correlations of the dependent variable and its independent variables.
Independent variable and dependent variable are positively linear correlated when the Pearson correlation is positive while when the independent variable and dependent variable are negatively linear correlated when the Pearson correlation is negative. When both variables do not have any relation or absence of relationship, which means the Pearson correlation has a value of zero. Significant value (Sig.) is known as the P-value which tells how significant the independent variable to the dependent variable is.
The table 2 above shows the Pearson correlation of current ratio and quick ratio is -0.677 and -0.673 respectively while its P-value shows 0.105 and 0.106 respectively. This shows that the current ratio and quick ratio is negatively correlated to the ROA of Ford Motor Company. This shows that when the current ratio or quick ratio increases, ROA will decrease and vice versa. Besides, the current ratio and quick ratio is insignificant to ROA as its P-value is more than 0.10.
statistically significant. (Johnson-Taylor, W. L., Fisher, R. A., Hubbard, V. S., Starke-Reed, P., & Eggers, P. S., 2008)
Average-collection period, inflation, exchange rate, beta, and unemployment rate show a negative Pearson correlation towards ROA which means that they are negatively correlated to ROA of Ford Motor Company and this indicates that when average-collection period, inflation, exchange rate, beta, and unemployment rate increases, ROA decreases. Furthermore, the corporate governance index has no correlated to ROA as a corporate governance index is the same throughout 5 years. On the other hand, debt to income, operational ratio, gross domestic products (GDP) and interest rate shows positive Pearson Correlation which shows that they are directly proportional to ROA of Ford Motor Company.
The P-value of the average-collection period, debt to income, operational ratio, GDP, inflation, interest rate, beta, and the unemployment rate is more than 0.10 which shows it is a weak significance or not significant towards ROA. Conversely, the corporate governance index shows a P-value of 0. Only the exchange rate shows P-value which is less than 0.10 and less than 0.05. This shows that the exchange rate is statistically significant to the ROA of Ford Motor Company.
4.18 Model Summary
Model Summaryb
Model R R Square
Adjusted R Square
Std. Error of the Estimate
Durbin-Watson
1 0.997a 0.993 0.991 0.0010 1.513
a. Predictors: (Constant), OPERATING MARGIN b. Dependent Variable: ROA
Table 3 shows model summary of the model 1.
Durbin-Watson is 1.513 which shows normal as it should not be less than 1.5 and more than 3.
Model Summaryb
Model R R Square
Adjusted R Square
Std. Error of the Estimate
Durbin-Watson
1 0.887a 0.786 0.146 0.0101 3.144
[image:40.595.114.488.144.233.2]a. Predictors: (Constant), Exchange Rate, GDP, Inflation b. Dependent Variable: ROA
Table 4 shows model summary of the model 2.
Based on table 4, the adjusted R square for model 2 is 0.146 which is 14.6%. This shows that by using the exchange rate, GDP and inflation as the predictor, it can explain 14.6% of the variance in the ROA of Ford Motor Company from 2014 to 2018. Furthermore, the remaining 85.4% of the variance in ROA is unable to be explained by the operating margin. This is not as good as it mostly is unable to be explained.
Model Summaryc
Model R R Square
Adjusted R Square
Std. Error of the Estimate
Durbin-Watson
1 0.997a 0.993 0.991 0.0010
2 1.000b 1.000 1.000 0.0002 2.053
a. Predictors: (Constant), OPERATING MARGIN b. Predictors: (Constant), OPERATING MARGIN, Beta c. Dependent Variable: ROA
Table 5 shows model summary of the model 3.
[image:40.595.117.486.408.530.2]
4.19 ANOVA
ANOVAa
Model
Sum of
Squares df Mean Square F Sig.
1 Regression .000 1 .000 439.507 .000b
Residual .000 3 .000
Total .000 4
a. Dependent Variable: ROA
b. Predictors: (Constant), OPERATING MARGIN
Table 6 shows the ANOVA of model 1.
Based on table 6, the significant level or also known as P-value for model 1 is 0 which is less than 0.001 shows that operating margin is statistically highly significant to ROA of Ford Motor Company. Higher F-value will be better and from model 1, it shows a relatively large value which is 439.507 which shows that the variability of group means is large relative to the within-group variability.
ANOVAa
Model
Sum of
Squares df Mean Square F Sig.
1 Regression .000 3 .000 1.228 .567b
Residual .000 1 .000
Total .000 4
a. Dependent Variable: ROA
[image:41.595.96.503.141.244.2]b. Predictors: (Constant), Exchange Rate, GDP, Inflation
Table 7 shows the ANOVA of model 2.
ANOVAa
Model
Sum of
Squares df Mean Square F Sig.
1 Regression .000 1 .000 439.507 .000b
Residual .000 3 .000
Total .000 4
2 Regression .000 2 .000 4498.183 .000c
Residual .000 2 .000
Total .000 4
a. Dependent Variable: ROA
b. Predictors: (Constant), OPERATING MARGIN c. Predictors: (Constant), OPERATING MARGIN, Beta
Table 8 shows the ANOVA of model 3.
Based on table 8, the significant level or also known as P-value for model 1 and 2 is 0 which is less than 0.001 shows that operating margin and beta is statistically highly significant to ROA of Ford Motor Company. Higher F-value will be better and from model 1 and 2, it shows a relatively large value which is 439.507 and 4498.183 respectively which shows that the variability of group means is large relative to the within-group variability. 4.20 Coefficients Coefficientsa Model Unstandardized Coefficients Standardized Coefficients
t Sig.
95.0% Confidence Interval for B
Collinearity Statistics
B
Std.
Error Beta
Lower Bound
Upper
Bound Tolerance VIF
1 (Constant) .000 .001 .437 .691 -.003 .004
OPERATING MARGIN
.623 .030 .997 20.964 .000 .528 .718 1.000 1.000
[image:42.595.97.503.84.227.2]a. Dependent Variable: ROA
Table 9 shows the coefficients of the model 1.
determined through a significant level (Sig.) which is also known as P-value. P-value which is less than 0.001 shows that the independent variable has a strong influence on the dependent variable whereas P-value less than 0.05 shows a moderate influence on the dependent variable and lastly the least significance influence on the dependent variable is when P-value less than 0.10. Any P-value of more than 0.10 is not significant.
The P-value of operating margin is less than 0.001 which shows that the operating margin has the most significant influence towards ROA of Ford Motor Company with the P-value of 0. The beta coefficient of operating margin is 0.997 which means that operating margin is positively correlated to ROA and they are directly proportional to each other. Furthermore, t-value of operating margin is very high which is 20.964 shows that operating margin has a very high impact towards ROA of Ford Motor Company. Coefficientsa Model Unstandardized Coefficients Standardized Coefficients
t Sig.
95.0% Confidence Interval for B
Collinearity Statistics
B Std. Error Beta
Lower Bound
Upper
Bound Tolerance VIF
1 (Constant) .128 .066 1.947 .302 -.705 .961
GDP .004 .010 .213 .443 .734 -.119 .128 .928 1.077
Inflation -.002 .006 -.191 -.388 .764 -.079 .074 .886 1.129 Exchange
Rate
-.097 .059 -.823
-1.649
.347 -.847 .653 .858 1.166
a. Dependent Variable: ROA
Table 10 shows the coefficients of the model 2.
Based on table 10, it shows the analysis of coefficients for the external factor that influences the ROA of Ford Motor Company. The P-value of all the external factors in model 2 which is GDP, inflation and exchange rate is more than 0.10 which shows that they have no significant influence towards ROA of Ford Motor Company with the P-value of 0.734, 0.764 and 0.347 respectively.
which means that the GDP is positively correlated to ROA and they are directly proportional to each other. Exchange rate got the highest t-value which shows that among the macroeconomics, exchange rate got the highest impact towards ROA of Ford Motor Company within 5 years.
Coefficientsa Model Unstandardized Coefficients Standardized Coefficients
t Sig.
95.0% Confidence Interval for B
Collinearity Statistics
B
Std.
Error Beta
Lower Bound
Upper
Bound Tolerance VIF
1 (Constant) .000 .001 .437 .691 -.003 .004
OPERATING MARGIN
.623 .030 .997 20.964 .000 .528 .718 1.000 1.000
2 (Constant) -.007 .001 -6.965 .020 -.011 -.003
OPERATING MARGIN
.655 .008 1.047 84.314 .000 .621 .688 .721 1.388
Beta .020 .003 .095 7.681 .017 .009 .032 .721 1.388
[image:44.595.73.522.175.380.2]a. Dependent Variable: ROA
Table 11 shows the coefficients of the model 3.
Based on table 11, it shows the analysis of coefficients for both internal and external factors that influence the ROA of Ford Motor Company. The P-value of operating margin is less than 0.001 which shows that operating margin has the most significant influence towards ROA of Ford Motor Company with the P-value of 0. The P-value for the beta is 0.17 which is less than 0.05 shows that it is a moderate influence on ROA.
5.0CONCLUSION
The purpose of this study is to analyze the determinants of the ROA of Ford Motor Company from 2014 to 2018 and how the determinants affect the ROA. To finalize this study, the internal factors (operating margin, average-collection period, corporate governance index, debt to income, quick ratio, operational ratio, current ratio) and external factors (exchange rate, inflation, GDP, beta, unemployment rate, interest rate) that influence ROA are investigated.
In conclusion, we can draw to a close that the internal determinant which is operating margin and beta have a significant relationship with ROA and influences ROA the most from 2014 to 2018 in Ford Motor Company. A higher operating margin is more favorable as it shows that the company is making enough money to pay for its operating expenses. This research shows that the operating margin and ROA of Ford Motor Company are directly proportional to each other. This shows when operating margin is high, the company will gain more profit and ROA will increase as well which shows that the company is using its assets effectively. Therefore, the trend of operating margin and ROA will be the same. Currently, the average operating margin of Ford Motor Company is 3.21% which is less than 5% shows that the business of Ford Motor Company is not efficient converting revenue into profits which will affect the ROA of the company. The average ROA of the company is 2.04% is relatively low and it shows that the company is not making sufficient income from the used assets. In order to raise the income of the company, Ford Motor Company should pay full attention to the operating margin of the company.
REFERENCE
Alexander, C. (2008). Market risk analysis, practical financial econometrics (Vol. 2). John
Wiley & Sons.
Allport, R. J., & Ward, S. (2010). Operational risk: the focus for major infrastructure?. Proceedings of the Institution of Civil Engineers-Management, Procurement
and Law, 163(3), 121-127.
Arif, A., & Nauman Anees, A. (2012). Liquidity risk and performance of banking system. Journal of Financial Regulation and Compliance, 20(2), 182-195.
Bekker, H. (2019). 2018 (Full Year) USA: Ford Sales - America's Favorite Car Brand - Car Sales Statistics. Retrieved 1 October 2019, from https://www.best-selling-cars.com/usa/2018-full-year-usa-ford-sales-americas-favorite-car-brand/
Bhasin, H. (2019). What is Credit Risk? 3 Types of Credit Risk & its Calculations. Retrieved 1 October 2019, from https://www.marketing91.com/what-is-credit-risk/
Bloomberg - Are you a robot?. (2019). Retrieved 1 October 2019, from https://www.bloomberg.com/news/articles/2019-01-14/unhappy-with-ford-s-performance-ceo-looks-to-rival-for-relief
Chacko, G. (2005). Liquidity risk in the corporate bond markets. Available at SSRN 687619.
Coleman, R. (2010). Operational Risk. Wiley Encyclopedia of Operations Research and
Management Science.
Core, J. E., Holthausen, R. W., & Larcker, D. F. (1999). Corporate governance, chief executive officer compensation, and firm performance. Journal of financial economics, 51(3), 371-406.
Council, A. C. G. (2007). Corporate governance principles and recommendations.
Cronin Jr, J. J., & Page Jr, T. J. (1988). An examination of the relative impact of growth strategies on profit performance. European Journal of Marketing, 22(1), 57-68.
Eisenschmidt, K., & Vanini, U. (2019). Compliance with the German Corporate Governance
Code: Can the heterogeneous implementation be explained?. Zeszyty Teoretyczne
Elsas, R., El-Shaer, M., & Theissen, E. (2003). Beta and returns revisited: evidence from the
German stock market. Journal of International Financial Markets, Institutions and
Money, 13(1), 1-18.
Ford Is Investigating Emissions and Fuel Efficiency Data. (2019). Retrieved 1 October 2019, from https://www.nytimes.com/2019/02/21/business/ford-emissions.html
Ford makes big electric push in Europe with new launches. (2019). Retrieved 1 October 2019,
from
https://www.reuters.com/article/us-ford-electric/ford-makes-big-electric-push-in-europe-with-new-launches-idUSKCN1VV1CZ
Ford Motor Company | History & Facts. (2019). Retrieved 1 October 2019, from https://www.britannica.com/topic/Ford-Motor-Company
Ford Motor Company SWOT Analysis - Panmore Institute. (2017). Retrieved 1 October 2019, from http://panmore.com/ford-motor-company-swot-analysis
Ford says 2017 performance will fall from 2016 levels as costs rise. (2019). Retrieved 1
October 2019, from
https://www.reuters.com/article/us-ford-investors/ford-says-2017-performance-will-fall-from-2016-levels-as-costs-rise-idUSKCN11K1D0
GHALEM, Â., Chafik, O. K. A. R., CHROQUI, R., & EL ALAMI, S. E. M. M. A. Performance: A concept to define! La performance: Un concept à definer!.
Giot, P., & Laurent, S. (2003). Market risk in commodity markets: a VaR approach. Energy
Economics, 25(5), 435-457.
Govindaraj, S., Jaggi, B., & Lin, B. (2004). Market overreaction to product recall revisited— The case of Firestone Tires and the Ford Explorer. Review of Quantitative Finance and
Accounting, 23(1), 31-54.
Greenlee, J. S., & Trussel, J. M. (2000). Predicting the financial vulnerability of charitable organizations. Nonprofit management and leadership, 11(2), 199-210.
Hemrit, W., & Arab, M. B. (2012). The major sources of operational risk and the potential benefits of its management. The Journal of Operational Risk, 7(3), 71-92.
How to Manage Market Risk. (2019). Retrieved 1 October 2019, from https://pocketsense.com/manage-market-risk-6564904.html
Investing Basics: Why Liquidity Matters. (2012). Retrieved 1 October 2019, from
https://money.usnews.com/money/blogs/the-smarter-mutual-fund-investor/2012/12/03/investing-basics-why-liquidity-matters
Ishak, I. S., & Alias, R. A. (2005). Designing a strategic information system planning
methodology For Malaysian institutes of higher learning (ISP-IPTA). Universiti Teknologi
Malaysia.
Johnson-Taylor, W. L., Fisher, R. A., Hubbard, V. S., Starke-Reed, P., & Eggers, P. S. (2008). The change in weight perception of weight status among the overweight: comparison of NHANES III (1988–1994) and 1999–2004 NHANES. International Journal of Behavioral
Nutrition and Physical Activity, 5(1), 9.
Jolly, J. (2019). Ford to cut 12,000 jobs in Europe amid struggling car market. Retrieved 1
October 2019, from
https://www.theguardian.com/business/2019/jun/27/ford-to-cut-12000-jobs-in-europe-amid-struggling-car-market
Jorion, P. (1990). The exchange-rate exposure of US multinationals. Journal of business,
331-345.
La Porta, R., Lopez-de-Silanes, F., Shleifer, A., & Vishny, R. (2000). Investor protection and corporate governance. Journal of financial economics, 58(1-2), 3-27.
Learn About Liquidity Risk With Investments. (2019). Retrieved 1 October 2019, from https://www.investopedia.com/terms/l/liquidityrisk.asp
Lee, K. H. (2011). The world price of liquidity risk. Journal of Financial Economics, 99(1),
136-161.
Marie L’Huillier, B. (2014). What does “corporate governance” actually mean?.Corporate Governance, 14(3), 300-319.
Market Risk Definition. (2019). Retrieved 1 October 2019, from
https://www.investopedia.com/terms/m/marketrisk.asp