Erratum
(April 2018)
Host expression of PD-L1 determines efficacy
of PD-L1 pathway blockade–mediated tumor
regression
Heng Lin, … , Ilona Kryczek, Weiping Zou
J Clin Invest.
2018;
128(2)
:805-815.
https://doi.org/10.1172/JCI96113
.
Programmed death-1 ligand (PD-L1, B7-H1) and programmed cell death protein 1 (PD-1)
pathway blockade is a promising therapy for treating cancer. However, the mechanistic
contribution of host and tumor L1 and 1 signaling to the therapeutic efficacy of
PD-L1 and PD-1 blockade remains elusive. Here, we evaluated 3 tumor-bearing mouse models
that differ in their sensitivity to PD-L1 blockade and demonstrated a loss of therapeutic
efficacy of PD-L1 blockade in immunodeficient mice and in PD-L1– and PD-1–deficient
mice. In contrast, neither knockout nor overexpression of PD-L1 in tumor cells had an effect
on PD-L1 blockade efficacy. Human and murine studies showed high levels of functional
PD-L1 expression in dendritic cells and macrophages in the tumor microenvironments and
draining lymph nodes. Additionally, expression of PD-L1 on dendritic cells and
macrophages in ovarian cancer and melanoma patients correlated with the efficacy of
treatment with either anti–PD-1 alone or in combination with anti–CTLA-4. Thus, PD-L1–
expressing dendritic cells and macrophages may mechanistically shape and therapeutically
predict clinical efficacy of PD-L1/PD-1 blockade.
Research Article
Immunology
Find the latest version:
Introduction
Therapeutic blockade of programmed death–ligand 1 (PD-L1, B7-H1) or programmed death protein 1 (PD-1) with mAbs leads to durable tumor control in a minority of patients across many cancer histologies (1, 2). Clinical response to PD-L1 and PD-1 blockade has been associated with increased PD-L1 expression in the tumor tissues, the presence of tumor-infiltrating T cells, and tumor muta-tional load (1–9). There remains a lack of mechanistic, prognostic, and predictive biomarkers that adequately identify which patients will most benefit from the PD-L1 and PD-1 axis blockade. To dis-sect the molecular and cellular mechanisms that account for the clinical efficacy of PD-L1 and PD-1 blockade (1, 2), we used mice with varying immune repertoires, including Rag1tm1Mom (Rag1–/–),
NOD.SCID γc–deficient (NSG), PD-L1 genetically deficient (PD-L1–/–), and PD-1 genetically deficient (PD-1–/–) mice for studying
PD-L1 and PD-1 signaling blockade in MC38, ID8, B16-F10, and LLC tumor models. Tumor transplantation into Rag1–/–, NSG,
PD-L1–/–, and PD-1–/– mice abrogated the therapeutic efficacy of
anti–PD-L1 or anti–PD-1 mAb treatment. Moreover, we
demon-strate the importance of PD-L1 expression on antigen presenting cells (APCs), particularly dendritic cells (DCs) and macrophages in the tumor microenvironment and draining lymph nodes, in PD-L1 and PD-1 blockade efficacy in multiple tumor-bearing mouse models and patients with melanoma and ovarian cancer. Thus, the host immune system is indispensable for PD-L1 and PD-1 blockade therapy, and the host DCs and macrophages, rather than cancer cell–intrinsic PD-L1, may mechanistically account for potential therapeutic efficacy of PD-L1 signaling blockade.
Results
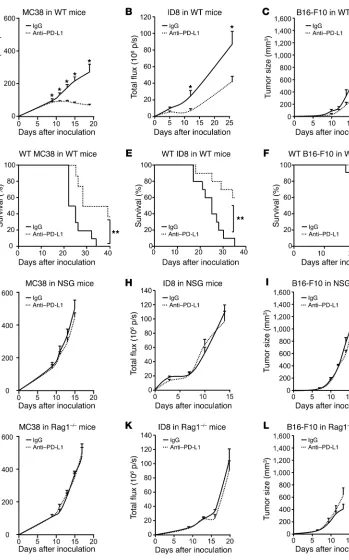
Host immunity determines anti–PD-L1–induced tumor immunity. To
determine whether host immunity plays a role in the efficacy of anti–PD-L1 therapy, we inoculated MC38 colon cancer, ID8 ovari-an covari-ancer, B16-F10 melovari-anoma, ovari-and LLC lung covari-ancer cells into WT (Figure 1, A–F), NSG (Figure 1, G–I), and Rag1–/– mice (Figure 1,
J–L) and treated these mice with anti–PD-L1 mAb. PD-L1 block-ade reduced tumor volume in WT mice bearing MC38, ID8, and B16-F10 (Figure 1, A–C) and improved mouse survival (Figure 1, D–F). Interestingly, WT mice bearing different tumors variably responded to anti–PD-L1 mAb treatment. The therapeutic efficacy was gradually less in the order of MC38, ID8, and B16-F10 (Figure 1, A–C), whereas anti–PD-L1 had no effect on LLC tumor in WT mice (Supplemental Figure 1A; supplemental material available online with this article; https://doi.org/10.1172/JCI96113DS1). As expected, the antitumor effect of anti–PD-L1 was abolished in NSG mice (Figure 1, G–I). As innate and adaptive immunity is defi-cient in NSG mice and innate immune cells remain functional in Rag1–/– mice, we examined the effect of anti–PD-L1 in Rag1–/– mice
Programmed death-1 ligand (PD-L1, B7-H1) and programmed cell death protein 1 (PD-1) pathway blockade is a promising therapy for treating cancer. However, the mechanistic contribution of host and tumor PD-L1 and PD-1 signaling to the therapeutic efficacy of PD-L1 and PD-1 blockade remains elusive. Here, we evaluated 3 tumor-bearing mouse models that differ in their sensitivity to PD-L1 blockade and demonstrated a loss of therapeutic efficacy of PD-L1 blockade in immunodeficient mice and in PD-L1– and PD-1–deficient mice. In contrast, neither knockout nor overexpression of PD-L1 in tumor cells had an effect on PD-L1 blockade efficacy. Human and murine studies showed high levels of functional PD-L1 expression in dendritic cells and macrophages in the tumor microenvironments and draining lymph nodes. Additionally, expression of PD-L1 on dendritic cells and macrophages in ovarian cancer and melanoma patients correlated with the efficacy of treatment with either anti–PD-1 alone or in combination with anti–CTLA-4. Thus, PD-L1–expressing dendritic cells and macrophages may mechanistically shape and therapeutically predict clinical efficacy of PD-L1/PD-1 blockade.
Host expression of PD-L1 determines efficacy of PD-L1
pathway blockade–mediated tumor regression
Heng Lin,1 Shuang Wei,1 Elaine M. Hurt,2 Michael D. Green,3 Lili Zhao,4 Linda Vatan,1 Wojciech Szeliga,1 Ronald Herbst,2 Paul W. Harms,5,6 Leslie A. Fecher,7 Pankaj Vats,5,8 Arul M. Chinnaiyan,5,8,9,10 Christopher D. Lao,7 Theodore S. Lawrence,3,10 Max Wicha,7,10 Junzo Hamanishi,11 Masaki Mandai,11 Ilona Kryczek,1 and Weiping Zou1,5,10,12
1Department of Surgery, University of Michigan School of Medicine, Ann Arbor, Michigan, USA. 2Oncology Research, MedImmune LLC, One MedImmune Way, Gaithersburg, Maryland, USA. 3Department of
Radiation Oncology, 4Department of Biostatistics, 5Department of Pathology, 6Department of Dermatology, and 7Department of Medicine, 8Michigan Center for Translational Pathology, 9Howard Hughes Medical Institute, and 10University of Michigan Comprehensive Cancer Center, University of Michigan School of Medicine, Ann Arbor, Michigan, USA. 11Department of Gynecology and Obstetrics, Kyoto University Graduate School of Medicine, Kyoto, Japan. 12Graduate Programs in Immunology and Cancer Biology, University of Michigan School of Medicine, Ann Arbor, Michigan, USA.
Related Commentary: p. 570
Conflict of interest: M. Wicha and W. Zou received a sponsored research grant from MedImmune. J. Hamanishi and M. Mandai received Nivolumab and its safety data in their physician-initiated clinical trial (UMIN000005714) from Ono Pharmaceutical Co. and Bristol-Myers Squibb. L.A. Fecher received clinical trial funding from Bristol Myers Squibb.
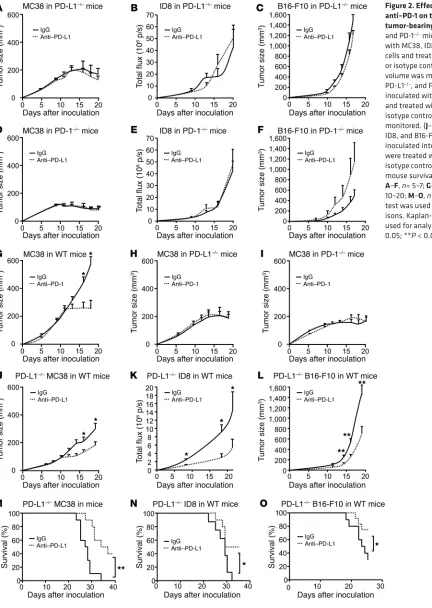
pensable for the therapeutic efficacy of anti–PD-L1 treatment (Figure 1), we next examined the role of host PD-L1 and PD-1 in anti–PD-L1–induced tumor immunity. To this end, we treated MC38-, ID8-, and B16-F10–bearing PD-L1–/– and PD-1–/– mice
with anti–PD-L1 mAb. We found that the therapeutic effect of anti–PD-L1 mAb was abolished in PD-L1–/– (Figure 2, A–C)
and PD-1–/– mice (Figure 2, D–F). Similar experiments were
performed with anti–PD-1 treatment. Anti–PD-1 treatment reduced MC38 tumor growth in WT mice (Figure 2G), but not (Figure 1, J–L). Again, anti–PD-L1 treatment had no antitumor
effect in Rag1–/– mice (Figure 1, J–L). Similarly to what occurred
in WT mice, anti–PD-L1 had no effect on LLC tumor in NSG and Rag1–/– mice (Supplemental Figure 1, B and C). The data indicate
that the therapeutic efficacy of anti–PD-L1 treatment requires an intact adaptive immune system and suggest that the magnitude of the effect varies between tumor histologies.
Host PD-L1 and PD-1 determines anti–PD-L1–induced tumor immunity. Having identified the host immune system as
indis-Figure 1. Effect of anti– PD-L1 on tumor growth in tumor-bearing mice. (A–L) WT, NSG, and Rag1–/– mice were
inoculated with MC38, ID8, and B16-F10 tumor cells. Treatment with anti–PD-L1 or isotype control (rIgG1) was initiated on day 3 and continued every 3 days. Tumor volume and mouse survival were monitored. A–C,
n= 8–11; D–F, n= 10–11; G–L,
n = 5–11. Wilcoxon test was
[image:3.585.46.395.50.610.2]and F) tumor–bearing PD-L1–/– and PD-1–/– mice, we observed a
reduced ID8 tumor growth in PD-L1–/– and PD-1–/– mice
(Sup-plemental Figure 2B). Thus, host PD-L1 and PD-1 and the host immune system may be essential for PD-L1 and PD-1 blockade– induced tumor immunity.
in PD-L1–/– (Figure 2H) and PD-1–/– (Figure 2I) mice.
Regard-less of PD-L1 signaling blockade, MC38 tumor started regres-sion on day 17 in PD-L1–/– and PD-1–/– mice (Figure 2, A, D, H, I,
[image:4.585.48.480.55.663.2]and Supplemental Figure 2A). Although tumor regression did not occur in ID8 (Figure 2, B and E) and B16-F10 (Figure 2, C
Figure 2. Effect of anti–PD-L1 and anti–PD-1 on tumor volume in tumor-bearing mice. (A–F) PD-L1–/–
and PD-1–/– mice were inoculated
with MC38, ID8, and B16-F10 tumor cells and treated with anti–PD-L1 or isotype control (rIgG1). Tumor volume was monitored. (G–I) WT, PD-L1–/–, and PD-1–/– mice were
inoculated with MC38 tumor cells and treated with anti–PD-1 or isotype control. Tumor volume was monitored. (J–O) PD-L1–/– MC38,
ID8, and B16-F10 tumor cells were inoculated into WT mice. Mice were treated with anti–PD-L1 or isotype control. Tumor volume and mouse survival were monitored.
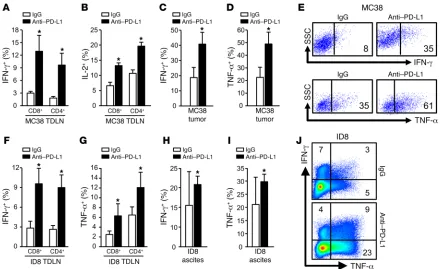
anti–PD-L1 treatment also increased IFN-γ+ and TNF-α+ T cells in
ID8 TDLNs (Figure 3, F and G) and ID8 tumor ascites (Figure 3, H–J). Anti–PD-L1 treatment had no antitumor effect in PD-L1–/–
(Figure 2, A–C) and PD-1–/– (Figure 2, D–F) mice. Consistent with
this, anti–PD-L1 therapy did not affect T cell effector cytokine expression in MC38 TDLNs (Supplemental Figure 3, A and B), MC38 tumor tissues (Supplemental Figure 3, C–E), and ID8 tumor ascites (Supplemental Figure 3, F and G) in tumor-bearing PD-L1–/–
and PD-1–/– mice. In addition, we observed spontaneous tumor
regression in PD-L1–/– and PD-1–/– mice bearing MC38 (Figure 2, A
and D), not ID8 (Figure 2, B and E), and B16-F10 (Figure 2, C and F). In line with this, there were comparable levels of tumor T cell infiltration in ID8 and B16-F10 tumor–bearing PD-L1–/– mice and
WT mice, whereas higher levels of tumor T cell infiltration and cytokine production were found in MC38-bearing PD-L1–/– mice
compared with WT mice (Supplemental Figure 3, H–K). Thus, in addition to differential tumor cell immunogenicity among MC38, ID8, and B16-F10, T cell activation status in PD-L1–/– mice may
potentially explain why MC38 could spontaneously regress in PD-L1–/– mice. Nonetheless, the data indicate that the therapeutic
efficacy of anti–PD-L1 treatment is associated with potent T cell immunity in tumor and TDLNs and depends on intact host PD-L1– and PD-1–signaling pathways.
APCs express high levels of functional PD-L1. After we
demon-strated the importance of host PD-L1 in anti–PD-L1–mediated anti-tumor immunity (Figure 2), we next analyzed PD-L1 expression and function in host immune cell subsets in vivo in tumor-bear-ing mice. Flow cytometry analysis demonstrated that 20%–40% CD45+ immune cells expressed PD-L1 in MC38 tumor tissues and
We next examined the potential involvement of tumor cell PD-L1 in anti–PD-L1 therapy. PD-L1–deficient (PD-L1–/–) MC38,
ID8, and B16-F10 tumor cells were made using the Crisp-Cas9 system. WT, but not PD-L1–/– MC38, ID8, and B16-F10 cells
effi-ciently expressed PD-L1 in response to IFN-γ (Supplemental Fig-ure 2, C–E). WT and PD-L1–/– tumor cells exhibited similar growth
kinetics in NSG and Rag1–/– mice (Supplemental Figure 2, F–I).
We next inoculated these cells into WT mice and treated these mice with anti–PD-L1 mAb. Anti–PD-L1 treatment reduced tumor growth in mice bearing PD-L1–/– MC38 (Figure 2J), ID8 (Figure
2K), and B16-F10 (Figure 2L) tumor cells and increased mouse survival (Figure 2, M–O). Notably, we detected no PD-L1 expres-sion in PD-L1–/– MC38 cells in vivo (Supplemental Figure 2J).
Fur-thermore, we ectopically expressed PD-L1 in MC38 (Supplemen-tal Figure 2K), inoculated these tumor cells into PD-L1–/– mice, and
treated these mice with anti–PD-L1 mAb. Anti–PD-L1 treatment had no effect on tumor growth in mice bearing ectopic PD-L1– expressing MC38 (Supplemental Figure 2L). Thus, host but not tumor PD-L1 expression is indispensable for the therapeutic effi-cacy of anti–PD-L1 treatment.
Anti–PD-L1 treatment activates T cells in tumor and draining lymph nodes. Given that anti–PD-L1 treatment induced an
antitu-mor effect in vivo in tuantitu-mor-bearing WT mice, we studied T cell tumor immunity in tumor-draining lymph nodes (TDLN) and the tumor microenvironment in mice treated with anti–PD-L1 thera-py. We found that in MC38-bearing WT mice, anti–PD-L1 therapy induced potent IFN-γ+ and IL-2+ CD4+ and CD8+ T cells in TDLNs
(Figure 3, A and B) and increased IFN-γ+ and TNF-α+ T cells in
[image:5.585.73.513.55.324.2]MC38 tumor tissues (Figure 3, C–E). In line with the MC38 model,
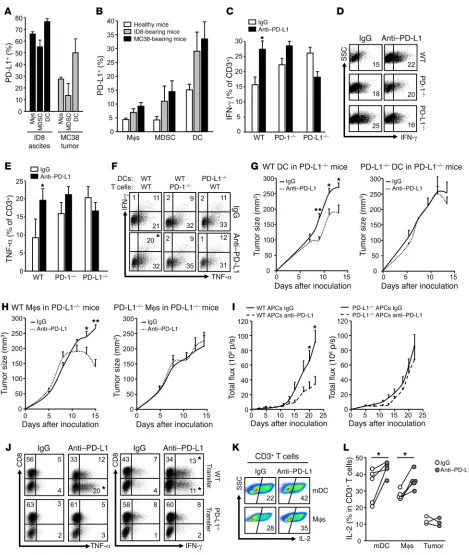
Figure 4. Expression and role of APC PD-L1 in immunosuppression. (A and B) PD-L1 expression in immune cells in MC38 tumors and ID8 ascites (A) and TDLNs (B). PD-L1 expression was analyzed by flow cytometry analysis in immune cell subsets in tumor tissues. Data are expressed as mean ± SEM. n = 3. (C–F) Effect of anti–PD-L1 on T cell effector cytokine expression. WT, PD-1–/–, and PD-L1–/– splenocytes were activated with anti-CD3, anti-CD28, and anti–PD-L1 or isotype
control. T cell IFN-γ (C and D) and TNF-α (E) production were measured by flow cytometry. Results are expressed as mean ± SEM (n = 3). t test was used for 2-way comparisons. *P < 0.05. (F) Effect of anti–PD-L1 on T cell effector cytokine expression. WT and PD-1–/– T cells were activated in the presence of WT or PD-L1–/– DCs.
T cell IFN-γ and TNF-α production in T cells in the presence of anti–PD-L1 or isotype control. Representative replicates are shown. n = 3. t test was used for 2-way comparisons. *P < 0.05. (G and H) PD-L1–/– mice were adoptively transferred with WT or PD-L1–/– DCs or macrophages. Mice were given MC38 tumor cells and
treat-ed with anti–PD-L1 or isotype control (rIgG1). n = 3–7. Tumor volume was monitortreat-ed. Wilcoxon test was ustreat-ed for 2-way comparisons. *P < 0.05; **P < 0.01. (I and
J) ID8 tumor–associated peritoneal WT and PD-L1–/– APCs were transferred into ID8 tumor–bearing PD-L1–/– mice. These mice were treated with anti–PD-L1 and
ID8 tumor ascites (Supplemental Figure 4A). We further divided CD45+ immune cells into macrophages, myeloid-derived
suppres-sor cells (MDSCs), DCs, and CD45+CD90+ lymphocytes
(Sup-plemental Figure 4B). We found high levels of PD-L1 expression on MC38 and ID8 tumor–associated macrophages, MDSCs, and DCs, but not on CD45+CD90+ lymphocytes (Supplemental Figure
4C and Figure 4A). DCs expressed the highest levels of PD-L1 in MC38 and ID8 tumor tissues (Supplemental Figure 4C and Figure 4A). As a negative control, no immune cells expressed PD-L1 in MC38-bearing PD-L1–/– mice (Supplemental Figure 4C). High
lev-els of PD-L1 expression were also found in macrophages, MDSCs, and DCs in TDLNs in MC38 and ID8 tumor–bearing mice, but not in healthy mice (Figure 4B). Notably, although the antitumor effect of anti–PD-L1 therapy depends on host PD-L1 (Figure 2), PD-L1 expression was detected in MC38, ID8, B16-F10, and LLC tumor cells in vivo in WT and PD-L1–/– mice (Supplemental Figure
4D). Thus, tumor-associated APCs are the major PD-L1+ immune
cells and are the major immune targets of anti–PD-L1 therapy. To further solidify the role of host PD-L1 and PD-1 in PD-L1 blockade–mediated T cell immunity, we activated total WT, PD-L1–/–, and PD-1–/– splenocytes in the presence of anti–PD-L1.
PD-L1 blockade increased T cell IFN-γ (Figure 4, C and D) and TNF-α (Figure 4E) expression in WT T cells, but not in PD-L1–/– or
PD-1–/– T cells (Figure 4, C–E). As DCs expressed the highest
lev-els of PD-L1 in tumor-bearing mice, we activated WT and PD-1–/–
T cells with sorted WT and PD-L1–/– DCs from MC38
tumor–bear-ing mice in the presence of anti–PD-L1. Anti–PD-L1 enhanced T cell effector cytokine expression in WT DC and WT T cell culture, but not in PD-L1–/– DC and/or PD-1–/– T cell culture (Figure 4F). To
define the role of PD-L1 on APCs in vivo, we transferred PD-L1+/+
and PD-L1–/– DCs and macrophages into MC38 or ID8 tumor–
bearing PD-L1–/– mice and treated these mice with anti–PD-L1
mAb. We detected the transferred APCs in the tumor microen-vironments (Supplemental Figure 4E). Transfusion of PD-L1+/+
DCs and macrophages, but not PD-L1–/– DCs and macrophages,
enabled antitumor effects of anti–PD-L1 therapy, as shown by reduced tumor growth (Figure 4, G–I), and increased effector cytokine–expressing T cells (Figure 4J) in PD-L1–/– mice bearing
MC38 and ID8 models. Furthermore, when we directly compared tumor growth in PD-L1–/– mice with or without PD-L1–proficient
(WT) DC transfusion, we observed that transfer of WT DCs caused an increase in tumor growth and that anti–PD-L1 therapy abolished this effect (Supplemental Figure 4F). The data provide additional support for an immunosuppressive role of PD-L1–pro-ficient APCs. Next, we tested the role of human APC and tumor cell PD-L1 in T cell activation in vitro. We activated and cultured human peripheral blood T cells with DCs, macrophages, and radi-ated ovarian cancer cells in the presence of antihuman PD-L1. As expected, DCs and macrophages, but not tumor cells, efficiently activated T cells, as shown by high levels of T cell IL-2 expression. Anti–PD-L1 treatment enhanced T cell IL-2 production induced by DCs and macrophages, but not by tumor cells (Figure 4, K and L). Thus, the data suggest that anti–PD-L1 may target APCs to enhance antitumor immunity.
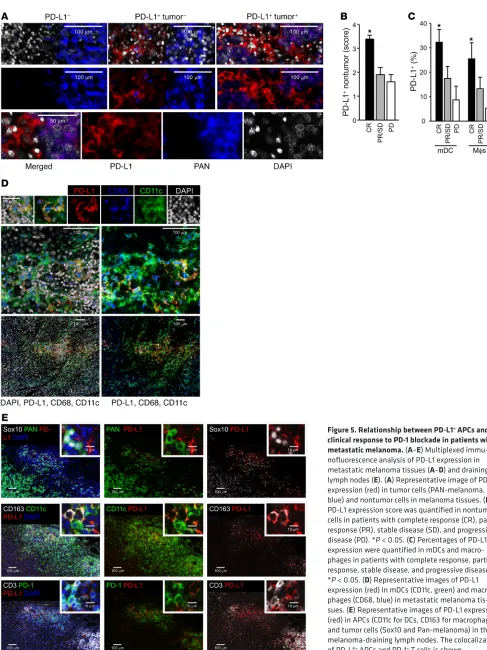
PD-L1+ APCs correlate with clinical efficacy of PD-L1 and PD-1
blockade. To determine the relevance to clinical care, we examined
a cohort of locally advanced and metastatic melanoma patients
treated with PD-1 and CTLA4 checkpoint blockade (Supplemen-tal Table 1). Using multicolor immunofluorescence staining, the distribution of PD-L1 expression in tumor and nontumor cells on pretreatment melanoma biopsies was determined. Three patterns of expression emerged: (a) 4% of patients had no expression of PD-L1 on tumor or nontumor cells; (b) 73% of patients had PD-L1 expression restricted to nontumor cells; and (c) 23% of patients had PD-L1 expression on both tumor and nontumor cells (Figure 5A and Supplemental Figure 5A). We quantified PD-L1 expression levels and obtained a positive correlation between the nontumor PD-L1 expression score and complete clinical responses to dual immune checkpoint therapy (Figure 5B). Phenotypic analysis showed that DCs and macrophages were the major PD-L1+ nontumor cells
(Fig-ure 5, C and D). The percentage of PD-L1+ DCs and PD-L1+
mac-rophages positively correlated with complete clinical responses to treatment (Figure 5, C and D). We analyzed melanoma metastatic lymph nodes and again found that APCs (DCs and macrophages) were the major PD-L1+ cells. PD-L1+ APCs colocalized with PD-1+
T cells in lymph nodes (Figure 5E). We conducted similar studies in ovarian cancer patients treated with PD-1 blockade (Supple-mental Table 2). Interestingly, ovarian cancer cells demonstrated detectable PD-L1 in 35% of patients we examined (Supplemental Table 2 and Supplemental Figure 5B). PD-L1+ DCs, macrophages,
and tumor cells were observed in the ovarian cancer microenviron-ment (Figure 6, A and B). We again quantified PD-L1 expression levels and found a positive correlation between nontumor PD-L1 expression score and general clinical responses to PD-1 blockade (Figure 6C). Furthermore, the percentages of PD-L1+ DCs and
PD-L1+ macrophages positively correlated with general clinical
responses to PD-1 blockade in ovarian cancer patients (Figure 6D). However, ovarian cancer patients have relatively unsatisfactory clinical response to PD-L1 and PD-1 blockade (UMIN000005714) (10). We were not able to further statistically evaluate the relation-ship between PD-L1+ APCs and complete clinical responses due to
insufficient cases of ovarian cancer patients with complete clinical response (Supplemental Table 2). Together, these data suggest that PD-L1+ APCs may correlate with clinical efficacy of PD-1 blockade
in melanoma and ovarian cancer patients.
Discussion
In this work, we have elucidated insight into the cellular media-tors involved in the PD-L1 and PD-1 signaling pathway. First, we stress the essential role of host adaptive immunity in mediating the effects of PD-L1 and PD-1 blockade. Preclinical and clinical correlative studies have demonstrated that PD-L1 and PD-1 path-way blockade is associated with B7 costimulation (11) and efficient T cell infiltration into tumor (12–15). However, this pathway block-ade may also directly target tumor cells and the therapeutic effi-cacy may not solely depend on the host immune system (16). As the antitumor effect of anti–PD-L1 is abolished in Rag1–/– and NSG
mice bearing multiple tumors, we conclude that the host adaptive immune system is essential for PD-L1 and PD-1 blockade–mediat-ed antitumor immunity.
sion, whereas anti–PD-L1 mAb remains therapeutically effective in mice bearing PD-L1–/– tumors and PD-L1+/+ APC transfer enables
the therapeutic effect of anti–PD-L1 mAb in PD-L1–/– mice. In line
with early cancer patient studies (26–29), PD-L1 is expressed on APCs in TDLNs and the tumor microenvironment and PD-L1+/+
APCs inhibit T cell activation in a PD-L1– and PD-1–depen-dent manner. Notably, we have observed spontaneous tumor regression and reduced tumor growth in PD-L1–/– and PD-1–/–
mice bearing MC38 and ID8 tumors, respectively. This phenome-non is associated with enhanced T cell activation in PD-L1–/– and
PD-1–/– mice as compared with WT mice. In addition, differential
tumor cell numbers and tumor immunogenicity may potentially be involved in determining different levels of tumor outcomes in the MC38-bearing mouse model (30, 31). Thus far, clinical studies with the PD-L1 and PD-1 blockade have not rigorously examined or specifically quantified PD-L1 expression on APC subsets ver-sus tumor cells in TDLNs and tumor tissues in cancer patients (2). Our data suggest that PD-L1 and PD-1 blockade not only targets the T cell effector phase in the tumor microenvironment, but also (17, 18). Despite this, Abs against PD-1 and PD-L1 appear to have
comparable clinical efficacy and toxicity (2). As our preclinical data showed that PD-L1 and PD-1 blockade efficacies are abolished in both PD-1–/– and PD-L1–/– mice, the PD-1 and PD-L1 axis may be the
major therapeutic signaling target in cancer patients.
Finally, these studies suggest an essential role of the host PD-L1 and PD-1 pathway in PD-L1 and PD-1 blockade therapy. Many correlative studies have linked tumor tissue PD-L1 expression (including PD-L1 expression in all types of cells) with improved response rate to PD-L1 and PD-1 blockade in patients with cancers (19–24). However, whether tumor cell–intrinsic PD-L1 expression or the host PD-L1 and PD-1 signaling accounts for this effect has been unclear. Furthermore, cancer patients with PD-L1–negative tumors can respond to PD-L1 and PD-1 blockade (2, 21, 22, 25). Across multiple cancer types, responses to anti–PD-L1 therapy are frequent in patients with high PD-L1 expression in tumor-infiltrat-ing immune cells in the course of tumor regression (14, 15, 23). We show that PD-L1 blockade fails to induce antitumor immunity in PD-L1–/– mice bearing tumor cells with high tumor PD-L1
expres-Figure 6. Relationship between PD-L1+ APCs and clinical response to PD-1 blockade in patients with ovarian carcinoma. (A–D) Multiplexed
[image:9.585.78.501.55.422.2]flank of male mice. Tumor diameters were measured using calipers. Tumor volume was calculated. For the ID8 tumor model, lucifer-ase-expressing ID8 cells were injected into the peritoneal cavity of female mice. Tumor progression was monitored 2 to 3 times per week using the Xenogen IVIS Spectrum In Vivo Bioluminescence Imaging System (PerkinElmer). Tumor load was calculated based on the total flux (photons per second [p/s]). Anti–PD-L1, IgG1 isotype Ab, anti– PD-1, or IgG2a isotype Ab (MedImmune) were given intraperitoneally at a dose of 100 μg per mouse on day 3 after tumor cell inoculation, then every 3 days for the duration of the experiment.
Ex vivo and in vitro mouse and human studies. Tumor-bearing mice
were treated with anti–PD-L1, anti–PD-1, and isotype control. Sin-gle-cell suspensions were prepared from fresh TDLNs and tumor tis-sues from these treated mice. Ex vivo T cell effector cytokines were determined by intracellular staining and analyzed by flow cytometry analysis. In some cases, WT, PD-1–/–, or PD-L1–/– splenocytes (106/ml)
were activated with anti-CD3 (8 μg/ml) and anti-CD28 (4 μg/ml) in the presence of anti–PD-L1 (10 μg/ml) or isotype control (10 μg/ml) for 5 days. The cells were subject to surface marker and intracellular cytokine staining and analyzed by flow cytometry analysis. Similar experiments were conducted with isolated and sorted CD11c+ DCs and CD3+ T cells.
Human DCs and macrophages were generated from peripheral blood monocytes with 20 ng/ml GM-CSF and 5 ng/ml IL-4 (R&D Sys-tems) and 10 ng/ml M-CSF, respectively (40). Human peripheral blood T cells were stimulated for 5 days with anti-CD3 and anti-CD28 in the presence of IFN-γ–activated DCs, macrophages, or fixed primary ovar-ian cancer cells (41, 42). Antihuman PD-L1 and isotype controls were added at the beginning of culture (26). The cells were subject to sur-face-marker and intracellular cytokine staining and analyzed by flow cytometry analysis.
CRISPR gene targeting. Gene targeting by CRISPR/Cas9 was
accomplished by transfection of Cas9 plasmid pSpCas9(BB)-Puro (Addgene, catalog 62988) with the guide sequence and with the puro-mycin selection marker. Successful PD-L1 targeting was determined by sequencing the cell clones and flow cytometry screening of clones treated with and without 10 ng/ml IFN-γ (PeproTech) for PD-L1 expres-sion. Multiple PD-L1–deficient clones were pooled. Cell clones trans-fected with Cas9 plasmid carrying scramble guide sequence were also pooled as controls. Guide RNA sequences for targeting of PD-L1 were
as follows: 5′-GTATGGCAGCAACGTCACGA-3′; 5′
-GGCTCCAAAG-GACTTGTACG-3′; 5′-GACTTGTACGTGGTGGAGTA-3′. Guide RNA
sequence for scramble targeting was 5′
-GCACTACCAGAGCTAACT-CA-3′ (Origene Technologies).
Flow cytometry analysis. Single-cell suspensions were prepared
from fresh mouse tumor tissues or TDLNs. Cells were stained with specific Abs against mouse CD45 (30-F11), CD90 (53-2.1), CD4 (RM4-5), CD8 (53-6.7), CD11c (HL3), CD11b (M1/70), and Gr-1 (RB6-8C5) to define CD45+CD90+CD8+ or CD4+ T cells, CD45+CD90–
Gr-1–CD11b+/–CD11cbright DCs, CD45+CD90–Gr-1–CD11b+CD11c+/–
macrophages, and CD45+C D90–Gr-1+CD11b+CD11c+/– MDSCs. T cell
cytokine expression was determined by intracellular staining, and Abs against mouse IL-2 (JES6-5H4), IFN-γ (XMG1.2), and TNF-α (MP6-XT22) were used. All flow samples were acquired through LSR II (BD), and data were analyzed with DIVA software (BD Biosciences).
Western blot. Cells or tissue samples were lysed. Total protein
was separated by SDS/PAGE and transferred to a PVDF membrane by electroblotting. PD-L1 proteins were determined by using ECL uncovers a role in the T cell–priming phase in TDLNs. Further, APC
expression of PD-L1 offers an explanation for why patients with PD-L1–negative tumors can respond to PD-L1 and PD-1 blockade therapy (32). However, ectopic PD-L1 expression in P815 tumor cells is reported to be linked with increased tumor load in mouse models (33, 34). We do not exclude a protumor role of high levels of tumor PD-L1 in vivo in mice. Given the potential critical effect of IFN-γ signaling in PD-L1 stimulation and therapeutic resistance (35), it is possible that the expression levels of PD-L1 in APCs and tumor cells may be synchronously regulated by IFN signaling and positively correlate in the same tumor microenvironment. There-fore, tumor PD-L1 expression would indirectly function as a bio-marker for therapeutic responses to PD-L1 and PD-1 blockade for some cancer patients. Furthermore, we have found that (a) in the absence of host PD-L1, PD-L1 blockade remains ineffective in mice bearing tumor cells with enforced PD-L1 expression, (b) anti–PD-L1 treatment has no effect on human T cell activation in the presence of PD-L1+ human tumor cells, and (c) PD-L1+ APCs
positively correlate with clinical responses in melanoma and ovar-ian cancer patients treated with PD-1 blockade. Nonetheless, giv-en that we have studied limited numbers of cancer patigiv-ents who received the PD-L1 and PD-1 blockade therapy, the role of PD-L1 expression in tumor cells versus host immune cells deserves fur-ther mechanistic and fur-therapeutic investigations in cancer patients. In summary, our data suggest that PD-L1+ APCs may
mecha-nistically shape and therapeutically predict efficacy of PD-L1 and PD-1 blockade. Thus, it may be important to quantify APC PD-L1 in tumor tissues and TDLNs to predict and improve patient selec-tion for PD-L1 and PD-1 blockade therapy.
Methods
Patients with melanoma and ovarian cancer. Twenty-six patients
diag-nosed with melanoma (8 locally advanced and 18 metastatic) received simultaneous treatment of the anti–PD-1 Ab (Nivolumab) and the anti–CTLA-4 Ab (Ipilimumab) at the University of Michigan Hospital. Twenty-three tumor samples were collected before treatment, 2 during treatment, and 1 after treatment. Seventeen patients diagnosed with ovarian carcinomas (12 cases of high-grade serous ovarian carcinoma, 3 cases of endometrioid ovarian carcinomas, 2 cases of ovarian clear-cell carcinoma) received the anti–PD-1 Ab (nivolumab) at the Kyoto University Hospital (UMIN000005714) (10). Ovarian tumor sam-ples were collected before treatment. Clinical response patterns were defined based on RECIST criteria (http://www.irrecist.com/recist/). Consecutive 6-μm–thick tissue sections were cut and placed on charged poly-l-lysine–coated slides for immunohistochemistry analyses.
Mouse cancer cell lines. Mouse melanoma cell line B16-F10 and
lung cancer cell line LLC were purchased from ATCC. Mouse colon cancer cell line MC38 (36) and ovarian cancer cell line ID8 (37) were previously reported. All cell lines were regularly examined for myco-plasma contamination.
In vivo mouse models. Six- to eight-week-old NSG, Rag1tm1Mom
(Rag1–/–), and WT C57BL/6 mice were obtained from the Jackson
Lab-oratory. PD-L1–/– mice were originally from Lieping Chen (Yale
Univer-sity, New Haven, Connecticut, USA) (38). PD-1–/– mice were originally
were scanned and quantified in each individual immune cell subset in the entire tissue section. The following Abs were used: PD-L1 (E1L3N, Cell Signaling Technology), CD11c (EP1347Y, Abcam), CD68 (KP1, Dako), CD163 (10D6, Abcam), PAN-melanoma Ab (HMB45/DT101/ BC199/T311, ab733, Abcam), and pan keratin (AE1/AE3, Dako).
Statistics. Wilcoxon rank-sum test, 2 tailed t test, and χ2 tests were
used to compare 2 independent groups. Survival functions were estimat-ed by Kaplan-Meier methods and comparestimat-ed using the log-rank test. All analyses were done using SAS 9.3 software or GraphPad Prism. P < 0.05 was considered significant. Sample size was determined on the basis of animal experimental trials and in consideration of previous publications on similar experiments to allow for confident statistical analyses. Unless noted, samples were independent biological replicates.
Study approval. All human tissues in this study were obtained with
the approval of IRBs and patients’ consent or were archival tissue col-lected for routine diagnostic purposes and used under IRB-approved waivers of consent. Patients and healthy individuals were recruited through the University of Michigan Hospital or Kyoto University Hos-pital. Informed consent was obtained from all patients and healthy individuals prior to sample collection. All animal experiments were performed according to protocols approved by the Institute of Univer-sity of Michigan Committee on Use and Care of Animals (UCUCA).
Author contributions
HL, EMH, RH, MW, IK, and WZ designed the experiments. HL, IK, and WZ wrote the paper. HL, SW, LV, WS, and IK performed the experiments. HL, IK, and LZ analyzed data. EMH and REH provided reagents. MDG, PWH, LAF, PV, AMC, CDL, TSL, MM, and JH conducted clinical trials and provided clinical and patho-logical information on patients with melanoma or ovarian cancer.
Acknowledgments
This work is supported (in part) by NIH grants (CA123088, CA099985, CA156685, CA171306, CA190176, CA193136, CA211016, and 5P30CA46592) and a sponsored research grant from MedImmune. We thank Antoni Ribas and Siwen Hu-Liesko-van (David Geffen School of Medicine at UCLA) for their collabo-ration and intellectual input.
Address correspondence to: Weiping Zou or Ilona Kryczek, Department of Surgery, University of Michigan School of Medi-cine, 109 Zina Pitcher Place, Ann Arbor, Michigan, 48109, USA. Phone: 734.763.6402; Email: [email protected] (W. Zou); [email protected] (I. Kryczek).
reagent (GE Healthcare). See complete unedited blots in the sup-plemental material.
PD-L1 overexpression. MC38 cells were transfected with
len-tivirus encoding PD-L1 (MR203953L2, Origene Technologies) or scrambled control. After transfection, the transfected cells were selected for over 2 weeks, tested for PD-L1 expression, and cultured for the in vivo experiments.
Adoptive transfer experiments. We initially performed adoptive
transfer experiments with bone marrow–derived DCs and macro-phages. Bone marrow from the hind legs of WT or PD-L1–/– mice was
obtained, and erythrocytes were lysed with Red Blood Cell Lysis Buffer (Sigma Aldrich). DCs and macrophages were generated from bone marrow cells with 20 ng/ml GM-CSF and 5 ng/ml IL-4 (R&D Systems) and 10 ng/ml M-CSF, respectively (40). Before adoptive transfer experiment, cells were stimulated with 1 ng/ml IFN-γ for 16 hours. Macrophages or DCs (5 × 10⁶) were intravenously injected
into PD-L1–/– mice on day –1, and MC38 cells (3 × 10⁶) were
subcuta-neously injected into the mice on day 0. An additional macrophage or DC intratumor injection was performed on day 7. In addition, we performed adoptive transfer experiments with ID8 tumor–associat-ed residential APCs. To this end, ID8 tumor cells were injecttumor–associat-ed into peritoneal cavities in WT and PD-L1–/– mice. On day 15, we collected
peritoneal cells from ID8 tumor–bearing mice. CD11c+ and CD11b+
cells were isolated with specific beads and sorted as APCs. APCs (4 × 10⁶) were adoptively transferred into individual ID8
tumor–bear-ing PD-L1–/– mice. Tumor progression was monitored. For tracking
these cells, APCs were collected from CD45.1 mice and were subse-quently transferred into ID8 tumor–bearing CD45.2 mice.
Immunofluorescence staining and analysis. Staining for mouse CD3
(SP7, Abcam) was performed on frozen tumor sections. Alexa Fluor 488–conjugated anti-rabbit secondary Abs (Life Technologies) were used. Staining with isotype Ab was used as a negative control. T cells were counted manually at 10–20 high-power fields under a fluores-cence microscope (Leica). Immunofluoresfluores-cence staining on human paraffin cancer tissue sections was performed with OPAL-4–plex reagents, scanned, and imaged at ×10–40 on the Mantra Automated Quantitative Pathology Imaging System, and analyzed using Inform software (Perkin-Elmer) for the PD-L1 expression score in the entire tissue sections. The score ranking was assessed by the combination of PD-L1 expression intensity and the percentage of PD-L1+ cells within
a specific cell type: 0 for no PD-L1 labeling (or 0%); 1 for single pos-itivity or weak intensity; 2 for 10% pospos-itivity or medium intensity; 3 for 20%–40% positivity or medium intensity; and 4 for greater than 40% positivity or strong intensity. The percentages of PD-L1+ APCs
1. Topalian SL, Drake CG, Pardoll DM. Immune checkpoint blockade: a common denomina-tor approach to cancer therapy. Cancer Cell. 2015;27(4):450–461.
2. Zou W, Wolchok JD, Chen L. PD-L1 (B7-H1) and PD-1 pathway blockade for cancer therapy: Mechanisms, response biomarkers, and combi-nations. Sci Transl Med. 2016;8(328):328rv4. 3. DuPage M, Mazumdar C, Schmidt LM, Cheung
AF, Jacks T. Expression of tumour-specific anti-gens underlies cancer immunoediting. Nature. 2012;482(7385):405–409.
4. Matsushita H, et al. Cancer exome analysis reveals
a T-cell-dependent mechanism of cancer immu-noediting. Nature. 2012;482(7385):400–404. 5. Tran E, et al. Cancer immunotherapy based on mutation-specific CD4+ T cells in a patient with epithelial cancer. Science. 2014;344(6184):641–645. 6. Linnemann C, et al. High-throughput epitope
discovery reveals frequent recognition of neo- antigens by CD4+ T cells in human melanoma.
Nat Med. 2015;21(1):81–85.
7. Robbins PF, et al. Mining exomic sequencing data to identify mutated antigens recognized by adoptively transferred tumor-reactive T cells.
Nat Med. 2013;19(6):747–752.
8. Carreno BM, et al. Cancer immunotherapy. A dendritic cell vaccine increases the breadth and diversity of melanoma neoantigen-specific T cells. Science. 2015;348(6236):803–808. 9. Llosa NJ, et al. The vigorous immune
microenvi-ronment of microsatellite instable colon cancer is balanced by multiple counter-inhibitory check-points. Cancer Discov. 2015;5(1):43–51. 10. Hamanishi J, et al. Safety and antitumor activity
of anti–PD-1 antibody, nivolumab, in patients with platinum-resistant ovarian cancer. J Clin
Oncol. 2015;33(34):4015–4022.
cell death-1 blockade in a murine melanoma synge-neic model requires costimulation, CD4, and CD8 T cells. Cancer Immunol Res. 2016;4(10):845–857. 12. Peng D, et al. Epigenetic silencing of TH1-type chemokines shapes tumour immunity and immu-notherapy. Nature. 2015;527(7577):249–253. 13. Tumeh PC, et al. PD-1 blockade induces
respons-es by inhibiting adaptive immune rrespons-esistance.
Nature. 2014;515(7528):568–571.
14. Powles T, et al. MPDL3280A (anti–PD-L1) treat-ment leads to clinical activity in metastatic blad-der cancer. Nature. 2014;515(7528):558–562. 15. Herbst RS, et al. Predictive correlates of response
to the anti–PD-L1 antibody MPDL3280A in can-cer patients. Nature. 2014;515(7528):563–567. 16. Kleffel S, et al. Melanoma cell-intrinsic PD-1
receptor functions promote tumor growth. Cell. 2015;162(6):1242–1256.
17. Butte MJ, Keir ME, Phamduy TB, Sharpe AH, Freeman GJ. Programmed death-1 ligand 1 interacts specifically with the B7-1 costimulatory molecule to inhibit T cell responses. Immunity. 2007;27(1):111–122.
18. Xiao Y, et al. RGMb is a novel binding partner for PD-L2 and its engagement with PD-L2 promotes respiratory tolerance. J Exp Med. 2014;211(5):943–959.
19. Brahmer JR, et al. Safety and activity of anti– PD-L1 antibody in patients with advanced can-cer. N Engl J Med. 2012;366(26):2455–2465. 20. Topalian SL, et al. Safety, activity, and immune
correlates of anti–PD-1 antibody in cancer.
N Engl J Med. 2012;366(26):2443–2454.
21. Garon EB, et al. Pembrolizumab for the treatment of non-small-cell lung cancer. N Engl J Med. 2015;372(21):2018–2028.
22. Reck M, et al. Pembrolizumab versus
chemother-apy for pd-l1-positive non-small-cell lung cancer.
N Engl J Med. 2016;375(19):1823–1833.
23. Taube JM, et al. Association of PD-1, PD-1 ligands, and other features of the tumor immune micro-environment with response to anti–PD-1 therapy.
Clin Cancer Res. 2014;20(19):5064–5074.
24. Ansell SM, et al. PD-1 blockade with nivolumab in relapsed or refractory Hodgkin’s lymphoma.
N Engl J Med. 2015;372(4):311–319.
25. Brahmer J, et al. Nivolumab versus Docetaxel in advanced squamous-cell non-small-cell lung cancer. N Engl J Med. 2015;373(2):123–135. 26. Curiel TJ, et al. Blockade of B7-H1 improves
myeloid dendritic cell-mediated antitumor immunity. Nat Med. 2003;9(5):562–567. 27. Perrot I, et al. Dendritic cells infiltrating human
non-small cell lung cancer are blocked at imma-ture stage. J Immunol. 2007;178(5):2763–2769. 28. Wu K, Kryczek I, Chen L, Zou W, Welling TH.
Kupffer cell suppression of CD8+ T cells in human hepatocellular carcinoma is mediated by B7-H1/programmed death-1 interactions. Cancer
Res. 2009;69(20):8067–8075.
29. Kuang DM, et al. Activated monocytes in peritu-moral stroma of hepatocellular carcinoma foster immune privilege and disease progression through PD-L1. J Exp Med. 2009;206(6):1327–1337. 30. Juneja VR, et al. PD-L1 on tumor cells is sufficient
for immune evasion in immunogenic tumors and inhibits CD8 T cell cytotoxicity. J Exp Med. 2017;214(4):895–904.
31. Lau J, et al. Tumour and host cell PD-L1 is required to mediate suppression of anti-tumour immunity in mice. Nat Commun. 2017;8:14572. 32. Larkin J, et al. Combined nivolumab and ipilim-umab or monotherapy in untreated melanoma.
N Engl J Med. 2015;373(1):23–34.
33. Dong H, et al. Tumor-associated B7-H1 promotes T-cell apoptosis: a potential mechanism of immune evasion. Nat Med. 2002;8(8):793–800. 34. Iwai Y, Ishida M, Tanaka Y, Okazaki T, Honjo T, Minato N. Involvement of PD-L1 on tumor cells in the escape from host immune system and tumor immunotherapy by PD-L1 blockade. Proc
Natl Acad Sci U S A. 2002;99(19):12293–12297.
35. Shin DS, et al. Primary resistance to PD-1 block-ade mediated by JAK1/2 mutations. Cancer
Dis-cov. 2017;7(2):188–201.
36. Tanikawa T, Wilke CM, Kryczek I, Chen GY, Kao J, Nunez G, Zou W. Interleukin (IL)-10 ablation promotes tumor development, growth metasta-sis. Cancer Res. 2012;72(2):420–429. 37. Roby KF, et al. Development of a syngeneic
mouse model for events related to ovarian can-cer. Carcinogenesis. 2000;21(4):585–591. 38. Dong H, Zhu G, Tamada K, Flies DB, van
Deurs-en JM, ChDeurs-en L. B7-H1 determines accumulation and deletion of intrahepatic CD8(+) T lympho-cytes. Immunity. 2004;20(3):327–336. 39. Nishimura H, Minato N, Nakano T, Honjo T.
Immunological studies on PD-1 deficient mice: implication of PD-1 as a negative regulator for B cell responses. Int Immunol. 1998;10(10):1563–1572. 40. Zou W, et al. Macrophage-derived dendritic cells
have strong Th1-polarizing potential mediated by beta-chemokines rather than IL-12. J Immunol. 2000;165(8):4388–4396.
41. Cui TX, et al. Myeloid-derived suppressor cells enhance stemness of cancer cells by inducing microRNA101 and suppressing the corepressor CtBP2. Immunity. 2013;39(3):611–621. 42. Wang W, et al. Effector T cells abrogate stroma-
mediated chemoresistance in ovarian cancer.