Measuring electricity security risk
Dakpogan, Arnaud and Smit, Eon
University of Stellenbosch Business School
24 September 2018
CHAPTER 2
MEASURING ELECTRICITY SECURITY RISK
*Arnaud Dakpogan, University of Stellenbosch Business School, +27846206077, [email protected]
Eon Smit, University of Stellenbosch Business School, +2721 9184225,
2.1 INTRODUCTION
the security of the transportation and transit of energy to some countries. Transit countries are used by several exporting and importing countries when transporting energy. The absence of violence and terrorism in these countries as well as their political stability matter for safe transportation and transit of energy supply. Energy security in this study will be mostly analyzed from the supply side perspective.
Throughout the literature, most studies which attempt to define the security of energy supply can generally be classified in three main groups. The first group comprises studies which consider security as an interrupted supply of energy commodities. One of the tenants of such definition is
the United Kingdom (UK)’s Department of Energy and Climate Change (DECC). According to
DECC (2009, p. 19): “Secure energy means that the risks of interruption to energy supply, are low”.
Other tenants of such definition of energy security include studies such as Ölz, Sims and Kirchner (2007), Scheepers. Seebregts, de Jong and Maters (2007), Wright (2005), Hoogeveen and Perlot (2007), and Lieb-Dóczy, Börner and MacKerron (2003). A few studies (Billinton and Allan, 1996); Makarov and Moharari, 1999) among the first group introduced the notion of “reliability” to explain the concept of “low interruption risks” stated in the DECC’s (2009) definition of energy security.
According to these studies, the “reliability” of an energy system implies two sub-concepts:
“security” and “adequacy”. An energy system is considered to be secured if it is able to remain
unaffected by risks, and it is considered to be adequate if it is able to ensure consumers’ energy
needs at any time. Unlike DECC (2009), Billinton and Allan (1996) and Makarov and Moharari
(1999), in their framework on “reliability” do not define energy security as a state of “low interruption risks”, rather, they define energy security as the ability of an energy system to resist risks or adapt to change. While there are slight differences in the definition of energy security among studies of the first group, their common view is that a rise in the shortage of energy can be interpreted as energy insecurity.
The second group of studies differentiates between secure and insecure levels of uninterrupted energy supply when defining energy security. Small outages or discontinuity in the supply of energy are not necessarily a risk for energy security. The most known definitions of energy security among this group of studies are those of the International Energy Agency (IEA) and the United Nations Development Program (UNDP). According to IEA (2001, p. 76),“Energy security is defined in terms of the physical availability of supplies to satisfy demand at a given price”. IEA (2007, p. 160) defines energy security as: “adequate, affordable and reliable supplies of energy”,and for IEA (2014, p.13) energy security is the “uninterrupted availability of energy sources at an affordable
interruptions of the energy supply, increases in energy prices above a certain threshold are also considered as energy security risks. However, increases in energy prices below such thresholds
are not considered as energy security risks. A significant number of studies aligns with IEA’s
definitions such as Andrews (2005), Vicini, Gracceva, Markandya and Costantini (2005), Yergin (1988), Luciani (2004), Jun, Kim and Chang (2009), Le Coq and Paltseva (2009), Fondazione Eni Enrico Mattei (FEEM) (2008). Another definition of energy security among this group is that of Mabro (2008, p. 3) who stated the following: “Security is impaired when supplies are reduced or
interrupted in some places to an extent that causes a sudden, significant and sustained increase in
prevailing prices”. His definition implies that interruptions of energy supply can be considered as an energy security risk only if increases in energy prices are beyond a certain threshold. Other studies in the second group included in their definition the occurrence of a predictable or unexpected event which can determine energy security. Significant among these are McCarthy, Ogden and Sperling (2007), Rutherford Scharpf and Carrington (2007) and Spanjer (2007). While most studies of the second group agree on the differentiation between secure and insecure levels of energy supply, they diverge in their identification of a common secured quantity energy supply because secure and insecure levels of energy supply vary from one country to another. A secure level of energy supply in one country can be considered insecure in another country.
Within the third group of studies, first, some studies extended the definition of energy security to the impact on the ability to provide energy services. Their definition of energy security is more focused on the potential impact of energy disruption on the availability of energy services. Significant among them arePatterson (2008), Noel and Findlater (2010),and Li (2005). Findlater and Noel (2010, p. 2) on gas supply security stated the following: “security of gas supply (or gas
supply security) refers to the ability of a country’s energy supply system to meet final contracted energy demand in the event of a gas supply disruption”. Their statement implies that disruption of
resource supply in a sustainable and timely manner with the energy price being at a level that will not adversely affect the economic performance of the economy”.
The differentiation between secure and insecure levels of energy supply and the inclusion of impacts on energy services, the economy and the environment make the definition of energy security very inclusive. However, such inclusiveness is also a disadvantage as it makes the concept of energy security difficult to measure. Although there is no consensus on a unique definition of energy security, all definitions agree on the idea that energy security implies avoiding risks which can lead to an interruption of the supply of energy services, and leave the demand unmet. Such interruption of energy supply varies according to the country, the risk context and the energy type. Hence, it is worth indicating that each country has its own energy security risks and energy security risks vary according to the type of energy. This study will specifically focus on the sustainable security of electricity supply in the Beninese context.
In Benin, electricity supply security risk is mainly related to the inability to cope with sudden disruptions of electricity supply. First, the country has a high dependency on importation of electricity: according to the US EIA (2017), in 2015 around 77.575% of its electricity was imported from neighbouring countries. Hence, the Beninese electricity sector is affected by any outages of electricity supply which occur in its neighbouring countries (exporting countries). Second, the country relies heavily on oil for its domestic electricity generation: according to the World Development Indicators (2017), in 2014 Benin relied on oil to generate 99.45% of its domestic electricity, while the country is not an oil exporter. This high dependency on oil exposes the electricity sector to fluctuations in oil prices. High oil prices constitute a limitation to the country’s
capacity to generate electricity domestically because they increase electricity production costs. In addition, oil, as any other fossil fuel energy, is a limited and non-renewable resource. In the perspective of long-run and sustainable energy security, countries should include in their energy mix an important share of sustainable energy resources such as renewable energy. Increases of the share of renewable electricity in the total domestic generation of electricity will therefore contribute to sustainable electricity supply security. In the case of Benin, however, only 5.55% of the electricity generated domestically came from renewable sources in 2015, and the generation of electricity based on renewable sources has never exceeded such amount over the period 1996-2015. This indicates that in 2015, 94.45% of the electricity generated domestically in Benin came from non-renewable sources. Therefore the sustainability of Benin’s domestic electricity production becomes a concern.
In the context of the Beninese electricity sector, electricity security risks can therefore be defined as exposure of electricity supply to electricity losses, foreign outages of electricity due to high dependency on electricity importation, and fluctuations in the price of oil which is a limited and non-renewable energy resource. Losses of electricity, heavy dependency on importation of electricity, heavy dependency on oil/fossil fuel (a non-renewable energy resource for domestic electricity generation) therefore constitute three major indicators of the vulnerability of the Beninese electricity sector. For this study, four additional indicators will be added. The first is a governance index. The
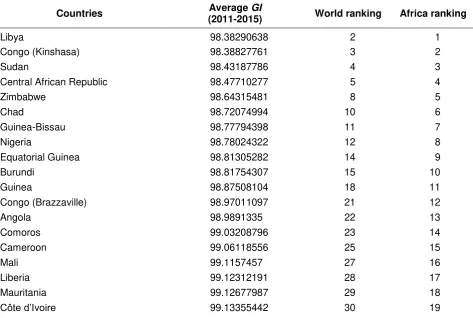
“control of corruption” in a country, the “rule of law”, the “quality of the regulatory system”, the “political stability and absence of violence”, and “government effectiveness”, represent governance
indicators (Worldwide Governance Indicators, 2017) which influence the effectiveness of the delivery of electricity to consumers. The governance index comprises these governance indicators, and each indicator has been converted to positive values by adding 100 for ease of calculation of the index; further explanation is provided in the methodology,section 2.4.1.
The second is the ratio of growth of access to electricity in urban areas to the growth of the urbanization rate. Urbanization rate is defined as the share of the population that lives in urban areas, and is expressed as a percentage of total population. For ease of comparison between growth of the urbanization rate and growth of urban access to electricity, this ratio has been transformed into a ratio with solely positive values by adding 100% to both numerator and denominator (further explanation is provided in the methodology, section 2.4.1); we also multiply the transformed ratio by 100 in order to have all its values as percentages. As reported by IEA (2016), rapid urbanization increases energy consumption; in 2013, cities accounted for 64% of the
world’s use of primary energy. Other studies, such as Sheng, He and Guo (2017) on 78 countries
The third is the rate of access to electricity, which is defined as the ratio of the population that has access to electricity to the total population. For the purpose of simplicity it will be expressed as a percentage. A rate below 100 indicates that the country has a supply gap as there is a proportion of its population that does not have access to electricity. In other words, a proportion of the population is left without electricity and therefore is facing a total disruption of electricity. A value equal to 100 indicates that the entire population of the country has access to electricity and there is no supply gap. Promoting access to electricity can enable a country to minimize the electricity supply gap or total disruption of electricity supply.
The fourth is real GDP per capita (expressed as a percentage of the world annual average real GDP per capita; further explanation is provided in the conceptual framework on electricity supply security and the methodology, sections 2.2.2 and 2.4.1 respectively). It highlights how wealthy the
country is, and indicates the country’s ability to avoid or prevent disruptions of electricity supply by investing in electricity infrastructure and utilities. A country with high GDP per capita is financially more able to invest in electricity utilities in order to reduce or avoid supply disruptions than a country with low GDP per capita. As argued by Ferguson et al. (2000), a positive correlation exists
between countries’ wealth and their electricity consumption.
The aim of this study is to build a composite index of electricity supply security risks, which account for the three major indicators of the vulnerability of the Beninese electricity sector as described above (losses of electricity, heavy dependency on importation of electricity, and heavy dependency on oil/fossil fuel), plus the governance index, the transformed ratio of growth of access to electricity in urban areas to growth of the urbanization rate, the rate of access to electricity, and real GDP per capita (expressed as a percentage of the world annual average real GDP per capita). However we first provide a framework to explain the dimensions of energy supply security in general and the dimensions of electricity supply security in particular.
2.2 CONCEPTUAL FRAMEWORK FOR ENERGY AND ELECTRICITY SUPPLY SECURITY
2.2.1 Conceptual framework for energy supply security
The definitions of energy security have evolved over time according to the context and the types of exposure to energy risks. According to Chevalier (2006), IEA (2007), APERC (2007), and CIEP (2004), four main pillars (“the four As”) characterize energy security: The first is the “availability” of
places where there is political instability, or other geopolitical issues. Although energy might be available to be imported, it may not be easily accessible. On the other hand, energy may be available in a country, but access to such energy by domestic consumers can be a challenge within that country if there are governance issues (corruption, lack of rule of law, poor quality of the regulatory system, political instability and violence) which affect the delivery of energy to consumers. The third pillar is the “affordability” of energy. Although energy might be available and accessible, it may not be easy to purchase it at an affordable price. In the oil industry, affordability of energy is a concern for importing countries, as oil prices are often volatile. Affordability can also
be interpreted as a country’s financial ability to invest in energy infrastructure and provide energy utilities services in order to prevent or avoid supply disruption of energy among its population. Countries that have a high GDP per capita are considered wealthy and able to achieve such a goal, while countries that have low GDP per capita lack the necessary financial resources to enable them to achieve such a goal. “Affordability” is therefore an important aspect of energy
security. The fourth pillar is “acceptability”, which indicates the acceptability of the energy types by society (the production or consumption of such energies should not cause heavy environmental damage to society), and the sustainability of the energies produced or consumed. The production and consumption of many energy types affect the environment. For instance, production and consumption of oil/fossil fuel energy pollute the environment by generating CO2 emissions in the
atmosphere. The generation of electricity using oil also pollutes the atmosphere with CO2
emissions, and CO2 emissions in the atmosphere are one of the climate change issues. Hence,
many countries are concerned about producing and consuming energy without damaging the environment significantly. As explained previously, oil and other types of fossil fuel are limited and non-renewable energy resources. Long-term and sustainable production of electricity/energy implies the use of sustainable energy resources, such as renewable energy. Ellabban, Abu-Rub, and Blaabjerg (2014, p. 749) defined renewable energy as: “energy sources that are continually replenished by nature and derived directly from the sun (such as thermal, photo-chemical, and photo-electric), indirectly from the sun (such as wind, hydropower, and photosyntheticenergystored in biomass), or from other natural movements and mechanisms of the environment (such as geothermal and tidal energy)”. The World Commission on Environment and Development (1987) defined sustainable development as a development which satisfies the needs of the current
generation without jeopardizing future generation’s capability to satisfy their own needs. Renewable energies are unlimited and their stock will still be available for future generations as they can be renewed. Therefore, increases in the share of renewable energy in the total domestic production of energy matters for a sustainable energy supply security.
While previously-mentioned studies have characterized energy security according to concepts of
interruptions of energy supply, while long-run energy security refers to structural patterns of the energy sector, and the causes of energy supply interruptions. The lack of long-term investments to increase energy supply will lead to short-term interruptions of energy supply in the future.
Although the concepts of “availability”, “accessibility”, “affordability” and “acceptability” have been identified as the four pillars of energy security, their importance will evolve over time and according to the context. On one hand, in a world where globalization, multilateralism and market cooperation are the pattern, the issue of energy dependence of one region on another will not matter, as geopolitical issues will be easily solved. The focus will rather be the existence of a sufficient quantity of energy resources and their production costs. In other words, the focus will be on the concepts of “availability” and “affordability”. Conversely, in a world where regionalization and political barriers are the pattern, geopolitical issues will matter. The focus will be on energy independence, as access to energy in politically unstable zones will be an issue. The attention will therefore be on the concept of “accessibility”.
On the other hand, in a world where sustainable development and climate change issues matter and where the production and consumption of energy that has low environmental damage is encouraged, the cost of energy may rise, as there is a tradeoff between targeting environmental goals and low energy cost. Solving such tradeoff will require more innovation in science and technology to reduce the production costs of environmentally safe energy. This will take time. Hence, in such world the focus will be on the concepts of “acceptability” and “affordability”.
2.2.2 Conceptual framework for electricity supply security (electricity supply disruption
risks)
As said in previous sections, the focus in this study is on sustainable electricity supply security, precisely on electricity supply disruption risks. The attention is on both short- and long-run security. Long-term and sustainable electricity security take into account the ability of countries to rely more on renewable energy resources when producing electricity and to be less dependent on importation of electricity. Renewable energy resources are unlimited, while fossil fuel energy resources used in many countries for the production of electricity are limited. In addition, there are always uncertainties related to dependency on importation of electricity. For instance, Ghana is a politically stable country and has been exporting electricity to Benin and Togo for decades. However, because of natural disasters such as droughts which have reduced the level of water in the Akossombo dam of and limited its capacity to produce electricity, Ghana was constrained in 1983, 1994 and 2004 to reduce its export of electricity to Benin and Togo. Therefore, even in the absence of geopolitical issues there are still uncertainties which can affect countries’ importation of
to importation of electricity. They may be exposed to uncertainties related to fluctuation of the international demand for electricity if they are exporters. Security of electricity demand is not the focus of this study; rather the focus is on the supply side of electricity security.
The analysis of electricity supply security will be based on the four pillars of energy security
mentioned previously (“the four As”). The security risks related to these traditional four pillars have been proxied by a variety of indicators. First, on one hand, the electricity security risk related to the
concept of “accessibility” can be proxied by either the share of net imports of electricity in the total domestic supply of electricity, or the rate of electricity supply self-sufficiency. Such rate is defined as the ratio of electricity not imported to total domestic supply of electricity, while the share of net imports of electricity is defined as the ratio of net imports of electricity to total domestic supply of electricity. Because of the negative values of net imports of electricity for exporting countries, and because we will be using a geometric mean to calculate the electricity supply disruption risk index (all numbers must have the same sign, when taking their geometric mean, further explanation is provided in the methodology, section 2.4.1), the rate of electricity supply self-sufficiency has been
chosen as a proxy for security risk related to the concept of “accessibility”. Such rate reflects countries’ ability to be self-sufficient in terms of their domestic electricity supply. It also points out the self-sufficiency gap, in other words the dependency on importation of electricity (in countries that import electricity). A value of such rate below 100 indicates that the country has a deficit of electricity supply and is dependent on importation of electricity. A value equal to 100 indicates that the country has no electricity supply deficit or is self-sufficient in terms of its domestic electricity supply, and a value above 100 indicates that the country has a surplus of electricity supply, in other words, the country is self-sufficient in terms of its domestic electricity supply, and exports its surplus of electricity. Such rate highlights the exposure of importing countries to outages and shortages of electricity occurring in exporting countries. The political stability of exporting countries also matters for easy importation of electricity. It is one of the causes of sudden reductions in exports of electricity within exporting countries, and can be considered as one of the indicators related to the concept of accessibility. However, because of lack of data on exporting countries and the countries to which they supply electricity, the political stability of exporting countries has not been included as a proxy for electricity security risks related to the concept of “accessibility”. In
addition the political stability of exporting countries highlights exclusively the risks related to access to electricity by importing countries: it does not provide any information on the degree of countries’
Benin and Togo. This situation has been the causes of electricity shortages in Benin and Togo. The self-sufficiency rate in terms of domestic electricity supply or the proportion of imported electricity highlights in the case of Benin the exposure of the country to sudden reductions, outages and shortages of electricity occurring in its supplier countries such as Ghana.
On the other hand, the electricity security risk related to the concept of “accessibility” can also be proxied by the quality of governance within a country. As explained previously, the effectiveness of the delivery of electricity to consumers within a country can be influenced by the quality of governance prevailing in such a country. The effectiveness of the delivery of electricity to
consumers influences consumers’ accessibility to electricity. Consequently, the quality of the governance within a country influences consumers’ accessibility to electricity. Five governance
indicators (“control of corruption”, “rule of law”, “quality of the regulatory system”, “political stability and absence of violence”, and “government effectiveness”) (Worldwide Governance Indicators, 2017) have been identified to construct a composite governance index which will be used as a proxy for the concept of “accessibility”.
Second, on one hand, the electricity security risks related to the concept of “availability” can be proxied either by the share of electricity losses in the total supply, or by the rate of electricity efficiency. The rate of electricity efficiency is the ratio of the quantity of electricity that is not lost to the total supply of electricity, while the share of losses of electricity in the total supply of electricity is the ratio of the electricity lost to the total supply of electricity. Losses of electricity reduce the available quantity of electricity generated, and they can be technical or non-technical. Non-technical losses are mostly due to human behaviours such as thefts of electricity, etc. Technical losses are related to the technology used for the transmission and distribution of electricity. Countries should try to invest in electricity-efficient technology for transmission and distribution. The rate of electricity efficiency has been chosen as a proxy for the concept of “availability”: it
highlights countries’ ability to reduce the losses of electricity, and it also points out the electricity
efficiency gap, in other words the proportion of losses of electricity in the total supply.
areas. As said before, the ratio of growth of access to electricity in urban areas to growth of the urbanization rate compares the speed of urban access to electricity to the speed of urbanization expressed as a percentage. If the value is less than 100, it indicates that the available urban supply of electricity may not be able to meet the demand. Conversely, if its value is greater than or equal to 100, it indicates that promoting urban access to electricity can help to satisfy the increased demand for electricity caused by urbanization. The rate of access to electricity indicates the existence or not of a supply gap in the country. As said previously, it is defined as the proportion of the total population that has access to electricity. In other words, it is the ratio of the population that has access to electricity to the total population. If the rate of access to electricity is less than 100%, this indicates that a proportion of the population does not have access to electricity. This situation is due to a supply gap, and indicates that the available electricity in the country is not enough to satisfy the electricity needs of the entire population and the country does not have enough financial resources to provide full access to electricity to its entire population. For the proportion of the population that does not have access to electricity, this situation is comparable to a total and continual disruption of electricity supply. Conversely, if the rate of access to electricity is equal to 100%, this indicates that the entire population of the country has access to electricity. In other words, there is no electricity supply gap or none of the population is facing a total and continual disruption of electricity supply. A country with a high rate of access to electricity has a smaller supply gap of electricity to fill while a country with a low rate has a high supply gap to fill. The rate of access to electricity is therefore a decreasing function of electricity supply gap. In other words, it is a decreasing function of a total and continual disruption of electricity. Increasing access to electricity will contribute to reduce supply gap of electricity or total disruption of electricity supply.
Third, following APERC (2007), we will use the share of renewable electricity in total domestic production of electricity as a proxy of the electricity security risks related to the concept of
“acceptability”. APERC (2007) argued that the share of renewable and nuclear energy in the total supply of energy can be used as an indicator for the concept of acceptability. It represents the
al. (2009) stipulated that a diversity of sources of energy supply enables countries to mitigate risks related to physical disruption of supply.
Fourth, the electricity security risks related to the concept of “affordability” can be proxied by the price of electricity or the share of electricity expenditures in real GDP, or real GDP per capita. Real
GDP per capita indicates countries’ ability to improve the standard of living of their population by
investing in electricity infrastructure and providing utility services such as electricity to their populations with the purpose of preventing or avoiding supply disruption of electricity among these populations. As mentioned before, Ferguson et al. (2000) argued that there is a positive correlation
between countries’ wealth and their energy consumption. Countries that have high real GDP per
capita are more financially capable of investing in electricity infrastructure and utilities in order to avoid disruption of electricity supply among their populations, while countries that have low real GDP per capita are less financially capable of achieving such goals. Real GDP per capita is
therefore an increasing function of countries’ financial ability to finance electricity infrastructure or
indicates that supplying electricity is not very costly, and is affordable by the country. However, if the share of real GDP not dedicated to cover the cost of electricity supply is low, this indicates that supplying electricity is very costly for the country, and affordability of electricity by the country may become an issue if unpredicted negative shocks affect real GDP. Such a situation can result in disruption of electricity supply in the country. Between these two indicators (ratio of the total cost of electricity supply to real GDP and the share of real GDP which is not dedicated to cover the cost of electricity supply), this study uses the share of real GDP which is not dedicated to cover the cost of electricity supply as a proxy for the concept of “affordability”.
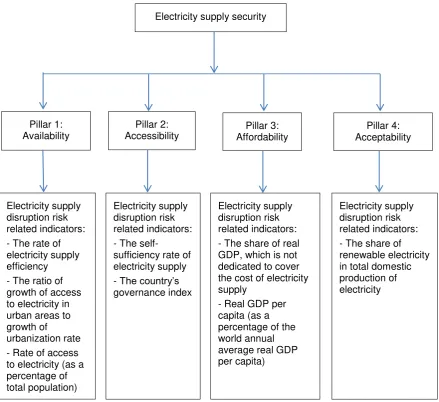
[image:14.595.72.512.349.751.2]Based on these four pillars of energy security and the proxies used as indicators of electricity security risks, the following framework of electricity security (Figure 2.1) has been designed to depict a composite index of electricity supply disruption risks. Before describing the procedure used for the construction of such composite index, it is important to review past studies on energy security indicators and indexes.
Figure 2.1: Summary of conceptual framework for electricity supply security
Electricity supply security
Pillar 1: Availability
Pillar 2:
Accessibility Affordability Pillar 3: Acceptability Pillar 4:
Electricity supply disruption risk related indicators: - The rate of electricity supply efficiency - The ratio of growth of access to electricity in urban areas to growth of urbanization rate - Rate of access to electricity (as a percentage of total population)
Electricity supply disruption risk related indicators: - The
self-sufficiency rate of electricity supply - The country’s governance index
Electricity supply disruption risk related indicators: - The share of real GDP, which is not dedicated to cover the cost of electricity supply
- Real GDP per capita (as a percentage of the world annual average real GDP per capita)
Source: Author’s own conceptualization based on Chevalier (2005), IEA (2007), APERC (2007),
and CIEP (2004)
2.3 review of past studies on energy security indicators and indexes
Throughout the literature, there have been several studies which have attempted to measure energy security. Some have analyzed only one aspect of energy security, while others have attempted to measure several aspects using either an aggregated or a disaggregated indicator. Although many of these indicators have attempted to quantify one or several aspects of energy security, most of them have been designed based on a certain context, and they are subject to improvement or change as contexts evolve.
2.3.1 Studies on disaggregated indicators of energy security
First, the availability or physical existence of energy is important for the security of the energy
supply. As a result, the “resources estimates” has been used as an indicator of the availability of
energy. However, there are issues related to the available quantity of hydrocarbon resources and their possible extraction. Among the few studies which attempted to estimate fossil fuel resources, the United States Geological Survey (USGS, 2000) is the most comprehensive. While some studies, such as Mulders, Hettelaar and van Bergen (2006), argued that USGS (2000) is the most reliable source for energy resource estimates, other studies, such as Greene,Hopson and Li (2005), highlighted the limitations of the USGS (2000) in measuring energy estimates. Hence there is a lack of consensus among studies with regard to the measurement of available resources.
Second, as stipulated byFeygin and Satkin (2004), the reserves to production ratios (R/P ratios or RPRs) has been used as an indicator of security of energy supply in several studies. It can also be defined as the remaining years of production considering the current speed, quantity or level of production. This indicator is highly dependent on time, as both existing reserves and production of energy resources are not static but evolve over time.
Third, another indicator of energy security that has been used is the “diversity index”. The most
comprehensive studies which explained the concept of diversity in the context of energy security, are the Asia Pacific Energy Research Centre (APERC) (2007), Jansen, van Arkel and Boots (2004) andIEA (2004, 2007).Jansen et al. (2004) and APERC (2007) argued that a diversity of energy types and geographical location of production and importation of energy will contribute to reduce energy security risks related to supply. According to IEA (2004, 2007), a diversity of energy suppliers is a way of reducing energy security risks related to market power. A diversity index is therefore a quantitative measurement of either the diversity of energy types and sources of production or the diversity of energy suppliers. Stirling (1999) stipulated that a diversity index comprises three aspects. One aspect, called the “variety”, is defined as the “number of categories”.
called the “disparity”, is defined as “the degree to which categories are different from each other”. In practice, measuring aspects related to disparity are very challenging, hence most diversity
indexes focus on aspects of “variety” and “balance”. One of the limitations of diversity indexes as
indicators of energy security is that they do not capture risks related to each energy type. Each type of energy carries different types of risks. Risks related to electricity supply are not exactly the same as risks related to gas or oil supply. In addition, diversification of energy types, sources and suppliers will not necessarily prevent physical disruption of energy supply. Prices shocks can occur as a result of unexpected geopolitical issues or natural disasters, and can be transmitted from one energy market to another and this can lead to physical disruption of an energy supply.
Fourth, another indicator of energy security that has often been used is “import dependency”, which can be measured for total energy as well as disaggregate energy, and is expressed in monetary form or as a percentage of total or disaggregate energy consumption. In the oil sector, for instance, the total oil imported relative to total oil consumption can be used to indicate “import
dependency” (Alhajji and Williams, 2003). Because some countries import and export oil, gas and/or electricity, it is important to use net imports in the calculation of the “import dependency”
indicator. Net import is obtained after subtracting exports from imports. Net imports reflect
accurately the “import dependency” of the economy in terms of energy. APERC (2007) improved
the “import dependency” indicator by including some diversity aspects: it used an adapted version of the Shanon index to measure both the import dependency and the energy diversity of an economy. In a context of mutual dependency in terms of energy, the international trade of energy, or the energy traded globally, can be used as indicators of mutual dependency. As said in the previous section, in a context of globalization and cooperation, an “import dependency” indicator
will not matter, as there will be fewer barriers to importation of energy. Conversely, in a context of regionalization, an “import dependency” indicator will matter, as there will be political and economic
barriers to importation of energy.
Fifth, another indicator of energy security widely used is the “political stability” of supplier countries. In many countries, the government directly oversees the supply of energy or regulates the energy market. A stable government and fair regulations matter for both importing and exporting countries. Political instability, such as military coups, can affect the energy trade between countries. Some studies such as IEA (2007) used an average of two of the World Bank Worldwide Governance Indicators (2018) – “regulatory quality” and “political stability and absence of violence and terrorism” –to calculate the “political stability” score of each country. Other studies such as Jansen et al. (2004) calculated the long-term social and political risk of each country using UNDP indicators such as the Human Development Index.
supply and demand, and they are also an indication of economic impact. A reduction in oil prices affects the economy of countries whose production systems are not diversified and whose main export is oil. Energy prices can also indicate the scarcity of energy resources. However,Kruyt et al. (2009) argued that there are some limitations when using energy prices as an indicator of energy security: in the oil sector, for instance, oil prices can be influenced by speculation.
Seventh, another indicator of energy security is the “Mean Variance Portfolio” (MVP) which is often
used in contexts of diversification of energy generation sources. The MVP is used for optimization of different investment options according to their costs and risks. It is often used to assess the financial viability of electricity generating projects (Awerbuch and Berger, 2003; Awerbuch, 2006) and other energy projects (Lesbirel, 2004) and to predict future energy costs and risks such as price volatility. It accounts for the energy generating unit costs and the variance, as well as the correlation between energy costs. One of the advantages of using the MVP to assess the financial viability of energy projects is that rather than offering only one investment option for energy projects, it provides a cost-risk frontier (also called the “efficient frontier”) beyond which the cost of investing in energy projects cannot be reduced without increasing the uncertainties and risks, and the uncertainties and risks related to energy projects cannot be reduced without increasing the investment costs. In a context of energy insecurity and necessity to diversify the sources of energy generation, the use of the MPV helps to analyze different energy diversification options according to their financial costs, and to predict future energy security risks and their associated costs. One of the limitations of the MVP is that it uses past data on energy costs to predict future energy prices and risks. As argued by Stirling (1999), in a context where there is no information on the future, there is no evidence that future patterns will be similar to past patterns.
Eighth, another indicator of energy security is the “share of zero-carbon fuels”, which has been used by APERC as an indicator of “acceptability”. The aim was to measure countries’ efforts to
transition their energy mix portofolio from carbon intensive to non-carbon intensive. APERC (2007) uses the share of nuclear and renewable energy in the total supply of primary energy as a proxy for such indicator. However, concerns about the acceptability of nuclear energy have been raised
and therefore APERC’s (2007) approach to proxy the “share of zero-carbon fuels” is still
questionable.
Ninth, another indicator of energy security is “market liquidity”, which is related to price elasticity. It is the ability of markets to adapt to fluctuation in demand and supply of energy. IEA (2004) defines
“market liquidity” as the exponential function of the ratio of total energy consumption to total
available energy on the market. In stock markets, Datar (2000) suggested proxying “market liquidity” by a “coefficient of elasticity of trading (CET)”, which is defined as the ratio of the relative
Tenth, there are some energy demand side indicators which are relevant to security of energy supply as they help to measure the magnitude and impacts of disruption in energy supply. Among
them are “energy intensity”, “energy consumption per capita”, and the “share of energy used”. “Energy intensity” is defined as the ratio of total energy consumption to GDP, while “energy
consumption per capita” is defined as the ratio of total energy consumption to total population.The
“share of energy used” indicates the proportion of energy used in a sector. If a sector uses high
proportions of a particular energy type, this indicates that that sector is highly dependent on that energy type to function. For instance the share of oil used in the transportation sector is important and indicates the dependency of the sector on oil. In addition to these three indicators, Kendell and
James (1998) included “energy expenditures”, another demand side indicator, among energy
security indicators. Although it is a demand side indicator, it can be used to highlight risks related to disruption of the energy supply. The rationale is that high energy expenditures in a country imply that it faces great difficulties in supplying energy, and disruption of energy supply can occur.
2.3.2 Studies on aggregated indicators (indexes) of energy security
There have been several composite indexes of energy security (energy affinity index, geoeconomic vulnerability index, security of supply index, geopolitical energy security measure, risky external energy supply index, etc.), among which five are the most comprehensive. The first is Jansen et
al.’s (2004) aggregated indicator which uses the “Shanon index” to account for diversity of energy
types supplied and diversity among suppliers of each type of imported energy. Each supplier of an imported energy type is allocated a political stability weight based on a modified version of the UNDP Human Development Index. The rationale is that politically stable suppliers have more weight than those that are politically unstable. In addition to considerations of political stability, other aspects such as resource depletion are added to the aggregate indicator. Resource depletion is measured by a depletion index which is allocated to the energy-exporting countries. The rationale for this index is that markets will respond to a value of a ratio of reserve to production that falls below 50. While Jansen et al.’s (2004) aggregated indicator is related to several dimensions of energy security, it has some limitations. IEA (2007) argued that there is no objective basis to balance between resource depletion, political stability, diversity of energy types, and diversity of suppliers of imported energy types, and there is no objective threshold as a basis to analyze the reserve-to-production ratio. Moreover, the diversity of suppliers of imported energy types can become irrelevant in a context of globalization, as there will be fewer political barriers to imports of energy.
The second is the “IEA’s energy security index” which is composed of different indicators. The first
related to political stability has been included to IEA’s index using two of the World Bank’s “worldwide governance indicators”. The limitation of the IEA’s energy security index is that there is
no objective basis to balance between political stability and concentration of energy suppliers. In addition, some important aspects of energy security such as depletion of energy resources are not
included in the construction of IEA’s energy security index.
The third is the “supply demand index (S/D index)” developed by Scheepers et al. (2007). It is very comprehensive as it covers many aspects of energy security such as energy supply and demand, energy conversion and transportation in both long and medium run. Each aspect of energy security is allocated a score based on criteria such as energy efficiency, energy refinery, energy reserve, energy storage, sources of energy supply, etc. One of the advantages of the S/D index is that it accounts for demand aspect of energy security while many of the previous indexes and indicators do not. However, because it covers many aspects of energy security, it has become complex and lack transparency.
The fourth is the “willingness to pay” developed by Bollen (2008). It is defined as the share of GDP a country is willing to pay in order to reduce energy security risks. It is expressed in monetary terms and represents the costs to pay for in order to reduce energy security risks. The rationale is that the higher the risks, the higher the costs to pay. The energy security risks included in Bollen’s
(2008) “willingness to pay” are energy intensity, import dependency, and share of oil and gas in the total primary energy supply. One of its limitations is that some of the indicators may not be relevant depending on the worldview. Issues of import dependency may not be relevant in a context of globalization where there are fewer political barriers to importation of electricity.
The fifth is the “oil vulnerability index” of Gupta (2008). This index has seven components: “ i) the
ratio of net value of imported oil to GDP; ii) the ratio of oil consumption to GDP; iii) GDP per capita; iv) the proportion of oil supply in the total energy supply; v) the ratio of internal energy reserves to oil consumption; iv) exposure to geopolitical risks related to oil supply concentration, and vii)
“market liquidity”. Weights were assigned to each of these indicators using a statistical tool named
principal component analysis (PCA), and based on the covariance between indicators. The allocation of weights based on the PCA methodology has increased the robustness of the “oil vulnerability index” compared to other energy security indexes where weights are allocated without
any objective basis. However, as with the MVP theory, the “oil vulnerability index” is criticized for
using past values of covariance to predict future information related to the set of indicators which compose the oil vulnerability index.
2.3.3 Contribution of this study
pillars of energy security. However, most of them have focused on either total energy or a particular type of energy such as oil. To the best of the writer’s knowledge, there is no study which has constructed an aggregate indicator (index) of electricity security risk. This study will fill that gap by constructing a composite index of electricity security. It will focus essentially on security risks related to supply disruption of electricity in both the short and the long run. Long-run and sustainable electricity security is essential for countries relying heavily on non-renewable energy resources to produce electricity. In addition, in the long run countries aim to be self-sufficient in terms of electricity supply, because there are always uncertainties and risks related to dependency and importation of electricity. The study will not model the security risk index related to fluctuations in electricity demand: the electricity security risk index will be constructed only from the supply side perspective. A composite index of electricity supply security risk (electricity supply disruption risk) will be a great tool for policy makers in the assessment of the vulnerability of countries’ electricity
supply. It will also be an important tool in the assessment of the ease of doing business in countries, as easy access to electricity and affordable electricity are important indicators of the ease of doing business in a geographic area. Finally it will add value to the body of knowledge in
the field of energy security, as there is currently no composite index (to the best of the writer’s
knowledge) to measure electricity supply disruption risk.
2.4 METHODOLOGY
2.4.1 Definition of variables
The focus of this study is to construct a composite index of security of electricity supply, more precisely, a composite index of electricity supply disruption risk. As mentioned previously in the framework for electricity supply security, the composite index for electricity supply disruption risks
will be constructed based on the four pillars of energy security: “accessibility”, “availability”, “affordability” and “acceptability”. To construct this index, a set of indicators of electricity supply
disruption risks has been identified for each of the four pillars. The self-sufficiency rate in terms of electricity supply and a governance index have been identified as proxies for the concept of
“accessibility”; the rate of electricity supply efficiency, the ratio of growth of access to electricity in
urban areas to growth of the urbanization rate, and the rate of access to electricity have been identified as proxies for the concept of “availability”; the share of renewable electricity in the total domestic production of electricity has been identified as a proxy for the concept of “acceptability” (which also implies “sustainability”); and the share of GDP not dedicated to cover the cost of electricity supply, and real GDP per capita (as a percentage of the world annual average GDP per
capita) have been identified as proxies for the concept of “affordability”.
Some of these indicators have been transformed because of the presence of negative or zero values in their series. First, the governance index (GI) has been transformed because the
the years. As the study uses a geometric mean for the calculation of the composite index of electricity supply security risk, all values to be used have to be of same sign. Hence, all these governance indicators were transformed by adding 100 to their annual value in order for them to be essentially positive. In this way, there are only positive values for the governance index which itself is the geometric mean of the governance indicators (see equation 2.1, further explanation of the choice of geometric mean is provided in the method section below). The governance indicators are
provided by the Worldwide Governance Indicators (2018) and are the following: “rule of law” (RLA),
“control of corruption” (COC), “quality of the regulatory system” (QAR), “government effectiveness”
(GEF), “political stability andabsence of violence” (POS). Each of these indicators are respectively
an increasing function of countries’ efforts in terms of rule of law, countries’ efforts to control corruption, countries’ efforts to improve the quality of their regulatory system, countries’ efforts to improve the effectiveness of their government system, countries’ level of political stability and
attempts to reduce violence. High values of the governance index (GI) indicate high quality of
governance in the country, while low values of the governance index indicate low quality of the
country’s governance. This indicates that the governance index (GI) is an increasing function of countries’ governance. As said previously, the quality of governance within a country influences the
effectiveness of the delivery of electricity to consumers. Ineffective planning and mismanagement in the distribution of electricity can occur because of corruption, poor quality of the regulatory system, and political instability. This situation can result in a lack of foresight of increases in electricity demand and unpredicted disruptions of electricity supply. In addition, corruption and lack of rule of law can lead to mismanagement in the electricity billing system and thefts of electricity. This situation can cause non-technical losses of electricity, and can reduce the available quantity of electricity supplied to legal consumers, and therefore can be considered as one of the risks of electricity supply disruption. The governance indicator (GI) is one of the proxies for the concept of
“accessibility” and is expressed as follows:
5
(
100) (
100) (
100) (
100) (
100) 2.1
GI
RLA
COC
QAR
GEF
POS
Second, the ratio (RUB) of growth of access to electricity in urban areas (∆UAE) to growth of the
urbanization rate (∆UR) measures countries’ ability to avoid an electricity supply gap caused by
rapid urbanization. If the urbanization rate (UR) evolves more rapidly than urban access to
electricity (UAE), then there will be a rapid increase in the urban demand for electricity which will not be met by the urban supply of electricity. A supply gap will occur and there will be a disruption of electricity supply in urban areas. If urban access to electricity (UAE) evolves more rapidly than
the urbanization rate (UR), then promoting access to electricity in urban areas can contribute to
preventing urban disruption of the electricity supply. The series of the ratio (RUB) of growth of
access to electricity in urban areas (∆UAE) to growth of the urbanization rate (∆UR) also
study uses a geometric mean for the calculation of the electricity supply disruption risks index, and this requires all values to be of same sign. Hence, the number 100 has been added to both the numerator and the denominator of the ratio (RUB) of growth of access to electricity in urban areas
(∆UAE) to growth of the urbanization rate (∆UR), in order for that ratio to have essentially positive
values. High values of that ratio (RUB) indicates that countries’ effectiveness in filling the urban
supply gap of electricity (caused by rapid urbanization) is increasing in order to contribute to satisfying the urban demand for electricity (also caused by urbanization). Therefore, that ratio is an
increasing function of countries’ effectiveness in filling the urban supply gap of electricity caused by rapid urbanization. It is one of the proxies for the concept of “availability”, and is expressed as a
percentage as follows:
100
100 2.2
100
UAE
RUB
UR
Third, the self-sufficiency rate in terms of domestic electricity supply (ESS), which is defined as one
minus the ratio of net imports of electricity (NIE) to total domestic supply of electricity (TDES), has
been used as one of the proxies for the concept of “accessibility”, instead of the share of net imports of electricity in the total domestic supply. The share of net imports of electricity in the total domestic supply possesses both positive and negative values in its series. As said previously, it is defined as the ratio of net imports of electricity to the total domestic supply of electricity. Net imports of electricity are defined as imports of electricity minus exports of electricity. Negative values of the share of net imports of electricity in the total domestic supply indicate that the country is self-sufficient in terms of domestic electricity supply, and exports its surplus of electricity. Positive values of the share of net imports of electricity in total domestic supply indicate that the country is not self-sufficient in terms of domestic electricity supply and imports electricity. A share of net imports of electricity in the total domestic supply that is equal to zero, simply indicates that the country is self-sufficient in terms of domestic electricity supply. Because the study uses a geometric mean for the calculation of the electricity supply disruption risk index, all values of indicators have to be of same sign. The share of net imports of electricity in the total domestic supply does not fulfill this requirement, and this is why the self-sufficiency rate in terms of domestic electricity supply (ESS) has been chosen as one of the proxies for the concept of “accessibility”. It
highlights both countries’ dependency on importation of electricity and their ability to produce their
electricity supply domestically. It is an increasing function of countries’ ability to produce their
electricity supply domestically and a decreasing function of countries dependency on importation of electricity. It is expressed as a percentage as follows:
1
NIE
100 2.3
ESS
TDES
Case of importing countries
1
NIE
100 2.4
ESS
ED
IE
Case of exporting countries
1
NIE
100 2.5
ESS
ED EXE
Case of countries which neither import nor export electricity
1
NIE
100 2.6
ESS
ED
Where IE represents imports of electricity and IE is equal to zero for countries that are
self-sufficient in terms of domestic electricity supply. On one hand, if a country has a surplus of electricity and exports it, then the total domestic supply of electricity (TDES) is equal to the
domestic production of electricity (ED) minus the export of electricity (EXE). On the other hand, if a
country has a deficit of electricity and relies on importation to fill the supply gap, then the total domestic supply of electricity (TDES) is equal to the sum of the domestic production of electricity
(ED) and the importation of electricity (IE). If a country neither imports nor exports electricity, then
its total domestic supply of electricity (TDES) is equal to its domestic production of electricity (ED).
If the rate of electricity supply self-sufficiency (ESS) is less than 100, this indicates that the country has an electricity supply gap and relies on importation of electricity to fill this gap: net imports of electricity are positive in this case. If the electricity supply self-sufficiency rate (ESS) is equal to
100, this indicates that the country is self-sufficient in terms of its domestic electricity supply: net imports of electricity are equal to zero in this case. Finally, if the rate of electricity supply self-sufficiency (ESS) is greater than 100, this indicates that the country is self-sufficient in terms of its
domestic electricity supply, and has a surplus of electricity which is exported: net imports of electricity are negative in this case.
Fourth, the share (RRE) of renewable electricity (RE) in the total domestic production of electricity
(ED) has been used as a proxy for the concept of “acceptability”. As said previously, the concept of
“acceptability” also implies “sustainability”. Acceptability means that the type of energy used does
not cause significant damage to the environment or to society. Such type of energy is a sustainable energy resource. For long-term and sustainable electricity supply security it is important to account
for the concept of “acceptability”. As said previously, renewable electricity (RE) is a sustainable
electricity (ED) is defined as the ratio (RRE) of electricity produced domestically based on renewable sources (RE) to the total domestic production of electricity (ED). The denominator of the
ratio is not total domestic electricity supply (TDES) (for importing countries, TDES is equal to the sum of total domestic production of electricity (ED) and imports of electricity (IE)), because
countries do not always have control over the sources of electricity imported. Electricity imported can be renewable or non-renewable, and importing countries do not necessarily have control over the production of such electricity. One of the ways for importing countries to increase the share (RRE) of renewable electricity (RE) in the total domestic supply of electricity (TDES) is to increase
both their electricity supply self-sufficiency rate (ESS), and their share (RRE) of renewable
electricity (RE) in the total domestic production of electricity (ED). Annual series on the share of
renewable electricity in the total domestic production of electricity comprise the value zero for some of the years. As this study will be using a geometric mean to calculate the electricity supply disruption risks index, all indicators identified for the calculation of such index have to be of same sign. All indicators (RUB, ESS, GI) identified previously are of positive sign, and o 100 has been
added to each value of the series on the share (RRE) of renewable electricity (RE) in the total
domestic production of electricity (ED), in order for all values of that series to be essentially positive. The share (RRE) of renewable electricity (RE) in the total domestic production of
electricity (ED) highlights both countries’ ability to improve the sustainability of their electricity
supply, and countries’ dependency on non-renewable electricity (NRE) in their domestic production
of electricity. It is an increasing function of countries’ ability to improve the sustainability of their electricity supply by using more renewable electricity, and a decreasing function of countries dependency on non-renewable electricity (NRE) in their domestic production of electricity (ED). It is
expressed as a percentage as follows:
100 100 2.7
RE
RRE
ED
Or
1
NRE
100 100 2.8
RRE
ED
Other indicators, however, did not need any transformation. First, the rate of electricity supply efficiency (ESE) which is defined as the ratio of electricity not lost (ENL) to the total electricity
supply (TES) has been used as one of the proxies for the concept of “availability” (in addition to the
ratio of growth of urban access to electricity to growth of the urbanization rate), rather than the share of electricity losses (EL) in the total supply (TES). Total supply of electricity (TES) is equal to
the sum of domestic production of electricity (ED) and imports of electricity (IE) in the case of an importing country. In other words, in that case TES is equal to TDES (total domestic supply of
electricity (ED). In other words, TES is equal to the sum of TDES (in that case TDES is equal to the domestic production of electricity (ED) minus exports of electricity (EXE)) and exports of electricity (EXE). In the case of countries which neither import nor export electricity, TES is equal to the total domestic production of electricity (ED). In other words, TES is equal to TDES (TDES in that case is
equal to the domestic production of electricity). Electricity that is not lost (ENL) is the electricity
distributed which reaches legal consumers. Electricity that reaches illegal consumers is considered as stolen electricity and therefore is a loss of electricity. Electricity not lost (ENL) comprises only
the domestic legal consumption of electricity (EC) if the country is not exporting electricity. In the
case of countries that export electricity, it comprises both the domestic legal consumption of electricity (EC) and exports of electricity (EXE). It highlights both the ability of countries’ electricity
sector to be efficient by minimizing electricity losses, and the exposure of countries to electricity
losses. It is an increasing function of countries’ ability to minimize electricity losses, and a
decreasing function of countries’ exposure to electricity losses. It is expressed as a percentage as
follows:
General expression
100 2.9
ENL
ESE
TES
In other words,
1
EL
100 2.10
ESE
TES
In the case of exporting countries
100 2.11
EC
EXE
ESE
ED
In the case of importing countries
100 2.12
EC
ESE
ED
IE
In the case of countries that neither import nor export electricity
100 2.13
EC
ESE
ED
Second, another proxy for the concept of “availability” is the rate of access to electricity (RACE). It
is defined as the ratio of the population that has access to electricity (PACE) to the total population
(TPO), and is expressed as a percentage. A value of such ratio less than 100 indicates that there
electricity. In other words, electricity is not available for a proportion of the population. This supply gap is considered as a total and continuous disruption of electricity supply encountered by the population that does not have access to electricity. Increasing access to electricity will contribute to reduce the supply gap of electricity. Conversely, a value of such ratio that is equal to 100 indicates that the entire population of the country has access to electricity, and there is no supply gap. In other words, electricity is available for the entire population. The rate of access to electricity (RACE) is a decreasing function of the electricity supply gap of total and continuous disruption of
electricity supply. High values of such rate indicate that the country is making efforts to reduce its electricity supply gap, while low values of such rate indicate the presence of an important electricity supply gap in the country. The rate of access to electricity is expressed as follows:
100 2.14
PACE
RACE
TPO
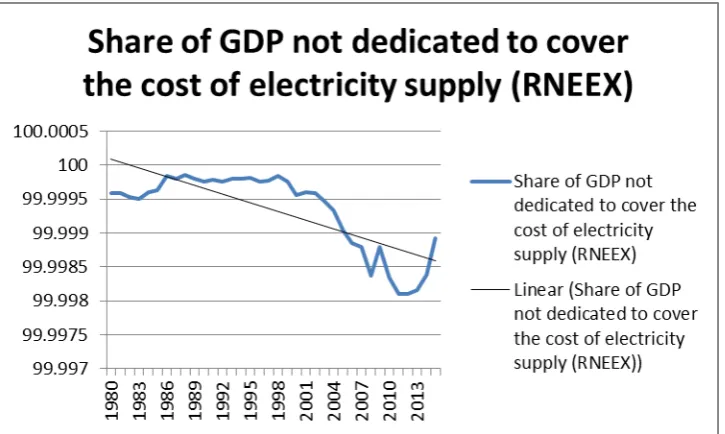
Third, the share of real GDP not dedicated to cover the cost of electricity supply (RNEEX) has
been used as a proxy for the concept of “affordability”. It is defined as the ratio (RNEEX) of the
proportion of real GDP not dedicated to cover the electricity supply expenditures (NEEX) to real
GDP (RGDP). It can also be defined as one minus the share of GDP dedicated to cover the cost of
the electricity supply (EEX). The cost of electricity supply is calculated by multiplying the total quantity of electricity supply converted in barrel of oil equivalent (bbl) by the annual real average crude oil price (COP) (US$/bbl; constant 2010 US$). The share of real GDP not dedicated to cover the cost of electricity supply (RNEEX) highlights both countries’ ability to minimize the cost of
electricity supply, and countries’ vulnerability to the high cost of electricity supply. High values of
this ratio indicates that countries are able to minimize the cost of their electricity supply, while low values of this ratio indicates that countries are exposed to high costs of electricity supply. A high
cost of electricity supply limits countries’ capacity to afford electricity, which can lead to a supply
disruption of electricity. The share of real GDP not dedicated to cover the cost of electricity supply (RNEEX) is therefore an increasing function of countries’ ability to minimize the cost of electricity
supply, and a decreasing function of countries exposure to high costs of electricity supply. It is expressed as a percentage as follows:
100 2.15
NEEX
RNEEX
RGDP
Or
1
EEX
100 2.16
RNEEX
RGDP
Fourth, another proxy for the concept of “affordability” is real GDP per capita (RGDPc), which is one of the indicators of countries’ wealth and standard of living. Countries that have a high real
GDP per capita (RGDPc) are wealthier and can offer a high standard of living to their population: this includes access to electricity, internet, decent housing and health care, public transport, etc. These countries are financially able to invest in electricity infrastructure and utilities in order to prevent or avoid future disruptions of the electricity supply. Conversely, countries that have a low real GDP per capita (RGDPc) are less wealthy and unable to offer a high standard of living, which
will include access to electricity, internet, decent housing and health care, public transport, etc. In