
ISSN Print: 2164-2745
DOI: 10.4236/jasmi.2017.74008 Nov. 28, 2017 93 Journal of Analytical Sciences, Methods and Instrumentation
Measurements of Absolute Atomic Nitrogen
Density by Two-Photon Absorption
Laser-Induced Fluorescence Spectroscopy
in Hot Air Plasma Generated by Microwave
Resonant Cavity
Frédéric Marchal
1, Nofel Merbahi
1, Gaétan Wattieaux
1, Alain Piquemal
2, Mohammed Yousfi
11Université de Toulouse, LAPLACE, UPS, CNRS, INPT, Toulouse, France 2CEA, DAM, DIF, Arpajon, France
Abstract
For the first time, absolute densities of atomic nitrogen in its ground state (N4S)
have been measured in hot dry and humid air plasma columns under post-discharge regime. The determination of space-resolved absolute densities leads to obtain the dissociation degrees of molecular nitrogen in the plasma. The hot plasmas are generated inside an upstream gas-conditioning cell at 600 mbar when the air gas flow is directly injected at 10 slm in a microwave reso-nant cavity (2.45 GHz, 1 kW) placed in the downstream side. Density mea-surements based on laser induced fluorescence spectroscopy with two-photon excitation (TALIF), are more particularly performed along the radial and axial positions of the plasma column. Calibration of TALIF signals is performed in situ (i.e. in the same gas-conditioning cell but without plasma) using an air gas mixture containing krypton. Optical emission spectroscopy is considered to estimate the rotational gas temperature by adding a small amount of H2 in
dry air to better detect OH (A-X) spectra. The rotational temperatures in hu-mid air plasma column (50% of huhu-midity) are larger than those of dry air plasma column by practically 30% near the nozzle of resonant cavity on the axis of the plasma column. This is partly due to attachment heating processes initiated by water vapor. A maximum of the measured absolute nitrogen den-sity is also observed near the nozzle which is also larger for humid air plasma column. The obtained dissociation degrees of molecular nitrogen in both dry and humid air plasma along the air plasma column are lower than the cases where only thermodynamic equilibrium is assumed. This is characteristic of
How to cite this paper: Marchal, F., Mer-bahi, N., Wattieaux, G., Piquemal, A. and Yousfi, M. (2017) Measurements of Abso-lute Atomic Nitrogen Density by Two-Photon Absorption Laser-Induced Fluorescence Spectroscopy in Hot Air Plasma Generated by Microwave Resonant Cavity. Journal of Analytical Sciences, Methods and Instru-mentation, 7, 93-115.
https://doi.org/10.4236/jasmi.2017.74008
Received: September 29, 2017 Accepted: November 25, 2017 Published: November 28, 2107 Copyright © 2017 by authors and Scientific Research Publishing Inc. This work is licensed under the Creative Commons Attribution International License (CC BY 4.0).
DOI: 10.4236/jasmi.2017.74008 94 Journal of Analytical Sciences, Methods and Instrumentation
the absence of chemical and energetic equilibria not yet reached in the air plasma column dominated by recombination processes.
Keywords
TALIF, Atomic Nitrogen Density Measurement, Hot Air Plasma, Optical Emission Spectroscopy
1. Introduction
This work is devoted to the experimental determination of absolute density of atomic nitrogen in the background state (N4S) coming from dissociation of
molecular nitrogen of a hot air plasma generated by a microwave at 2.45 GHz resonant cavity for an input power of 1 kW. Many applications and understanding of plasma physics are expected from the characterization of the present hot air plasma. In our case, the experimental characterization to obtain more particularly the density of atomic nitrogen in such air plasma can be used, when coupled with previously obtained atomic oxygen densities [1] [2], for validation of a complex hydro-kinetics model involving transport and plasma chemistry.
As is known, the classical optical emission spectroscopy (OES) can give direct access only to the radiative excited species not to the ground state species. In fact, OES allows the determination of absolute densities of the upper level of the emissive transition after a prior spectrum calibration using a spectral lamp. OES gives also information on for instance the temperatures of gas, rotation and vibration species from classical comparison between synthetic and experimental specific molecular spectra. However, OES cannot directly give any direct information on the non-emissive states as the density of the atomic ground state which can exceed the excited species density by several orders of magnitude in the case of the present microwave plasma.
The alternative to obtain, for instance, the density of atomic nitrogen in the ground state, due to molecular nitrogen dissociation in the present microwave hot air plasma, is to use the absorption spectroscopy and more particularly the laser-induced fluorescence spectroscopy (LIF) that generally allows direct access to the density of the non-emissive species as atomic ground states and also metastables. It can be found in for instance [3] and the references given therein, many details on the laser-induced fluorescence spectroscopy and its advantages in comparison for instance to standard absorption or Raman spectroscopy.
DOI: 10.4236/jasmi.2017.74008 95 Journal of Analytical Sciences, Methods and Instrumentation
nitrogen microwave discharge (433 MHz, 300 W) at low pressure and its afterglow in the presence of the so-called short-lived afterglow [4] or by a flowing microwave post-discharge sustained by a 2.45 GHz surfatron source in pure nitrogen at atmospheric pressure [5].
However, TALIF and absorption spectroscopy were not used up to now to measure atomic nitrogen density in the case of hot air plasma generated by a microwave resonant cavity. The next Section 2 is devoted to a summary of the principle of TALIF measurement with the calibration method. This is followed in Section 3 by the descriptions of the experimental setup used to generate the hot air plasma from the microwave resonant cavity, the laser setup of TALIF spectroscopy used to measure the absolute density of nitrogen oxygen and the optical emission spectroscopy used to measure the gas temperature. The latter is required for the analysis in Section 4 of the measured N atom densities along the axial and radial directions of both humid and dry air plasma columns.
2. Principle of TALIF Measurements
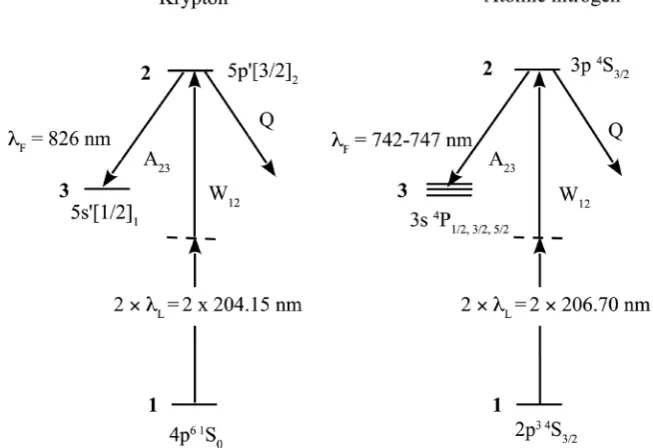
TALIF measurements are a two-photon absorption spectroscopic method to measure the ground state density of an atomic species in a gaseous plasma medium. Absolute density measurements are based on the comparison of two-photon absorption spectra with a noble gas whose the two-photon absorption wavelength is close to the transition of the investigated atomic species. Figure 1 shows the classical TALIF excitation and de-excitation schemes of atomic nitrogen and krypton. The TALIF measurements are performed by recording the fluorescence coming from the radiative decay of the excited state (labeled 2) created by two-proton laser absorption of the atomic ground state (labeled 1).
[image:3.595.206.533.481.705.2]The two-photon transition probability W
( )
r,t is proportional to the squareDOI: 10.4236/jasmi.2017.74008 96 Journal of Analytical Sciences, Methods and Instrumentation
of the laser energy flux [6]:
( )
( )2( )
212
, ˆ
, I t
W t h σ ν = r
r
(1)
where I
( )
r,t is the laser intensity and σˆ( )2 is the generalized excitation crosssection. σˆ( )2 depends on the cross section σ( )2 of the absorbing specie, on
( )
g ν , the normalized line profile of the two-photon excitation (
∫
g( )
ν νd =1),which is the convolution of the laser line profile and the Doppler broadened absorption line, and on a statistical factor ( )2
G equal to 2 in the case of a
stochastic multimode laser [7]:
( )2 ( )2
( )
( )2ˆ g G
σ =σ ν (2)
In the case of low laser intensities, the ground state is not depleted, its density
1
n remains unchanged and the ionization of the exited state can be neglected.
Therefore, the density of the excited state n2 is given by
( )
( )
(
) ( )
2
12 1 2 2
d ,
, ,
d
n t
W t n A Q n t
t = − +
r
r r (3)
where A2 is the fluorescence rate of the excited state, inverse of the natural
lifetime
τ
n and Q is the effective quenching rate. Assuming a gaussiantemporal profile for the laser pulse where the pulse width ∆ =tL 2sL 2 ln 2 is the FWHM, the two-photon excitation rate can be rewritten as a function of the laser energy pulse E and of the beam waist w0 of the laser beam
( )
( )( )
( )( )
( )
2 2 2 2
12 2 2 2 2 2
0
1
, exp
2π
π L L
g G E t
W t s s w h σ ν ν − =
r
(4)
The excited state radiatively decays and populates an intermediate state (labeled 3 in Figure 1). A23 is the Einstein coefficient for spontaneous emission
of this optical transition.
The number of fluorescence photons per unit time and unit volume is given by
( )
( )
( )( )
( )( )
( )
(
)
(
)
23 22 2 2 2
2
1 23 2 2 2 2
0 2 2 d , , d 1 exp 4 4 π π
erf 1 exp
2 F L L L L n t
A n t
t
g G E s
n A A Q
s
w h
A Q
t
s A Q t
s σ ν ν = = + + × − + − + r r (5)
The time integrated TALIF signal S results by integrating the number of fluorescence photons over the two-photon transition and the probed volume, including experimental system factors
( )
23 2 , d d d
4π
t
V t
S Tη ν =+∞A n t V ν t
=−∞
∆Ω
=
∫ ∫ ∫
r(6)
DOI: 10.4236/jasmi.2017.74008 97 Journal of Analytical Sciences, Methods and Instrumentation
of detection and
η
is the efficiency of the photomultiplier at the fluorescence wavelength. The density of the excited state n2 in a small volume of detectionis assumed to be homogeneous. Introducing the branching ratio 23 2 2 A a A Q = + and integrating over the time and over the detection volume V, the expression of the TALIF signal can be written as
( ) ( )
( )
( )
2 2 2
1 2 2 2
2 0
4π π 2 π L
T G E V
S n a
s
w h
η σ
ν
∆Ω= (7)
The TALIF signal S, measured by integrating the two-photon excitation spectrum over all the resonance line and over time, exhibits quadratic laser energy dependence. S strongly depends on the branching ratio a2 which
decreases with the quenching rate Q of the excited state. The collisional quenching rate is given by
( )
q q
q
Q=
∑
k T n(8)
( )
qk T is the quenching coefficient of the colliding species q of density nq.
The quenching coefficient depends on temperature T of the detection volume which is often assumed in the literature equal to the room temperature Tref. The
collisional cross section usually exhibits a weak temperature dependence [8], according to the ideal gas law and for a thermal velocity distribution, kq
( )
T can be written as( )
( )
q q ref ref
T
k T k T
T
=
(9)
The TALIF calibration method is based on the comparison of TALIF signals obtained respectively with the atomic species to be quantified and with a noble gas of known density. Xenon is generally used for atomic oxygen density measurements and krypton is suitable for calibration of atomic nitrogen densities. Assuming the same experimental optical conditions of fluorescence detection and the same laser beam geometries and pulse widths, the atomic density nX of the specie X is obtained from the density nR of the reference
gas R according to Equation (7):
( )
( )
( )
( )
( ) ( )
( ) ( )
( )( )
( )( )
2 2 2 2 2 R X X R X RS X a R T R R R E
n n
S R a X T X X X E
η
σ
ν
η
σ
ν
=
(10) This expression remains valid at high pressure if the lifetime of the laser-excited state is lower than the laser pulse width. To minimize uncertainties, the calibration method requires similar excitation conditions for R and X. The excitation and fluorescence wavelengths have to be close and the optical system of detection needs to remain unchanged. For low pressure plasmas, Q A2,
the calibration method requires the knowledge of the optical branching ratio
23 20 2i i A a A =
DOI: 10.4236/jasmi.2017.74008 98 Journal of Analytical Sciences, Methods and Instrumentation
laser excited atomic level is related to the sum of transition probabilities to all levels lower in energy:
2
1 n
i iA
τ =
∑
. For high pressure plasmas, if the quenchingcoefficients are not well defined, the calibration method cannot be applied with a good accuracy. Therefore the absolute branching ratio a2 can be experimentally
determined by comparing the energy normalized TALIF signal at low and high pressure respectively Slow and Shigh measured in the same optical conditions
[9]:
low high 2
20 high low
1 1 n
n S
a
a = +τ Q=n S (11)
3. Experimental Setup
3.1. Plasma Source
We experimentally analyzed an air plasma generated by a microwave resonant cavity. The 2.45 GHz microwave power supply (magnetron source, SAIREM) can provide power up to 3 kW. The microwaves are guided to the resonant cavity via a waveguide system (WR-340) closed by an adjustable short circuit. The matching was adjusted to maintain the reflected power below 2% of the incident microwave power. The total gas flux of 10 slm at a total pressure of 600 mbar was injected inside the microwave cavity and the plasma expanded in the direction of the upstream side towards a gas-conditioning cell where the analysis of the post discharge regime was performed. The power delivered to the plasma was set to 1 kW. Synthetic dry air flow (80% N2, 20% O2) was monitored by a
mass flow controller and the total pressure was controlled by a capacitive pressure gauge and a throttle valve located between the cell and the vacuum pump. A small amount of H2 with a flow of 200 sscm could be injected to
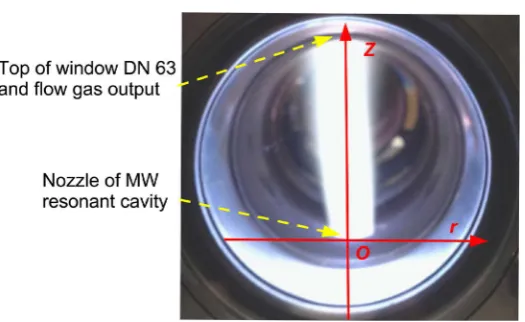
increase the intensity of OH (A-X) spectrum used to estimate gas temperature. A small amount of water vapor (18.5 g/h corresponding to 50% of humidity) can also be added to the main gas flow to study plasma generated in humid air. Figure 2 displays a view of the of the air plasma column ejected from the resonant cavity (not visible because placed in the downstream part) through the nozzle (at
0 mm
z
=
) inside the gas-conditioning cell kept at 600 mbar for the present experiment.The whole plasma reactor (MW resonant cavity and gas-conditioning cell) were mounted on a (r, z) plateau allowing a milimetric vertical (z axis) and horizontal (r axis) translations of the plasma cell without moving the laser beam and the optics. Such a translation setup enables to perform TALIF and OES spectroscopies along the axial and the radial directions of the air plasma column in order to determine the spatial cartography of N(4S) density and gas temperature.
DOI: 10.4236/jasmi.2017.74008 99 Journal of Analytical Sciences, Methods and Instrumentation
Figure 2. Picture of the air plasma column inside the gas-conditioning cell and generated by the microwave resonant cavity placed in the downstream side below the nozzle. The air plasma column diameter is 15 mm at the bottom of the column and the diameter of the window is 60 mm.
Figure 3. Schematic view of the TALIF experimental setup.
3.2. TALIF Setup
[image:7.595.61.540.294.567.2]DOI: 10.4236/jasmi.2017.74008 100 Journal of Analytical Sciences, Methods and Instrumentation
mirrors selects the UV radiations of the laser beam. The UV laser radiations are located in the UV-C wavelength range, from 202 to 212 nm. The spectral line-width of the UV vertically polarized laser beam is specified to be 3 pm, the pulsed length is 7 ns with a 30 Hz repetition rate. The UV laser pulse energy is measured with an energy meter (Ophir Nova II) equipped with a pyroelectric energy sensor. The laser energy of the output beam is controlled by a motorized variable laser attenuator (Standa 10 MVAA) having an extremely low output beam deviation and a wide spectral range emission flux variation. The UV laser pulse energy was typically lower than 50 µJ per pulse to avoid saturation effects.
The fluctuation of the laser pulses obeys to a gaussian statistical distribution. The energy-meter is connected th the computer ti meausre te mean and the dispersion of the laser pulses energies during the TALIF measurements.
The UV laser beam is focused by a MgF2 lens having a 200 mm focal length.
The diameter of the focused spot is about 20 µm and the depth of focus is about
12 mm. The position of the laser spot can be adjusted from
z
=
15 mm
to50 mm
z
=
from the nozzle. The size of the of the viewport prevented measurements at shorter distances from the nozzle.The fluorescence light, emitted by a small volume centered at the focused spot is collected perpendicularly to the laser beam and focused by a BK7 lens with a focal length of 75 mm onto the photocathode of a photomultiplier (PMT Hamamatsu H7421-50) equipped with interference filters (bandwidth 10 nm) and an aperture slot to minimize the detection volume. The photomultiplier is operating in photon counting mode requiring a second diaphragm placed in front of the lens in order to reduce the fluorescence flux. Taking into account the parameters of the fluorescence detection optical system and of the focused laser beam, the detection volume can be assumed as a cylinder of 20 µm diameter and
200 µm length with an horizontal axis is coincident with that of the laser beam.
The size of this detection volume corresponds to the spatial resolution of the TALIF measurements (200 µm along the radial axis and 20 µm along the z axis).
Time-resolved photon counting is performed by a multichannel scaler Stanford Research SR 430 triggered by a fast photodiode with a time resolution of 5 ns. The laser and the multichannel scaler were triggered by a digital delay-pulse generator (Standford Research DG 645). Measurements are performed by scanning the laser wavelength and accumulating the time-resolved histogram of counts over 600 laser shots.
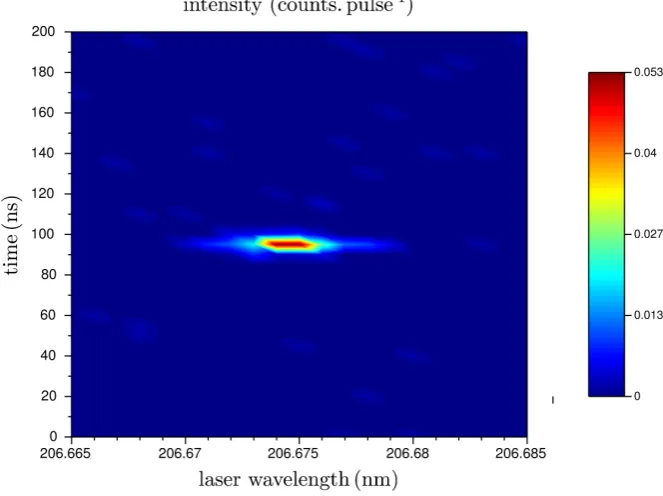
Figure 4 shows an example of an acquired N-TALIF measurement.
The experimental TALIF signal S is obtained by integrating over time and excitation wavelength the fluorescence photons detected. For this purpose, the time-integrated counts were fit with a Gaussian profile. The normalized TALIF signal S* is calculated by dividing S by the mean of the squared energy pulse.
DOI: 10.4236/jasmi.2017.74008 101 Journal of Analytical Sciences, Methods and Instrumentation
[image:9.595.209.540.386.616.2]Figure 4. Time and wavelength resolved N-TALIF signal. The detection volume is located at the center of the plasma (r=0 mm and at z=15 mm from the nozzle of the microwave resonant cavity. Dry air flow qair =10 slm, microwave power PMW =1 kW, operating pressure p=600 mbar.
Figure 5. Cause and effect diagram for normalized TALIF signal estimation.
with the output quantity S* are shown in the cause and effect diagram of the Figure 5.
DOI: 10.4236/jasmi.2017.74008 102 Journal of Analytical Sciences, Methods and Instrumentation
wavelength sensitivity curve):
( )
(
)
(
)
(
)
(
)
(
)
2
2 2 2 2
2 calibration wavelength reading linearity
u E
u u u u
= + + + (12)
Typically, the relative uncertainty of the mean of the squared energy pulse is 6.7%. The uncertainty of the TALIF signal S is rather complex to quantify because some of the uncertainty components are correlated and also because the model that gives the TALIF Signal S as a function of all the input parameters is not linear. It is quite difficult to provide the partial derivatives of the model, as needed by the law of propagation of uncertainty. For example the repeatability of the numerical fit method depends on the number of the fluorescence photons detected and on background level. The number of counts recorded is correlated to the number of laser shots. So a statistical analysis (type A evaluation) was performed to evaluate the uncertainty of the single measurement of the TALIF signal. Uncertainty of the TALIF signal was estimated by a Monte-Carlo method. The probability distribution function of the laser-pulse energies was assumed to be Gaussian. For a typical laser energy of 50 µJ, the fluctuation of pulse-to-pulse
energies measured are characterized by a standard deviation around 10% of the laser energy. The fluorescence flux detected remains rather weak (lower than 1 photon per laser pulse), therefore the probability of detection of a number of photons is assumed to obey to a Poissons law. The TALIF signal standard uncertainty is obtained by the determination of the standard deviation of the probability density function of the TALIF signal estimations obtained by series of 104 Monte Carlo simulated two-photon excitation spectra. As expected, the
number of fluorescence photon detected per laser pulse is the major contribution of all the uncertainty sources. Figure 6 shows the evolution of the combined relative standard uncertainty u S
( )
S of the normalized TALIF-Signal as a
function of the number of recorded counts. Then, the combined standard uncertainty of the measured normalized TALIF signal *
S derives from energy
and TALIF signal uncertainties:
( )
( )
( )
22
* 2
* 2
u S u S u E
S
S E
= +
(13)
DOI: 10.4236/jasmi.2017.74008 103 Journal of Analytical Sciences, Methods and Instrumentation
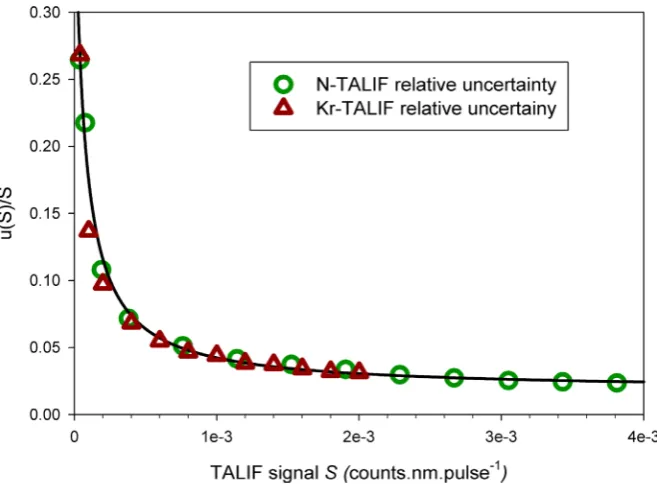
Figure 6. Estimation of the relative TALIF signal uncertainty as a function of the TALIF signal. N-TALIF and Kr-TALIF signal relative uncertainties remain lower than 10% for
TALIF-signals more than 4 1
2.0 10 counts nm pulse× − ⋅ ⋅ − . The estimated values of the
relative TALIF uncertainty are fitted with a three parameters hyperbola. The value of the horizontal asymptote is 1.8%.
differ up to two times the standard uncertainty
( )
*u S , a new calibration is
achieved.
3.3. Optical Emission Spectroscopy Setup
OES is used to estimate gas temperature along the axial and radial directions of the air plasma column generated by the MW resonant cavity and launched inside the gas-conditioning cell. We used a spectrophotometer with 0.75 m of focal length (Acton Spectra SP 2750, in the Czerny Turner configuration) covering a spectral range lying between 200 nm and 920 nm. The detecting device set at the exit of this spectrophotometer is a CCD camera (PIXIS 100,
1340 100
×
imagingarray of
20
μm 20 μm
×
pixels). The plasma spectra are collected through anoptical fiber (UV-silicon LG-455-020-3) placed at the spectrometer entrance slit (having 100 µm wide) and connected, on the plasma side, to an optical system
(composed by 2× magnification lens) aimed to target a small plasma volume.
The optical system is mounted on a sliding stand which is able to move radially and axially in order to scan the plasma column with a spatial resolution of 1 mm. Spectra collections are performed using a 2400 grooves/mm grating in the UV range and a 1800 grooves/mm grating in the visible range. An optical high pass filter is used for the visible range in order to prevent any perturbation of the visible range spectra due to the unwanted grating second order of diffraction of the UV light.
DOI: 10.4236/jasmi.2017.74008 104 Journal of Analytical Sciences, Methods and Instrumentation
calculated OH ( 2 2 3 2
A Σ+,v= →0 X Π ,v′=0) molecular band since the rotation temperature is equivalent to the gas temperature. This is correct when the assumption of a quasi-instantaneous equilibrium between the rotation and the translation temperatures is fulfilled. The calculated or synthetic spectra are determined using Lifbase software [10]. A small amount of H2 was added in
order to improve the sensitivity of the temperature measurements in the case of dry air. In other words, introducing a small percentage of H2 in the plasma is an
efficient way to better observe the OH (A-X) spectrum. We have ensured that this small amount of H2 does not induce any effect on the thermal characteristics
of the air plasma by observing the very good superposition of the NOγ spectra of
the air plasma column with and without this small amount of H2 (data not
[image:12.595.208.538.396.660.2]shown). The rotational temperature of the OH radical is assumed close to the gas temperature since the characteristic time of rotation-translation is very short. The relative uncertainty is estimated by varying the temperature of the simulated spectrum as long as the peak correlation remains upper than 0.97.
Figure 7 displays the measured OH (A-X) spectrum recorded on the axis of air plasma column at
z
=
15 mm
(corresponding to the TALIF lower positionof nitrogen TALIF measurements). The spectrum calculated for a rotational temprature of 4100 K gives the best agreement with the experimental one in the Figure 7. This peak correlation is then measured and, in this example, will amount to 0.98. The temperature relative uncertainty is estimated at 10%.
Figure 7. Comparison between experimental spectrum and calculated one for 4100 K
rot
T = at the position of plasma column: r=0,z=15 mm in the case of
1 kW MW
P = , p=600 mbar, inlet gas composition = Air + 3% H2 and Gas flow
10 slm
DOI: 10.4236/jasmi.2017.74008 105 Journal of Analytical Sciences, Methods and Instrumentation
4. Results
4.1. N-TALIF Signal
For each considered (
r z
,
) position along the air plasma column, the N-TALIF signal measurements are performed by scanning the laser wavelength near the two-photon resonance line of the 3 4 3 43 2 3 2
2p S →3p S transition and recording the fluorescence of the 3 4
3 2
3p S state at 745 nm. For high quenching rates, the effective life time of the 3 4
3 2
3p S state is smaller than the laser pulse width. A low gate-time of integration is required to minimize the influence of the continuous background radiations from the plasma. The radiative decay is integrated over 50 ns after the laser pulse. The line profile is fitted by a Gaussian profile which corresponds to the convolution of a laser line profile and Doppler broadening (see Figure 8). The N-TALIF signal SN is given by integrating the line profile
over the laser wavelength. The wavelength maximum position may slightly fluctuate due to variations of the temperature of the laser cavity.
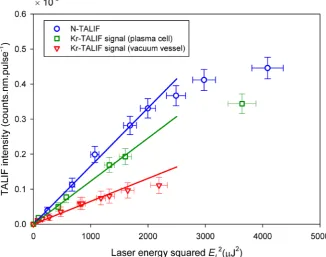
The N-TALIF signal is proportional to the square of the laser pulse energy in the case of unsaturated excitation regime. Figure 9 shows the fluorescence signal integrated over the laser wavelength as a function of the laser energy. The energy variations were obtained by detuning the BBO crystal of the frequency doubled unit. The N-TALIF remains unsaturated for laser energies up to 50 µJ.
4.2. Temperature Effects
The effective branching ratio a2
( )
N can be calculated from the room temperature quenching coefficients and the measured gas temperature determined by fittingFigure 8. Two-photon excitation spectra for the excitation of the N ground state at different laser pulse energies. The time integrated counts are averaged over 600 laser pulses. The detection volume is located at the center of the plasma (r=0 mm) and at
15 mm
z= from the nozzle of the microwave resonant cavity. Dry air flow qair =10 slm,
[image:13.595.232.517.434.649.2]DOI: 10.4236/jasmi.2017.74008 106 Journal of Analytical Sciences, Methods and Instrumentation
Figure 9. TALIF signals (temporally and spectrally integrated) as a function of laser pulse energy squared. For N-TALIF, the detection volume is located at the center of the plasma (r=0 mm and at z=15 mm of the nozzle of the microwave resonant cavity. Dry air flow qair =10 slm, microwave power PMW =1 kW , working pressure p=600 mbar. For Kr-TALIF, the detection volume is also localized at (r=0 mm and at z=15 mm in the plasma cell when the plasma is off (dry air flow qair =10 slm with qKr =10 sccm,
working pressure p=600 mbar). Kr-TALIF measurements were also achieved in a vacuum cell for Kr-air mixture (pKr=0.6 mbar and pTot =600 mbar).
the experimental spectra recorded in the range from 306 nm to 310 nm with synthetic spectra calculated using LifBase software [10]. Spectra were recorded along the axis of the air plasma column (Figure 10) and in the radial direction for different axial positions.
It is important to underline that the gas temperature in the case of humid air (50% of humidity) is higher than the case of dry air. For instance, at 600 mbar, the gas temperature on the axis at the output of the nozzle (i.e.
r
=
0 mm,
z
=
0 mm
) isequal to about 4500 K in dry air plasma and 6400 K in humid air plasma which corresponds to a rise of about 1900 K in presence of 50% of humidity. In fact in presence of water vapor, the plasma electronegativity becomes higher thus increasing the electron losses. In order to compensate such electron losses due to more particularly attachment processes, the electron energy deposit in the discharge (which takes place inside the resonant cavity), increases thus increasing in turn the gas heating. This can be assimilated to the known attachment heating that increases for instance the critical static electric field by about 10% in presence of humidity.
DOI: 10.4236/jasmi.2017.74008 107 Journal of Analytical Sciences, Methods and Instrumentation
Figure 10. Measured gas temperature along the axis of the air plasma column for synthetic air, dry air and humid air. Dry air flow qair =10 slm, H2 flow qH2 =200 sccm,
water flow qH O2 =18.5 g h (50% humidity), microwave power PMW =1 kW, working
pressure p=600 mbar.
Table 1. Radiative lifetimes and room temperature quenching coefficients of Kr 5p 3 2
(
′[ ]
2)
and
(
4)
3 2N 3p S .
Excited state Radiative life time (ns)
[ ]
(
2)
Kr 5p 3 2′ 30.6 2.1± , this work
34.1 [11]
(
4)
3 2N 3p S
26.9 0.3± [12]
29.6 [11]
26 2± [13]
Reagent Quenching coefficient for Kr 5p 3 2
(
′[ ]2)
atoms (10 3 1
10 cm s− ⋅ − ) Kr
O2
N2
1.46 [11]
6.34 [11]
3.35 [11]
Reagent Quenching coefficient for
(
4)
3 2N 3p S atoms (10 cm s−10 3⋅ −1) O2
N2
6.63 [11]
0.41 [11]
0.67 0.09± [13]
[image:15.595.207.540.434.669.2]DOI: 10.4236/jasmi.2017.74008 108 Journal of Analytical Sciences, Methods and Instrumentation
colliders are related to the gas temperature according the ideal gas law at constant pressure. In the plasma core, the dissociation degree of molecular oxygen may be high. The dissociation degree has been already estimated in a previous work [1] by atomic oxygen TALIF measurements using xenon calibration. This dissociation degree reaches a value which exceeds 50% in the axis of the plasma column at
z
=
15 mm
from the nozzle (atz
=
0 mm
) in the plasmacolumn. The determination of the quenching rates is based on the assumption that the molecular oxygen density is directly correlated to the atomic oxygen density. This means that excited states of O2 are minority species relatively to the
overall molecular oxygen densities. Based on these assumptions, and considering the plasma temperature and the quenching coefficients, the effective branching ratios a2
( )
N were determined at different axial and radial positions (Figure 11 and Figure 12).4.3.
In situ
Calibration
[image:16.595.256.493.413.686.2]The Kr calibration is performed in the gas-conditioning cell in the same experimental conditions as the N-TALIF measurements but without igniting the plasma (plasma off). Air mixed with a small known amount of krypton is introduced in the gas-conditioning cell using the same flow and pressure (10 slm and 600 mbar). The proportion of krypton (0.1%) was chosen to obtain the same order of magnitude for N-TALIF and Kr-TALIF signals. In the case of krypton, the linear regime is achieved when the laser energy is kept below 40 µJ to avoid
Figure 11. Branching ratio a2
( )
N in dry air. Dry air flow qair =10 slm, microwaveDOI: 10.4236/jasmi.2017.74008 109 Journal of Analytical Sciences, Methods and Instrumentation
Figure 12. Branching ratio a2
( )
N in humid air. Dry air flow qair=10 slm, water flow2
H O 18.5 g h
q = , microwave power PMW =1 kW, working pressure p=600 mbar.
multlphotonic ionization processes. The laser wavelength, tuned around 204.15 nm, is used to excite the krypton ground state to the 5p 3 2′
[ ]
2 state by a two-photontransition. The line profile is fitted by a Gaussian as shown in Figure 13. The Kr-TALIF signal SKr is obtained by integrating the line profile over the laser
wavelength.
Further Kr-TALIF measurements are achieved in a vacuum cell to relate the TALIF signals and to measure the effective branching ratio a2 tacking into
account the air and the krypton quenching. Before being filled with pure krypton or a mixture of synthetic air and krypton, the cell was pumped down to
7
5 10× − mbar with a turbomolecular pump. Two capacitive pressure meters are used, one with a full range of 10 Torr for low pressure conditions and one with a full range of 1000 Torr for high pressure conditions. This experimental set-up has been fully described in a previous work [14].
Firstly, measurements are performed in pure krypton at very low pressure when the self quenching of krypton can be neglected. This condition is fulfilled when the krypton pressure is kept below 0.1 mbar. For this pressure condition, the temporal decay of the excited state at 826.3 nm is exponential (Figure 14) and the measured decay rate is the inverse of the natural lifetime of the Kr
[
]
2DOI: 10.4236/jasmi.2017.74008 110 Journal of Analytical Sciences, Methods and Instrumentation
Figure 13. Two-photon excitation spectra for the excitation of the Kr ground state at different laser pulse energies. The time integrated counts are averaged over 600 laser pulses. The detection volume is located at the center of the plasma cell (r=0 mm) and at
20 mm
z= . Plasma is off. Dry air flow qair =10 slm with qKr=10 sccm, working
pressure p=600 mbar.
Figure 14. Fluorescence decay of the Kr 5p 3 2′
[ ]
2 state recorded in the vacuum cell.[ ]
15p 3 2 state at 829.8 nm which are also transmitted through the interferential filter. The Kr 5p 1 2′
[ ]
1 energy level is close to the energy level of the laserpumped state and is probably populated by collisional transfer process starting from the excited state. The observed 5p 3 2
[ ]
1 population has been alreadyobserved by Chang et al. [12] following a selective excitation of Kr 5p 3 2
[ ]
2 [image:18.595.209.539.355.599.2]DOI: 10.4236/jasmi.2017.74008 111 Journal of Analytical Sciences, Methods and Instrumentation
sure that the the population of theses states by quenching can be neglected by keeping the krypton pressure below 0.1 mbar.
Secondly, Kr-TALIF measurements are performed in the vacuum cell with the same air-krypton mixture used in the gas-conditioning cell for calibration (p=600 mbar with 0.1% amount of krypton). For these conditions, only the emission at 826.3 nm is detected through the narrow band interferential filter. The ratio of the Kr-TALIF signals measured in pure krypton at very low pressure (=0.01 mbar) and in a air-krypton mixture give the effective branding ratio
( )
2 Kr
a required for calibration in the gas-conditioning cell. Taking into account
the pure optical branching ratio given by Piracha et al. [15] a20
( )
Kr =0.93, the effective branching ratio used for calibration is( )
32 Kr 4.7 10
a = × − . This
experimental value gives a qualitative indication of the quenching rate
Q
of the Kr 5p 3 2′[
]
2 state at 600 mbar in air + 0.1% Kr mixture. This value9 1
6.02 10 s
Q= × − is relatively close to the one calculated from the quenching
coefficients given by Niemi et al. [11] ( 9 1
5.80 10 s
Q= × − ).
4.4. Measurements of N (
4S) Density in the Microwave Air Plasma
Column
The absolute atomic density of nitrogen background state, calibrated in situ with krypton, is given by the ratio of the energy-normalized TALIF signals using Equation (10).
The ratio of the two photon excitation cross sections is ( )( )
( )
( )
2 2 Kr 0.67 N σσ = with an estimated uncertainty of 50% according Niemi et al. [11]. The laser excitation wavelengths are λ =N 206.673 nm and λ =Kr 204.150 nm. The count
sensitivities of the PMT are nearly equal according to the specifications
(
( )
5 1 1N 3.6 10 s pW
η
= × − ⋅ − ,( )
5 1 1Kr 3.8 10 s pW
η
= × − ⋅ − ) and the measuredtransmissions of the interference filters are T
( )
N =47% and T( )
Kr =89%. The two dimensional N-TALIF signals are measured as a function of the axial position with a step interval of 5 mm between 15 mm to 50 mm from the nozzle while the measurements are done along the radial position of air plasma column with a step of 1 mm. The resulting maps of the nitrogen density for a dry air flux and humid air flux are shown in Figure 15 and Figure 16. Reproducibility of the results over several days is better than 20% and the uncertainty of the absolute N-density measurements depends obviously first on the accuracy of the cross section ratio ( )( )( )
( )
2 2 Kr N σDOI: 10.4236/jasmi.2017.74008 112 Journal of Analytical Sciences, Methods and Instrumentation
Figure 15. Atomic nitrogen density (cm−3). Dry air flow
air 10 slm
q = , microwave power
1 kW MW
P = , working pressure p=600 mbar.
Figure 16. Atomic nitrogen density (cm−3). Dry air flow
air 10 slm
q = , water flow
2
H O 18.5 g h
q = , microwave power PMW =1 kW, working pressure p=600 mbar.
that N-density values are more or less underestimated because the calculations of the branching ratios a2
( )
N do not include the quenching of laser excited N atoms by O atoms or excited species like O2 metastable states. Thus, the relative [image:20.595.260.486.361.617.2]DOI: 10.4236/jasmi.2017.74008 113 Journal of Analytical Sciences, Methods and Instrumentation
tacking into account the contribution of the cross section ratio. The relative uncertainties taking into account all contributions reach approximately 70%.
Figure 15 and Figure 16 show that the atomic nitrogen density is higher near the nozzle where the maximum gas temperature is measured: 15 3
1.6 10× cm− for humid air flux (Tg =5400 K ) and 15 3
0.96 10× cm− for dry air flux (Tg =4100 K). The atomic density decreases slightly along the axis of the
plasma column and more substantially along the radius.
From the knowledge of the previously measured N(4S) density and gas
temperature it is possible to estimate the molecular nitrogen dissociation along the air plasma column using gas law state. Figure 17 displays the ratio between N(4S) density and N
2(X) background gas along the
z
axis where radial positionis equal to zero. It is noteworthy that:
• N2(X) dissociation is more important in the case of humid air (about 5 times
larger) even if it remains low (only 0.55% of dissociation for instance at position
z
=
15
mm
of the air plasma column);• N2(X) dissociation decreases for increasing
z
position far from the nozzledue to the progressive gas plasma cooling which automatically leads to an increase of N2(X) density and in the same time to a decrease of N2(X)
dissociation.
As expected, the measured N(4S) densities are maximal on the axis of the
plasma column in the regions close to the nozzle where the temperature of the air plasma is higher. The obtained N(4S) density magnitudes are coherent with
[image:21.595.208.539.441.689.2]regard to temperature and pressure conditions considered in both dry and humid air. In addition, N(4S) density for instance on the position of axis
r
=
0
Figure 17. Ratio between N(4S) density and N
2(X) background gas along the z axis for 0 mm
DOI: 10.4236/jasmi.2017.74008 114 Journal of Analytical Sciences, Methods and Instrumentation
and
z
=
15 mm
(
15 3)
3.0 10 cm N
n = × − is much lower than N(4S) density
calculated under thermodynamic equilibrium for the same temperature and pressure
(
16 3)
9.2 10 cm N
n = × − . This means that the air plasma column behaves
as a post-discharge when ejected from the resonant cavity. In fact, such an air plasma continually recombines and tries to relax towards its equilibrium state. The present results clearly show that no equilibrium states can be reached neither chemically since N(4S) density is different from its thermodynamic
equilibrium value nor energetically.
5. Conclusion
Measurements of absolute density of atomic ground state Nitrogen (N4S) due to
molecular nitrogen dissociation are performed for the first time in the literature along hot air plasma column. The latter is generated by a microwave resonant cavity at 2.45 GHz and 1 kW for injected power and 600 mbar for pressure inside the conditioning gas cell. Calibrated measurements based on TALIF laser diagnostics are done in both dry and humid air while the needed rotational temperature is estimated from OH (A-X) spectra measured using OES spectroscopy. The rotational temperatures in humid air plasma column (50% of humidity) are larger than those of dry air plasma column by practically 30% near the nozzle of resonant cavity on the axis of the plasma column. The advantage of the present work is to have set up specific experimental tool and methodology to measure the absolute density of atomic nitrogen in the hot air plasma with a good axial and radial spatial resolution. This allows to obtain the dissociation degrees of molecular nitrogen in both dry and humid air plasmas along the air plasma column. These gas dissociations are lower than those obtained when assuming thermodynamic and chemical equilibrium. This clearly characterizes the absence of chemical and energetic equilibriums that are not yet reached in the present air plasma column dominated by recombination processes.
Acknowledgements
The authors would like to thank CEA-DAM-DIF for the financial support of the plasma experimental setup.
References
[1] Marchal, F., Yousfi, M., Merbahi, N. and Piquemal, A. (2014) Measurements of Absolute Atomic Oxygen Density by Two-Photon Absorption Laser-Induced Fluo-rescence Spectroscopy in Hot Air Plasma Generated by Microwave Resonant Cavi-ty. Physical Science International Journal, 4.
[2] Marchal, F., Yousfi, M., Merbahi, N., Wattieaux, G. and Piquemal, A. (2016) Quan-titative Determination of Density of Ground State Atomic Oxygen from Both TALIF and Emission Spectroscopy in Hot Air Plasma Generated by Microwave Re-sonant Cavity. Plasma Science and Technology, 18.
At-DOI: 10.4236/jasmi.2017.74008 115 Journal of Analytical Sciences, Methods and Instrumentation mospheric Pressure Plasma Jets: Measurement and Numerical Simulation. Plasma Sources Science and Technology, 20, 259-265.
[4] Mazouffre, S., Foissac, C., Supiot, P., Vankan, P., Engeln, R., Schram, D.C. and Sa-deghi, N. (2001) Density and Temperature of N Atoms in the Afterglow of a Mi-crowave Discharge Measured by a Two-Photon Laser-Induced Fluorescence Tech-nique. Plasma Sources Science and Technology, 20, Article ID: 055005.
[5] Es-Sebbar, E., Benilan, Y., Jolly, A. and Gazeau, M.-C. (2009) Characterization of an N2 Flowing Microwave Post-Discharge by OES Spectroscopy and Determination of Absolute Ground-State Nitrogen Atom Densities by TALIF. Journal of Physics D:
Applied Physics, 42, Article ID: 135206. https://doi.org/10.1088/0022-3727/42/13/135206
[6] Lambropoulos, P. (1976) Topics on Multiphoton Processes in Atoms. Advances in Atomic and Molecular Physics, 12.https://doi.org/10.1016/S0065-2199(08)60043-3 [7] Saxon, R.P. and Eichler, J. (1976) Theoretical Calculation of Two-Photon
Absorp-tion Cross SecAbsorp-tions in Atomic Oxygen. Physical Review A, 34, 199-206. https://doi.org/10.1103/PhysRevA.34.199
[8] Faist, M.B. and Bernstein, R.B. (1976) Computational Study of Elastic and Elec-tronically Inelastic Scattering of Br by Ground State I Atoms: Role of Potential Curve Crossing. The Journal of Chemical Physics, 64, 2971-2984.
https://doi.org/10.1063/1.432556
[9] Van Gessel, A.F.H., van Grootel, S.C. and Bruggeman, P.J. (2013) Atomic Oxygen TALIF Measurements in an Atmospheric-Pressure Microwave Plasma Jet with in situ Xenon Calibration. Plasma Sources Science and Technology, 22, Article ID: 055010.https://doi.org/10.1088/0963-0252/22/5/055010
[10] Luque, J. and Crosley, D.R. (1999) LIFBASE: Database and Spectral Simulation Program (Version 1.5). SRI International Report MP, 99.
https://www.sri.com/engage/products-solutions/lifbase
[11] Niemi, K., Schulz-von der Gathen, V. and Döbele, H.F. (2001) On the Relative Transition Probabilities of Rare Gases in the 1si-2pj Region. Journal of Physics D:
Applied Physics, 34.
[12] Chang, R.S.F., Horiguchi, H. and Setser, D.W. (1980) Radiative Lifetimes and Two-Body Collisional Deactivation Rate Constants in Argon for Kr (4p55p) and Kr (4p55p’) States. The Journal of Chemical Physics, 73, 778.
https://doi.org/10.1063/1.440185
[13] Adams, S.F. and Miller, T.A. (1998) Two-Photon Absorption Laser-Induced Fluo-rescence of Atomic Nitrogen by an Alternative Excitation Scheme. Chemical Phys-ics Letters, 295, 273-388.https://doi.org/10.1016/S0009-2614(98)00972-5
[14] Ledru, G., Marchal, F., Sewraj, N., Salamero, Y. and Millet, P. (2006) Comparative Study of the Formation and Decay of Xenon Excimers Following Selective Excita-tion of the 5p56s States: Spectroscopic and Kinetic Analysis. Journal of Physics B:
Atomic, Molecular and Optical Physics, 39, 2031-2057. https://doi.org/10.1088/0953-4075/39/8/020
[15] Piracha, N.K., Duncan-Chamberlin, K.V., Kaminsky, J., Delanis, D. and Baig, M.A. (2014) On the Relative Transition Probabilities of Rare Gases in the 1si-2pj Region.


![Table 1.2(Kr 5p 3 2(′[]) Radiative lifetimes and room temperature quenching coefficients of )](https://thumb-us.123doks.com/thumbv2/123dok_us/49120.505082/15.595.209.540.64.311/table-kr-radiative-lifetimes-room-temperature-quenching-coefficients.webp)

