Munich Personal RePEc Archive
Do economic freedom and board
structure matter for bank stability and
bank performance?
Mavrakana, Christina and Psillaki, Maria
University of Piraeus
2019
1
Do economic freedom and board structure matter for bank stability and bank
performance?
Maria Psillaki1
Department of Economics, University of Piraeus Christina Mavrakana2
Department of Economics, University of Piraeus
Abstract
This paper investigates the effects of economic freedom, regulations and bank governance on bank performance and risk-taking in 18 European countries for the period 2004–2016.To this end, we use the Fraser economic freedom index and its sub-components namely credit, labor and business market regulation. Our results reveal that economic freedom increases bank performance and contributes to financial stability and soundness. Moreover, we show that liberal credit, labor and business regulation improves the profitability of banks and reduces risk-taking. Regarding the bank governance variables, we find that a large board increases the probability of default whilst the results are mixed for bank performance. Also, we show that experienced directors are associated with less risk-taking and better bank performance. The impact of female directors is positive on bank performance. Regarding the risk-taking of banks, we find that, in a liberal environment, women lead to less credit risk. Finally, the compensation of directors increases bank performance and reduces risk-taking. Our findings change depending on the time period and the location.
Keywords: Fraser economic freedom index, bank stability, regulation, bank governance, bank performance
JEL Classification: G28; G21; P34; P51
1 Corresponding author: Professor, Department of Economics, University of Piraeus, 80 str. Karaoli&Dimitriou 18534
Piraeus, GREECE, Email: psillaki@unipi.gr; Tel: +302104142299.
2 Ph.D. Candidate, Department of Economics, University of Piraeus, 80 str. Karaoli&Dimitriou 18534 Piraeus,
2
1. Introduction
Banks play a crucial role in the entire economy as they provide essential financial services and, hence, contribute to economic growth and development (Barth et al., 2006). Because of the importance of banks on economic activities it is not surprising that so much attention has been given on the regulation and supervision of the banking sector (Chortareas et al., 2013; Barth et al., 2006; Laeven and Levine, 2009). More precisely, banks should be regulated and supervised not only to protect investors and consumers but also to safeguard the soundness of the financial system (Barth et al., 2013; Chortareas et al., 2013).
The global financial crisis revealed weaknesses concerning the regulatory framework of financial institutions and, thus, re-activated the debate of whether regulatory reforms can promote well-functioning banking systems (Pasiouras et al., 2009; Sufian and Habibullah, 2010). In this context many rules and recommendations, such as the Sarbanes-Oxley Act of 2002 and the Basel II,III3, have been issued by regulators and policymakers to promote a more resilient banking sector and enable market participants to make better risk assessments (Chortareas et al., 2013; Barth et al., 2013). However, stricter regulation and direct control of banks by the government may have a negative impact on the economic growth by limiting the economic freedom (Sufian and Majid, 2011; Chortareas et al., 2013). Economic freedom is broadly defined as the freedom to prosper within a country without intervention from a government or economic authority.
Economic freedom plays a vital role to the development of the banking system as it encourages the business environment and contributes to the development of innovative ideas. More precisely, greater economic freedom is likely to lead to a better environment for business and, thus, better economic growth and better banking performance (Sufian and Majid, 2011; Chortareas et al., 2013; Pasiouras et al., 2009). Despite the fact that the impact of economic freedom on the economy has been extensively studied (Bergh and Karlsson, 2010; Altman, 2008), its impact on the banking sector has attracted the interest of researchers only in recent years (Psillaki and Mamatzakis, 2017; Sufian and Majid, 2011; Sufian and Hassan, 2010; Sufian and Habibullah, 2010).
The aim of this essay is to examine whether and to what extent economic freedom and regulation of credit, labor and business market affect bank performance and risk-taking. In order to investigate the impact of regulation on bank performance and bank stability, we use an assortment of information
3In 2009 the Basel committee responded to the lessons of the crisis by taking measures to strengthen the Basel II
3
such as the Fraser economic freedom index4 (Gwartney et al., 2017), as well as restrictions on credit, labor and business markets. To our knowledge, this essay constitutes the first attempt to consider the impact of economic freedom and credit, labor and business market regulation in combination with bank governance variables, both on bank performance and risk-taking. Using this approach we check for possible changes on the effects of corporate variables on bank performance and stability. Regulators who are concerned with the safety and soundness of the banks may apply additional pressure and legal responsibility on boards and, hence, may affect their impact on bank performance and stability (Barth et al., 2013; Pasiouras et al., 2009).
Moreover, we take into consideration the two different theoretical perspectives that concern the effects of banking regulation; the "public interest view" and the "private interest view" (Shleifer and Vishny, 1998; Barth et al., 2006; Laeven and Levine, 2005). According to the "public interest view", it is believed that banking restrictions would be beneficial as they lead to smaller financial institutions which are easy to monitor. Moreover, when banks operate in a heavily strict environment, they have fewer opportunities to increase risk (Boyd et al., 1998; Barth et al., 2006). In contrast, the "private interest view" holds that there are many advantages when banks are permitted to engage in a broad range of activities (Sufian and Habibullah, 2014; Beach and Kane, 2008). A competitive banking system would limit the ability of regulators to extract bribes, would contribute to the efficient management of financial intermediaries and to the improvement of monetary policy transmission via the interbank market rate and, thus, to the economic growth (Claessens and Laeven, 2004; Beck et al., 2003; Van Leuvensteijn et al., 2008).
Due to the lack of knowledge about the effects of adopting stricter regulation or having more economic freedom on banks, we address the following questions:
Does economic freedom lead to an increase in bank risk-taking?
Does economic freedom matter for bank performance?
Does credit market regulation affect bank stability and performance?
Does labor market regulation increase bank performance and decrease risk-taking?
Does business market regulation reduce bank risk-taking and improve bank performance?
Do the macroeconomic variables change the impact of bank governance variables on bank performance and risk-taking?
4 The Fraser economic freedom index consists of size of government, legal structure and security of property rights,
4
In order to answer the above questions, we take into consideration our findings from the first essay. More precisely, we use bank governance variables which are considered as main variables of corporate governance (Pathan and Faff, 2013; Belhaj and Mateus, 2016) in conjunction with macroeconomic variables namely, economic freedom, regulation of credit, labor and business market, stock market capitalization and foreign bank assets, to check whether there is any differentiation in the impact of corporate governance variables on bank performance and risk-taking. Moreover, we control for country-level characteristics such as economic conditions taking into account the annual growth of GDP and the annual rates of inflation (Pasiouras, 2008; Maudos et al., 2002; Demirguc-Kunt et al., 2004; Beck et al., 2003).
Moreover, using a sample of commercial banks from 18 different European countries for the period 2004-2016, this essay provides new evidence to the existing literature by considering both developed and developing countries. Prior studies in the literature (Mamatzakis et al., 2013; Sufian and Habibullah, 2010; Sufian and Majid, 2011) analyzed the effect of economic freedom on bank efficiency focusing on Central and Eastern European countries (Psillaki and Mamatzakis, 2017; Mamatzakis et al., 2013; Wah Low et al., 2010; Koutsomanoli-Filippaki et al., 2009b). Also, in order to check for any changes according to location we grouped countries in three separated groups according to their geographic location, such as South, North and Central Europe. Bank regulation differs from country to country as there is a difference in the freedom which permits banks to engage in a range of different activities (González, 2005).
Finally, by analyzing the extent to which a major global shock, that is the recent financial crisis, may have altered regulation and restrictions on banks. More precisely, we investigate the period before, during and after the global financial crisis paying particular attention to the effects of regulatory reforms on bank performance and risk-taking. Due to the fact that today, the largest banks continue to face political and regulatory pressure, the need to rethink bank regulation is of particular importance. Especially, European banks are in a turning point as they face many challenges and also are forced to better understand and respond to the sources of pressure such as regulators and investors (Barth et al., 2013; Houston et al., 2010).
5
2. Literature review and hypotheses development
This section presents the literature review and develops the hypotheses regarding the impact of economic freedom and regulations (credit, labor, business) on bank performance and risk-taking.
2.1 Economic freedom, bank performance and risk-taking
The results from previous empirical studies (Sufian and Habibullah, 2010; Wah Low et al., 2010; Sufian and Majid, 2011) regarding the impact of economic freedom on bank efficiency are mixed and hence, need to be further examined. Sufian and Hassan (2010) using a sample of five South East Asian countries for the period 1994-2008, find that economic freedom improves the environment associated with innovation and entrepreneurship, and, thus has a positive impact on economic development and bank performance. This means that when financial institutions operate in a less restricted environment they are more likely to engage in competitive policies and, hence, achieve higher levels of performance.
Similarly, Sufian and Habibullah (2010) examining a sample of Malaysian banks from 1999 to 2007, show that economic freedom has a positive effect on bank profitability. One possible explanation for this result is that economic freedom allows banks to lead to foreign financial institutions and companies. In addition, Baier et al. (2012) analyzing bank data from different countries during the period 1976-2008 report that greater levels of economic freedom are associated with a lower probability of financial crises, thus suggesting that more freedom is conducive to a more stable financial system.
Moreover, Sufian and Majid (2011) analyzing a sample of Islamic banks during the period 2000-2008, provide evidence that there is a positive and statistically significant relationship between economic freedom and bank performance. Economic freedom contributes to the promotion of a sound banking system which is vital for sustainable economic growth. Furthermore, authors support that countries with higher level of economic freedom are more likely to enjoy higher living standards. Their findings corroborate the research conducted by Holmes et al. (2008) who claim that a high level of economic freedom is associated with a high level of GDP per capita and, hence, this in turn may lead to a high demand for banking services.
6
performance in Singapore but the effect is negative on the other countries. One possible explanation for this result is that Singapore is widely recognized as a highly open economy with a well developed banking system (Wah Low et al., 2010) and more economic freedom.
In the same line, Demirguc Kunt et al. (2004) using data from 72 countries over the 1995-1999 period find that better institutional framework, as captured by the index of economic freedom, decreases bank performance, measured by the net interest margin. A possible explanation is that in countries where the economic freedom is high, it tends to increase competition in the banking sector from other financial intermediaries such as hedge funds and private equity and, thus, have a negative impact on bank performance.
Moreover, Ghosh (2016) employing bank data from MENA (Middle East and North Africa) countries during the period 2000-2012, shows that economic freedom has a positive and statistically significant impact on bank risk-taking measured by Z-Score and non-performing loans. According to the author, it is believed that more restrictions on banking activities and, therefore less economic freedom improve bank soundness and lead to less risk-taking.
The above argument gives rise to following hypotheses:
Hypothesis 1.a (H1.a): Economic freedom is positively related with bank performance
Hypothesis 1.b (H1.b): Economic freedom is negatively related with bank performance
Hypothesis 1.c (H1.c): Economic freedom increases bank risk-taking
Hypothesis 1.d (H1.d): Economic freedom reduces bank risk-taking
2.2 Credit, labor and business market regulation, bank performance and risk-taking
2.2.1 Credit market regulation, bank performance and risk-taking
7
and Levine, 2007;).
Moreover, many economists (Barth et al., 2000; Haubrich and Santos, 2005; Claessens and Laeven, 2004; Evanoff, 1998) believe that regulatory restrictions may be inefficient for banks. A possible explanation is that such restrictions on banking activities can limit the exploitation of economies of scale. Also, in the developing countries where state control of bank lending decisions tends to be higher than private control, it is likely to lead to lower bank performance. One possible explanation for this result is that banks lend more to less creditworthy companies.
On the contrary, the "public interest view" supports that there are many theoretical reasons that advocate stricter regulations on bank activities. Firstly, it is believed that when banks are allowed to engage in a broader range of activities then it is more likely to have more opportunities to increase risk (Barth et al., 2006; Boyd et al., 1998; Saunders, 1994). Another reason for tighter regulations is that governments usually act in the interests of the public and regulate banks to ensure financial stability and ameliorate market failures.
Claessens and Laeven (2004) examined the effects of entry and regulations on banking activities in 50 countries for the period 1994-2000 and found that stricter restrictions on banking activities resulted in lower competition and, thus, in lower bank efficiency. This happens because competition in the banking sector is crucial for the quality of financial products, the degree of financial innovation and the efficient production of financial services (Claessens and Laeven, 2004).
Furthermore, Chortareas et al. (2013) examining bank data from 27 European countries over the period 2001-2009, show that financial freedom has a positive and significant impact on bank efficiency. One possible explanation for this result is the fact that when banks operate in a less restricted environment it is likely to increase competition and to achieve higher levels of efficiency. Similarly, Barth et al. (2013) based on a sample of banks from 72 countries for the period 1999-2007 find that tighter regulations reduce bank efficiency. Moreover, they indicate that greater independence of supervisory authority enhances bank efficiency level.
8
In the same vein, Mamatzakis et al. (2013) using the Fraser index in a sample of 10 Central and Eastern European countries during the period 2000-2010 provide evidence that certain aspects of credit regulation, such as interest rate controls have a negative and statistically significant impact on bank efficiency. This means that the limitations in the interest rate control can act as a barrier for banks to invest in high-risk and high-return projects (Jimenez et al., 2010).
However, Laeven and Levine, 2005 claim that broad banking activities may lead to the formation of complex entities which are difficult to monitor. In addition, the "public interest view" supports that government can contribute to bank stability and protect the economy from the negative effects of bank failure, through effective screening on bank activities (Barth et al., 2006).
Furthermore, Koutsomanoli-Filippaki et al. (2009b) analyzing a dataset of banks from 11 Central and Eastern European countries over the period 1998-2005 show that there is a positive relationship between profit efficiency and banking reform using the European Bank for Reconstruction and Development (EBRD) index of banking sector. Similarly, Delis et al. (2011) using a sample of commercial banks from 22 transition countries between 1999 and 2009 find that regulations which promote monitoring and restrictions on bank activities have a positive impact on bank productivity.
This result is corroborated by González (2009) who claim that banks with stricter regulations reduce
risk-taking in poorly developed financial markets and increase bank efficiency over the period 1996-2002.
Moreover, Agoraki et al. (2011) based on a sample of Central and Eastern European banks from 1998-2005 support that increased regulation, through higher capital requirements and activit y restrictions in combination with a higher level of market power reduce both credit risk and the risk of default. A possible explanation is that restrictions in banking activities increase the likelihood that banks would suffer during financial crises.
The above argument gives rise to following hypotheses:
Hypothesis 2.1.a (H2.1.a): Credit market regulation is positively related with bank performance
Hypothesis 2.1.b (H2.1.b): Credit market regulation is negatively related with bank performance
Hypothesis 2.1.c (H2.1.c): Credit market regulation increases bank risk-taking
9
2.2.2 Labor market regulation, bank performance and risk-taking
Labor market restriction index consists of hiring regulations and minimum wage, hiring and firing regulations, centralized collective bargaining, hours regulations, mandated cost of worker dismissal and conscription (Gwartney et al., 2017). The aim of labor market regulation is to protect employees from arbitrary actions on the part of the employers (Mamatzakis et al., 2013). According to Bertola (2009), factors such as limited wage setting flexibility and regulatory constraints on firing affect labor market dynamics. In many counties, labor market regulations are an important and controversial issue which constrains the ability of businesses to adjust employment levels.
Several studies (Botero et al., 2004; Blanchard and Wolfers 2000; Besley and Burgess 2004; Scarpetta and Tressel, 2004) that relate the labor market regulations to economic outcomes, show that stricter labor regulations tend to decrease economic performance. However, little is known concerning the impact of labor market regulations on bank performance and risk-taking. Mamatzakis et al. (2013) based on a sample of 10 CEE countries during the period 2000-2010 find that there is a positive relationship between liberal labor regulation and bank performance. According to the author, liberal reforms in the labor market may decrease employee complacency and, hence, could lead to an increase in bank performance.
In the same vein, Psillaki and Mamatzakis (2017) using data from 10 Central and Eastern European (CEE) countries for the period 2004 to 2009, show that labor market reforms have a positive and statistically significant impact on bank efficiency. This means that less regulatory restrictions are more likely to increase bank efficiency. One possible explanation for this result is that stricter employment protection legislation affects negatively firm returns and therefore, results in declining productivity growth (Scarpetta and Tressel, 2004; Besley and Burgess, 2004).
On the contrary, other empirical studies claim that stricter labor regulation can increase bank performance. More precisely, Koutsomaloni-Filippaki and Mamatzakis (2013) using bank data from 15 European countries during the period 2005-2010, report that there is a negative and statistically significant relationship between labor market regulations and bank efficiency. Their findings indicate that greater market liberalization would reduce bank efficiency.
10
specific skills of employees and to intensive technology (Autor et al., 2007).
The above argument gives rise to following hypotheses:
Hypothesis 2.2.a (H2.2.a): Labor market regulation is positively related with bank performance
Hypothesis 2.2.b (H2.2.b): Labor market regulation is negatively related with bank performance
Hypothesis 2.2.c (H2.2.c): Labor market regulation increases linked to bank risk-taking
Hypothesis 2.2.d (H2.2.d): Labor market regulation reduces linked to bank risk-taking
2.3 Business market regulation, bank performance and risk-taking
Business market regulation index comprises of administrative requirements, bureaucracy costs, regulation about starting a business, extra payments, licensing restrictions and cost of tax compliance (Gwartney et al., 2017). It refers to entry barriers and constrains that may reduce competition and, thus, may also affect bank performance. It is believed that regulatory entry barriers and bureaucratic procedures lead to a reduction in new firms entering in a business and hence, resulted in decreased competition (Klapper et al., 2006).
Chortareas et al. (2013) supports that revenues generated by new businesses have a significant impact on bank profitability. For instance, business regulations and entry barriers can lead to decreased competition, reduced growth and less productivity (Klapper et al., 2006; Loayza et al., 2005). This, in turn has a negative impact on bank performance as firms would not be able to fulfill their obligations to the banks.
In this context, Sufian and Habibullah (2010) using a sample of Malaysian banks from 1999 to 2007, indicate that business freedom has a positive effect on bank profitability. Similarly, Psillaki and Mamatzakis (2017) based on a sample of 10 Central and Eastern European (CEE) countries from 2004 to 2009 find evidence that there is a positive and statistically significant relationship between business regulations on bank efficiency. This means that less regulatory restrictions and entry barriers that concern new businesses are more likely to increase bank efficiency through increased competition and economic growth and development.
11
means that greater freedom to start, operate and close a business, tends to lower bank entry barriers, and hence, intensify competition and impede bank efficiency.
Moreover, business market regulations may also affect bank risk. More precisely, increased business regulations may prompt informality, and, thus, making it harder for banks to assess the creditworthiness of a company (Loayza et al., 2005). This may lead to high levels of non-performing loans and to more credit risk for banks.
Based on the existing literature our hypotheses are as following:
Hypothesis 2.3.a (H2.3.a): Business market regulation is positively related with bank performance
Hypothesis 2.3.b (H2.3.b): Business market regulation is negatively related with bank
performance
Hypothesis 2.3.c (H2.3.c): Business market regulation increases bank risk-taking
Hypothesis 2.3.d (H2.3.d): Business market regulation reduces bank risk-taking
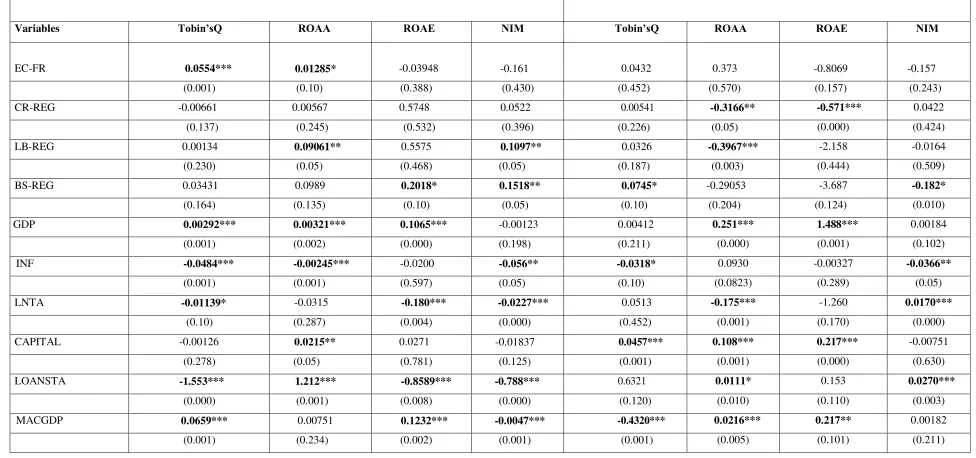
2.4 The impact of global financial crisis (GFC) on bank performance and risk-taking
The post-crisis agenda raised questions about regulation and its impact on bank performance and risk-taking. It was recognized that supervision prevents banks from engaging in risky behavior and therefore contribute to bank performance and stability. Shehzad and De Haan (2008) using a sample of developing and developed countries for the period 1981-2002 examine the impact of financial liberalization on systemic and non-systemic banking crises.5 Their results indicate that financial liberalization reduces the likelihood of systemic crises. Few years later, Barth et al. (2013) show that when banks suffer from banking crisis then stricter regulations would be beneficial as they result in a higher bank performance and in a more stable financial system.
In the same vein, Baier et al. (2012) based on a sample from different countries during the period 1976-2008 find that higher economic freedom is associated with lower probability of a banking crisis. Financial liberalization is considered to enhance financial development as banks can exploit opportunities from increased competition. Also, they report that credit market regulation increases after a financial crisis. A possible explanation for this result is that in the post-crisis period there is a diminution in economic freedom and its components that stems from tighter regulation and slower
5 Systemic banking crisis is a crisis in which more or all bank capitals have been exhausted (Caprio and Klingebiel,
12
economic growth. Similarly, De Haan et al. (2009) analyze the effects of crises on economic freedom in Norway and Sweden for 1985-2005 and find that economic freedom falls right after a crisis but then increases.
However, Beltratti and Stulz (2012) using data from different countries over the period 2007-2008 provide evidence that stricter regulation on banking activities resulted in banks performing better during the crisis. Authors believe that traditional bank activities are less exposed to the risks that turn out poorly during the crisis and also support that financial liberalization induces risk-taking behavior and may contribute to banking crises, and hence, to financial instability.
Hypothesis 3.a (H3.a): Compared to ‘normal times’, the predicted relation between economic freedom, regulation of credit, labor, business market and bank performance varies following the
financial crisis.
Hypothesis 3.b (H3.b): Compared to ‘normal times’, the predicted relation between economic freedom, regulation of credit, labor, business market and risk-taking is less pronounced following
the financial crisis.
3. Data and methodology
In this section we analyze the bank sample and the data sources. Furthermore, we describe in detail the variables used in the regression equations and, finally, we present the methodology.
3.1 Sample and Data
13
3.2 Variables
In this sub-section we describe in detail the set of variables considered in our study namely, the dependent variables, the main explanatory variables and the control variables.
3.2.1 Dependent variables
In line with previous studies (Belhaj and Mateus, 2016; Pathan and Faff 2013; Andres and Vallelado 2008; Setiyono and Tarazi 2014), we employ alternative proxies of bank performance (PERFOR) and risk-taking (RISK) that are commonly used in the existing literature as they provide us with different types of information on governance, the multiple proxies of performance and risk. Finally, we will check the robustness of our findings using these different proxies of bank performance and risk. These are, return on average assets (ROAA), return on average equity (ROAE), net interest margin (NIM) and Tobin'sQ ratio for bank performance, Z-Score, non-performing loans (NPL) and Tier1-capital ratio for risk-taking. .
Return on average assets (ROAA) is an accounting-based measure of bank profitability. It is the net
income after taxes, as a percentage of total assets (Pathan and Faff, 2013; Andrés and Vallelado,
2008). Return on average assets (ROAA) reflects the capability of a bank to generate profits from its asset management functions. Moreover, it is used as the key ratio for the evaluation of bank performance in the existing literature (Claessens and Laeven, 2004; Mamatzakis and Bermpei, 2016). Return on average equity (ROAE) is the net income after taxes as a percentage of equity (Aebi et al., 2012). It is a direct measure of returns to shareholders and is influenced by the capital structure of a financial institution. Banks with higher leverage, and hence, lower equity, generally record lower percentage of return on average assets (ROAA) but higher percentage of return on average equity (ROAE). Moreover, return on average equity (ROAE) explains how effectively
shareholder’s funds are being used by the management of the bank.
14
derives from the fact that it records the value of future investment opportunities. Therefore, a high value of this index means that a bank has high growth potential.
The first measure of bank risk is Z-Score. It is used in bank governance literature (Bai and Elyasiani, 2013; Delis et al., 2012; Beltratti and Stulz, 2012; Laeven and Levine, 2009) referring to the relationship between bank risk and capital regulations, deposit insurance and other regulatory policies. It is defined as the mean of ( OA) + AR/σ ( OA) where ROA is the return on assets and CAR is the capital-asset ratio. Hence, Z-Score can be defined as a measure of the distance to default (Bai and Elyasiani, 2013). A lower value of Z-Score indicates higher bank risk.
Non-performing loans (NPL) is used as a proxy for credit risk and financial stability. It is the ratio of loans loss provisions divided by total loans (Pathan et al., 2008). According to the European Central Bank (ECB, 2017), it is a credit risk measure that directly affects the profitability of banks and, hence, financial stability. A high percentage of this proxy means that there is an increase on credit portfolio which could spillover and affects the stability of the financial system (ECB, 2017).
Finally, the Tier 1 capital ratio6 is the ratio of a bank's core equity capital to its total risk-weighted assets (RWA). Risk-weighted assets are the total of all assets held by the bank weighted by credit risk according to a formula determined by the Basel rules (BCBS, 2010). It is a key measure of a bank's financial strength.
3.2.2 The Fraser Index of Economic Freedom indicators
According to Gwartney et al. (2017) the Fraser economic freedom index measures the degree to which the policies and institutions of countries are supportive of economic freedom. A country has to provide secure protection of privately owned property and a stable monetary environment in order to receive a high economic freedom index. Moreover, it should have low levels of taxes, refrain from creating barriers to both domestic and international trade and rely more on markets than government (Gwartney et al., 2017; Pasiouras et al., 2009). Each component of economic freedom is placed on a scale from 0 for no freedom to 10 for maximum freedom.
The credit market regulation (CR-REG) component consists of the following sub-components: i) ownership of banks OWN), ii) private sector credit PR) and iii) interest rate controls (CR-IR). The sub-component ownership of banks (CR-OWN) measured as the percentage of deposits
15
held in private owned banks. The other two sub-components, namely private sector credit (CR-PR) and interest rate controls (CR-IR), indicate the extent to which credit is supplied to the private sector and whether controls on interest rates interfere with the market in credit (Gwartney et al., 2017). Higher levels of the credit regulation index denote less regulatory restriction.
However, we also consider the other two sub-components of regulation, namely labor market regulations and business regulation to examine their impact on bank performance and risk-taking. Labor market regulation (LB-REG) component, is designed to measure the extent to which these restraints upon economic freedom are present. In order to earn high marks in the component rating regulation of the labor market, a country must allow market forces to determine wages and establish the conditions of hiring and firing, and refrain from the use of conscription (Gwartney et al., 2017).
Finally, the business regulation (BS-REG) component presents the extent to which regulations and bureaucratic procedures restrain entry and reduce competition. In order to earn high score in this component, countries have to allow markets to determine prices and refrain from regulatory activities that retard entry into business and increase the cost of production. Moreover, they must refrain from using their power to extract financial payments and reward businesses at the expense of others (Gwartney et al., 2017).
3.2.3 Control variables
We use a number of bank-specific and country-specific variables. To begin with bank-specific
variables, bank size (LNTA), is defined as the natural logarithm of the bank’s total assets (Psillaki and Mamatzakis, 2017; Barth et al., 2013; Chortareas et al., 2013). Secondly, we employ the level of capitalization variable which is defined as the equity of total assets (CAPITAL) and it is used as a proxy for capital adequacy or capital risk (Chortareas et al., 2013; Belhaj and Mateus, 2016; Pathan and Faff, 2013). The next variable refers to the ratio of loans to total assets (LOANSTA) used as a proxy for asset utilization (Psillaki and Mamatzakis, 2017; Pasiouras, 2006; Mamatzakis et al., 2013). It is a measure of loan activity and it is expected to be positive as it is associated with well-functioning intermediation by financial institutions (Mamatzakis et al., 2013).
16
environment. Inflation (INF) equals the annual rate of the change in the Consumer Price Index7 2010 (CPI). It is believed that underdeveloped countries are linked to high levels of inflation (Boyd et al., 2001).
Another variable is the stock market capitalization to GDP (MACGDP) used as a proxy for the size of the stock market (Beck et al, 2003; Demirguc-Kunt and Huizinga, 2000; Pasiouras, 2008). Despite the fact that previous studies in the literature (Demirguc-Kunt and Huizinga 1999; Bart et al, 2006, Pasiouras et al., 2009) employed this indicator, their results still remain mixed. Moreover, to capture for the impact of the presence of foreign banks we use the percentage of foreign bank assets among total assets (FOREIGN) as a proxy for market structure (Psillaki and Mamatzakis, 2013; Pasiouras et al., 2009; Weill, 2003).
Finally, we employ some bank governance variables as explanatory variables. We use those that have the most significant impact on both bank performance and risk-taking in accordance with our findings in the first essay. More precisely, we use board size (BS), gender diversity (FEMALE), board financial experience (EXPER) and compensation (COMPENSATION).
According to Pathan and Faff (2013), Staikouras et al. (2007), board size (BS) is defined as the sum of the directors within a board (executive and supervisory). Financial experience (EXPER) is the average number of financial experience relevant either on the supervisory or executive board on which the director sits (Fernandes and Fich, 2013). The percentage of female directors (FEMALE) is defined as the percentage of women on the board (Owen and Temesvary, 2018). Finally, according to BoardEx definitions, compensation (COMPENSATION) is the sum of salary and bonus.
3.4 Empirical models and methodology
3.4.1 Fixed-Effects model
Our sample is a mixture of time series and cross-sectional analysis and as a consequence the most efficient tool to use is panel data analysis (Andres and Vallelado, 2008). The advantage of this method is that it takes into account the heterogeneity, which is the specific characteristics of each bank, such as the quality of management, business activity among others (Belhaj and Mateus, 2016).
The first econometric method we apply to control the impact of bank governance variables on bank performance and risk-taking is Fixed-Effects.8 When the unobserved effect is correlated with
17
independent variables, then this method gives unbiased estimators in contrast with Pooled OLS method which produces biased and inconsistent estimators.
Bank performance model
(PERFOR) i, t = β
0 + β1EC-FR i,t + β2CR-REG i, t + β3LB-REG i, t + β4BS-REG i, t + β5LNTA i,
t+β
6CAPITALi,+β7LOANSTAi,t+β8GDPi,t+β9INFi,t+β10MACGDPi,t+β11FOREIGNi,t+β12BSi,t+β13
EXPERi,t+β
14FEMALEi,t+β15COMPENSATIONi, + ui + εi,t (1a)
Bank risk model
(RISK) i, t = β
0 + β1EC-FR i t + β2CR-REG i, t + β3LB-REG i, t + β4BS-REG i, t + β5LNTA i, t+ β6CAPITALi,t+β
7LOANSTAi,t+β8GDPi,t+β9INFi,t+β10MACGDPi,t+β11FOREIGNi,t+β12BSi,t+β13E
XPERi,t+β
14FEMALEi,t+β15COMPENSATIONi, + ui + εi,t (1b)
Where PERFOR and RISK denote performance and risk-taking respectively for bank i, t the time period, lnthe natural logarithmic, β the parameters to be estimated, u the unobserved fixed-effect for bank i and ε the remaining disturbance term.
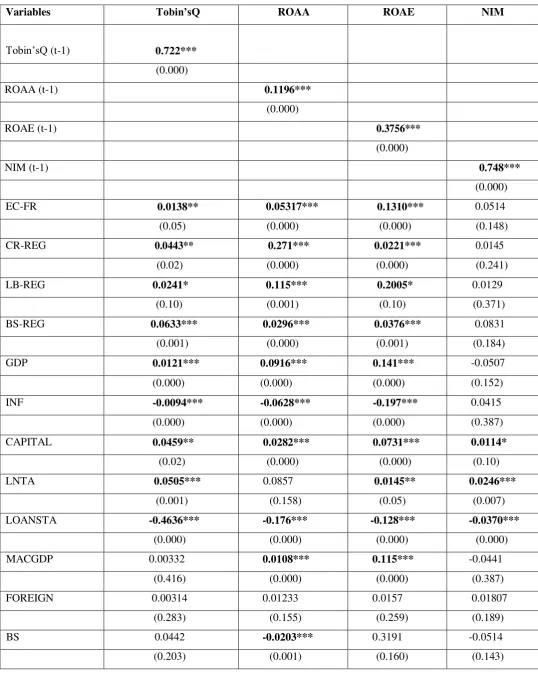
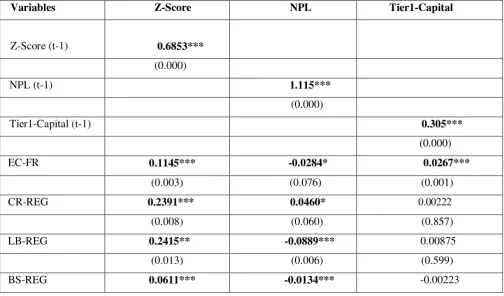
3.4.2 Endogeneity issues and Two-step system GMM model
To address the endogeneity problem in corporate governance literature, we use the two-step system estimator approach, proposed by Arrelano and Bover (1995) and Blundell and Bond (1998). This estimator involves the use of dynamic effect by adding a lagged dependent variable to the explanatory variable. Moreover, by applying the two-step system GMM, we can build instruments for endogenous variables. More precisely, to treat all potentially endogenous variables, we use their past values as their respective instruments (Vallascas and Hagendorff, 2013).
To test the validity of the multiple lags as an instrument, we calculate the Hansen/Sargan test (Pathan and Faff, 2013; Andres and Vallelado, 2008). The AR(1)and AR(2) measure first and second degree serial correlation. The residuals of the first differences AR(1) may be correlated but there should be no correlation in the second differences AR(2) (Cameron and Trivedi, 2009).
18
Bank performance model
(PERFOR) i, t = β
0 + β1PERFOR i, (t-1) + β2EC-FR i,t +β3CR-REG i,t+β4LB-REG i,t+ β5
BS-REGi,t+β
6LNTAi,t+β7CAPITALi,t+β8LOANSTAi,t+β9GDPi,t+β10INFi,t+β11MACGDPi,t+β12FOREI
GNi,t+β
13BSi,t+β14EXPERi,t+β15FEMALEi,t+β16COMPENSATIONi, + ui + εi,t (2a)
Bank risk model
(RISK) i, t = β
0 + β1RISK i, (t-1) + β2EC-FR i, t + β3CR-REG i, t + β4LB-REG i, t + β5BS-REG i, t + β6LNTAi,t+β
7CAPITALi,t+β8LOANSTAi,t+β9GDPi,t+β10INFi,t+β11MACGDPi,t+β12FOREIGNi,t+β1
3BSi,t+β14EXPERi,t+β15FEMALEi,t+β16COMPENSATIONi, + ui + εi,t (2b)
Where PERFOR and RISK denote performance and risk-taking respectively for bank i, t the time period, ln the natural logarithmic, β the parameters to be estimated, u the unobserved fixed-effect for bank i and ε the remaining disturbance term.
19
Table 1: Definition of variables
Variables Definition Database
Panel A: Dependent Variables
Tobin’sQ Tobin’sQ The sum of the market value of equity and the book value of liabilities divided by the carrying amount of total assets BankScope
ROAA Return on average assets The net income after taxes, as a percentage of total assets BankScope ROAE Return on average equity The net income after taxes as a percentage of equity BankScope NIM Net interest margin The net interest income as a percentage of average earning assets. BankScope
Z-Score Z-Score ratio The ratio of: mean( OAA)+ AR / st.dev ( OAA) BankScope NPL Non-performing loans The ratio of loans loss provisions divided by total loans BankScope Tier1-capital ratio Tier1-capital ratio The shareholder funds plus perpetual noncumulative preference shares as a percentage of risk weighted assets and off balance sheet
risks measured under the Basel rules. BankScope Panel B: The Fraser Index of Economic Freedom Indicators
EC-FR Economic Freedom It measures the degree to which the policies and institutions of countries are supportive of economic freedom. The cornerstones of economic freedom are personal choice, voluntary exchange, freedom to enter markets and compete, and security of the person and privately owned property. It measures the degree of economic freedom in five broad areas namely, size of government, property rights, access to sound money, freedom to trade international and regulation of credit, labor and business market. This variable takes values between 0 and 10 with higher values indicating greater economic freedom.
The 2017 version of the Fraser index of Economic Freedom CR-REG Credit Regulation It reflects conditions in the domestic credit market. This variable takes values between 0 and 10 with higher values indicating greater credit freedom.
The 2017 version of the Fraser index of Economic Freedom LB-REG Labor Regulation It measures the extent to which these restraints upon economic freedom are present. In order to earn high marks in the component rating regulation of the labor market, a country must allow market forces to determine wages and establish the conditions of hiring and firing, and refrain from the use of conscription. This variable takes values between 0 and 10 with higher values indicating greater labor freedom.
The 2017 version of the Fraser index of Economic Freedom BS-REG Business Regulation It identifies the extent to which regulations and bureaucratic procedures restrain entry and reduce competition. This variable takes values between 0 and 10
with higher values indicating greater business freedom.
The 2017 version of the Fraser index of Economic Freedom CR-OWN Ownership of banks This sub-component measures the percentage of bank deposits held in privately owned banks. Countries with larger shares of privately held deposits received
20
95% of the total, a rating of 8 was assigned. When private deposits were between 40% and 75% of the total, the rating was 5. When private deposits are between 10% and 40%, countries received a rating of 2. A zero rating was assigned when private deposits were 10% or less of the total.
The 2017 version of the Fraser index of Economic Freedom CR-PR Private sector credit This sub-component measures the extent to which government borrowing crowds out private borrowing. When data are available, this sub-component is
calculated as the government fiscal deficit as a share of gross saving. Higher values are indicative of greater credit freedom.
The 2017 version of the Fraser index of Economic Freedom CR-IR Interest rate controls Data on credit-market controls and regulations were used to construct rating intervals. Countries with interest rates determined by the market, stable monetary
policy, and positive real deposit and lending rates received higher ratings. When interest rates were determined primarily by market forces and the real rates were positive, countries were given a rating of 10. A zero rating was assigned when the deposit and lending rates were fixed by the government and real rates were persistently negative by double-digit amounts or hyperinflation had virtually eliminated the credit market.
The 2017 version of the Fraser index of Economic Freedom Panel C: Control Variables
LNTA Bank size The natural logarithm of total assets BankScope CAPITAL Capital adequacy ratio The ratio of equity to total assets BankScope LOANSTA Leverage ratio The ratio of loans to total assets BankScope
GDP GDP growth The rate of real per capita GDP growth. World Bank INF Inflation Annual rate of inflation. World Bank MACGDP Stock market capitalization
to GDP
The ratio of stock market capitalization to GDP. The variable serves as a proxy of financial development. World Bank
FOREIGN Presence of foreign banks Percentage of the total banking assets that are held by foreign banks. A foreign bank is a bank where 50 percent or more of its shares are owned by foreigners. World Bank COMPENSATION (in 000s) Compensation The sum of salary and bonus BoardEx FEMALE Female directors The percentage of directors on the board who are female BoardEx
21
4. Empirical results
4.1 Descriptive statistics and Correlation matrix
Table 2 provides the descriptive statistics on dependent variables, independent variables and control variables for the sample of European banks from 2004 to 2016. More precisely, panel A presents descriptive statistics of bank risk-taking and performance measures. The average Tobin'sQ fluctuates between 0.04% and 1.63%. Also the sample mean return on average assets (ROAA) is 0.64%. Our findings are in line with Belhaj and Mateus (2016) and Staikouras et al. (2007) who find that Tobin'sQ average is 1.03% and the mean return on assets (ROA) is 0.75% using a sample of 58 European banks. The average return on average equity (ROAE) is 7.89% while for net interest income (NIM) the mean is 1.72%. In the same direction, Belhaj and Mateus (2016) find an average return on equity ROE of 9.7% over the period 2002-2011. As the sample includes the crisis period we observe some negative values for our performance measures.
Regarding risk measures, we see in Table 2 that the average Z-Score is 10.11. This means that many banks face a default risk (Levine, 2004) as a higher Z-Score indicates that a bank has higher returns to cover its liabilities. The mean ratio of non-performing loans (NPL) is 6.91% with a maximum value of 44.86%. The mean of Tier1-capital ratio is 11.11% with a minimum value of 4.20%.
The variables in Panel B of Table 2 show that the average of economic freedom (EC-FR) is 7.49 with a minimum of 6.43 and a maximum of 8.30. Regarding the variable credit regulation, Table 2 demonstrates that credit regulation has an average 8.97 with a minimum of 6.00 and a maximum of 10.00. Moreover, the component of labor regulations has a mean of 6.43. The average of business regulation is 7.14 with a minimum value of 4.77 and a maximum value of 8.57. Our results corroborate those of Mamatzakis et al. (2013) who examined the impact of regulation on bank efficiency in Central and Eastern European countries during the period 2000-2010 and show that credit regulations are more established compared to the reforms of the labor and business market regulation.
22
period 2002-2011, is 11.62%. Banks are highly leveraged; the mean ratio of leverage is 12.63% while the maximum value is 89.06%. Moreover, the mean of GDP growth is 0.99% while the average of inflation is 1.83%. Regarding the stock market capitalization to GDP we find that the minimum value is 9.06% and the maximum value is 57.17%. The mean concerning the presence of foreign banks is 23.54% with a minimum value of 0% and a maximum value of 90%. According to Agoraki et al. (2011) a high presence of foreign banks contributes to more benefits for banks and to less risk-taking (Demirguc-Kunt and Serve, 2009).
The bank governance variables in Panel C of Table 2 show that the average board size (BS) is 16.44 with a minimum of 2 and a maximum of 34 directors. Our results are close to Fernandes et al. (2017) who find that the average number of the board of directors is 16.39 for European banks over the period 2007-2008. Similarly, the results of Belhaj and Mateus (2016) show that during the period 2002-2011 European banks have an average number of board members of 15.87. According to Booth et al. (2002) the number of directors in banks is usually larger than the one in non-financial firms. A large board in banks can be explained by many factors, such as the large size of banks. Also, Table 2 reports that bank directors have on average 5.77 years of bank experience with a minimum of one year and a maximum of 19.45 years. The mean percentage of female directors is 13.36% with a minimum value of 0% and a maximum value of 54.45%. In addition, the mean salary plus bonus
(total compensation) for the directors is €4.45 million.
Table 2: Descriptive statistics (2004-2016) All Countries
Variables Observations
Mean
SD Min Max
Panel A: Dependent Variables
Tobin’sQ (%) 645 1.02 0.15 0.04 1.63
ROAA (%) 809 0.64 1.17 -12.36 6.23
ROAE (%) 807 7.89 13.84 -48.01 51.46
23
Z-SCORE (%) 739 10.11 6.55 -3.05 41.14
NPL (%) 767 6.91 6.59 0.17 44.86
TIER1-CAPITAL (%)
714 11.11 4.61 4.20 69.25
Panel B: The Fraser Index of Economic Freedom Indicators
EC-FR 861 7.49 0.30 6.43 8.30
CR-REG 861 8.97 0.81 6.00 10.00
LB-REG 861 6.43 1.21 3.68 8.46
BS-REG 860 7.14 0.86 4.77 8.57
Panel C: Control Variables
LNTA (in €bil.) 811 7.32 1.98 2.59 11.76
CAPITAL (%) 727 13.92 4.67 4.10 68.36
LOANSTA (%) 807 12.63 16.2 24.02 89.06
GDP (%) 821 0.99 2.97 -9.13 25.55
INF (%) 821 1.83 1.27 -4.47 7.95
MACGDP (%) 790 49.10 29.30 9.06 57.17
FOREIGN (%) 720 21.55 23.54 0 90
BS (No) 861 16.44 5.89 2.00 34.00
EXPER (%) 861 5.77 2.76 1.00 19.45
FEMALE (%) 860 13.36 11.68 0.00 54.54
24
(in €mil.)
Note: This table presents the distribution of each variable by showing mean, standard deviation, minimum (min) and maximum (max) value.
25
Table 3: Correlation Matrix
Variables 1 2 3 4 5 6 7 8 9 10 11 12 13 14 15 16 17 18 19 20 21 22
1 EC-FR 1.00
2 CR-REG 0.21* 1.00
3 LB-REG 0.33* 0.30* 1.00
4 BS-REG 0.32* 0.20* 0.38* 1.00
5 INF -0.14 -0.07 -0.08* -0.13* 1.00
6 GDP 0.12 0.10* 0.11 0.09* 0.29* 1.00
7 LNTA 0.11* 0.16 0.15* 0.12* 0.17 0.16 1.00
8 CAPITAL 0.19 0.17 0.21 0.25 -0.13* 0.10 -0.22* 1.00
9 LOANSTA -0.18 -0.16 -0.14 -0.22 0.11 -0.09* -0.07* 0.12* 1.00
10 MACGDP 0.12 -0.15 0.11 0.26* 0.09 0.30 0.16* -0.22* 0.16 1.00
11 FOREIGN -0.14* 0.09 0.15 -0.08 0.12* 0.09* -0.15* 0.21* -.0.15 -0.14* 1.00
12 BS -0.11* -0.18* -0.30 -0.27* -0.21 -0.06 0.13* -0.22* 0.12 -0.24* 0.06 1.00
13 EXPER -0.17* 0.14 -0.07 0.12 0.07 -0.09* 0.14* -0.26* 0.19* 0.17 0.07 -0.01 1.00
14 FEMALE 0.18* 0.11* 0.29* 0.30* -0.29 0.08* 0.27* 0.17* 0.12 0.18* -0.19* 0.24* 0.07* 1.00
15 COMPENSATION 0.32* -0.12 0.17* 0.15 0.08* 0.12* 0.48* 0.02 0.14 0.30 -0.14 0.057 -0.10* 0.24* 1.00
16 TOBIN’SQ 0.17* 0.08 0.16 0.08 -0.07 0.24* -0.18* 0.10* 0.21* 0.14* -0.07 -0.26* -0.01 0.03 0.07 1.00
17 NPL -0.35* -0.19 -0.12 -0.20* -0.26 -0.19* -0.13* 0.11* 0.14* -0.38* 0.09 -0.09* -0.03 0.08* 0.14* 0.11* 1.00
18 ROAA 0.12* 0.24* 0.15* 0.18* -0.10 0.32* 0.09* 0.14* -0.06 0.15 0.19 -0.08* 0.12* -0.07 0.001 0.33* -0.29* 1.00
19 ROAE 0.17* 0.21* 0.08* 0.09* -0.09 0.23 0.01 0.15 -0.08* 0.26* 0.18 -0.01 0.07* -0.01 0.03 0.13* -0.12* 0.39* 1.00
20 NIM -0.23* 0.18 -0.09* -0.33* 0.12 -0.06 -0.23* -0.05 0.19 -0.24 0.25* -0.02 0.23* -0.04 0.09* 0.19* 0.27* 0.24* 0.07* 1.00
21 Z-SCORE 0.25* 0.15 0.32 0.27* -0.14 0.17* 0.10* 0.38* 0.12 0.34* -0.12* -0.31* 0.068 0.32* 0.21* 0.19* -0.19* 0.25* 0.21* -0.045 1.00
26
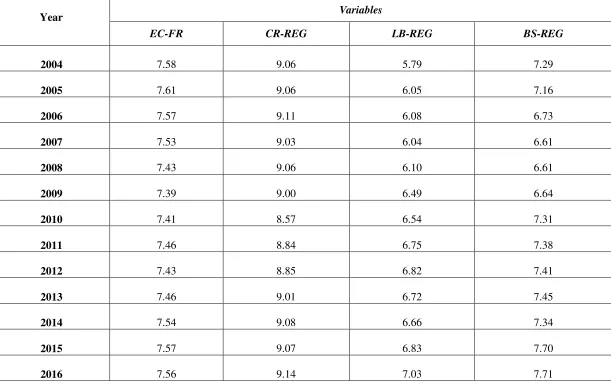
4.2 Descriptive statistics per country and per year
Tables 4a and 4b present the average value of Frazer Index of Economic Freedom Indicators (economic freedom, credit regulations, labor regulations, market regulations) per country and per year respectively. Regarding the analysis of the countries (Table 4a) we notice that the average size of economic freedom varies between 6.96 in Greece and 8.05 in the UK. Greece and Poland have the lowest value of economic freedom with an average of 6.96 and 7.11 respectively, while Ireland and the UK have the highest value of economic freedom with an average of 8.01 and 8.05 correspondingly. This means that developed countries are more liberal than developing ones, as they record higher value on the index of economic freedom.
As far as the credit regulation is concerned, it varies from 7.84 to 9.92. At the country level the best performers in terms of credit regulation (CR-REG) are Spain (9.92) and Denmark (9.84) while the worst is Greece (7.84). Regarding labor regulation (LB-REG) the most liberalized labor markets are the UK (8.25) and Sweden (7.96) while Greece (4.46) and Germany (4.61) are the countries with the most rigid labor regulation. Moreover, business regulation (BS-REG) is significantly more liberal in Sweden (8.19) while Italy (5.87) and the Czech Republic (6.03) represent the countries with the most strict business regulation (BS-REG).
27
Table 4a: Descriptive statistics per country
Countries
Variables
EC-FR CR-REG LB-REG BS-REG
Austria 7.66 9.25 5.99 7.28
Poland 7.11 8.50 5.41 6.03
Czech Republic 7.35 9.53 7.88 5.93
Hungary 7.28 9.61 9.86 6.40
Luxembourg 7.54 9.00 9.63 7.65
Belgium 7.39 9.52 7.10 7.13
Germany 7.62 8.06 4.61 7.38
Netherlands 7.60 9.41 4.72 7.36
France 7.34 9.36 5.65 7.13
Ireland 8.01 8.60 7.70 7.84
UK 8.05 8.64 8.25 7.76
Denmark 7.77 9.84 7.40 8.05
Sweden 7.48 9.27 7.96 8.19
Finland 7.76 9.71 5.36 8.13
Portugal 7.29 7.86 5.39 6.53
Spain 7.45 9.92 5.81 7.67
Greece 6.96 7.84 4.46 6.19
Italy 7.20 8.94 6.46 5.87
28
Table 4b: Descriptive statistics per year
Year Variables
EC-FR CR-REG LB-REG BS-REG
2004 7.58 9.06 5.79 7.29
2005 7.61 9.06 6.05 7.16
2006 7.57 9.11 6.08 6.73
2007 7.53 9.03 6.04 6.61
2008 7.43 9.06 6.10 6.61
2009 7.39 9.00 6.49 6.64
2010 7.41 8.57 6.54 7.31
2011 7.46 8.84 6.75 7.38
2012 7.43 8.85 6.82 7.41
2013 7.46 9.01 6.72 7.45
2014 7.54 9.08 6.66 7.34
2015 7.57 9.07 6.83 7.70
2016 7.56 9.14 7.03 7.71
29
4.3 Empirical results based on the Fixed-Effects method
Tables 5 and 6 report the Fixed-Effects estimation results on equations (1a, 1b) for bank performance and risk-taking as the dependent variables. The effect of economic freedom (EC-FR) on performance is positive and significant at the 1% level only for net interest margin, rendering support to hypothesis H1.a. Our results are consistent with Wah Low et al. (2010) who found that economic freedom increased bank performance in Singapore during the period 1975-2006. A possible explanation is that a competitive banking market can exploit the benefits of broad banking activities (Sufian and Majid, 2011). Moreover, the effect of economic freedom is positive for Z-Score and Tier1-capital but negative and statistically significant for non-performing loans, providing support for hypothesis H1.d. According to Barth et al. (2006) in terms of diversification there are many benefits for banks from range activities.
The estimated coefficient of credit regulation (CR-REG) is positive and significant at the 1% level for return on average assets (ROAA) and return on average equity (ROAE). The positive impact of liberal credit regulation on bank performance is in line with previous studies (Chortareas et al., 2013; Sufian and Habibullah, 2010) who show that permitting banks to engage in a range of activities leads to economic growth. Thus, we accept hypothesis H2.1.a. However, the results regarding the effect of credit regulation on bank risk-taking are not significant (Table 6) and hence, we reject both hypotheses H2.1.C and H.2.1.d.
Furthermore, the results regarding the coefficient of labor regulation (LB-REG) on bank performance is positive for the net interest margin at the 1% level (Table 5), rendering support for hypothesis H2.2.a. As mentioned by Psillaki and Mamatzakis (2017) liberal reforms in the labor market may increase bank efficiency as they reduce employee complacency and associated absenteeism (Riphahn, 2004). Regarding the risk-taking of banks, it is observed from Table 6 that labor regulation increases the proportion of Tier1-capital ratio. This means that relaxing regulation contributes to financial stability (Barth et al., 2013). Hence, we accept hypothesis H2.2.d.
30
(Table 6). Thus, liberal business regulations are beneficial for banks as they make it easy for banks to assess the creditworthiness of a company which in turn leads to lower levels of non-performing loans (Loayza et al., 2005). Consequently, we accept hypothesis H2.3.d.
As far as concerns control variables are concerned, bank size (LNTA) appears to be negatively and
statistically significant at the 1% for Tobin’sQ and return on average assets (ROAA). A possible
explanation is that the increase of portfolio diversification leads to lower risks and therefore lower return for banks. Our findings support previous researches conducted by Staikouras et al. (2007), Belhaj and Mateus (2016), among others. Moreover, the impact of bank size on risk-taking is positive and significant at the 1% level for Z-Score.
The effect of capital ratio (CAPITAL) is positive and statistically significant in all performance
measures except for Tobin’sQ and return on average assets (ROAA). This positive relationship
indicates that banks with high capitalization perform better (Pathan and Faff, 2013, Das and Ghosh, 2006; Psillaki and Mamatzakis, 2017). As a result, banks with better high capitalization are more stable. However, the results regarding the coefficient of capital ratio on risk-taking are mixed; positive and significant at the 1% level for Tier1-cpaital but negative at different levels for Z-Score and on-performing loans. Banksthat are active in lending business have more risky investments. As mentioned by Berger et al. (2012) risky banks also hold on average more off-balance-sheet items. This indicates that these items are not used to offset risks on the balance sheet, but rather as an additional instrument to engage in risky investments.
The GDP growth appears to be positively and statistically significant at different levels regardless of how performance is measured. One possible explanation is that higher levels of GDP growth are associated with less credit risk and more bank performance (Agoraki et al., 2011). In addition, there is no statistically significant relationship to any bank risk indicator and GDP growth. Moreover, the impact of inflation (INF) on bank performance is negative and significant at different levels for all measures except from return on average equity (ROAE). A possible explanation is that a high level of inflation is associated with more costs and therefore, decreases bank performance (Kasman and Yildirim, 2006; Pasiouras et al., 2009). Also, the coefficient of inflation on bank risk-taking is positive and significant at the 1% level for non-performing loans, and thus, contributes to credit risk (Table 6).
31
Moreover, the impact of stock market capitalization to GDP on bank risk-taking is negative at the 1% level for both Z-Score and Tier1-capital ratio but positive at the 1% level for non-performing loans. A possible explanation is that in a well-developed country, businesses have the opportunity to rely on equity rather than on bank finance (Pasiouras et al., 2009).
Moreover, the presence of foreign banks (FOREIGN) appears to be positively and statistically significant at the 10% level for net interest margin. A possible explanation is that when banks operate within a highly concentrated market, they have the ability to charge high loan rates. Our findings support previous research conducted by Ataullah and Le (2006) among others. However, the impact of the presence of foreign banks on risk-taking is not significant.
Also, we consider the ratio of loans to total assets as a proxy for asset utilization (LOANSTA). Our results are mixed; we show a negative relationship between loans to total assets and bank
performance for Tobin’sQ and net interest margin but a positive and significant at the 1%
significance level for return on average assets (ROAA) and return on average equity (ROAE); the negative association between asset utilization and bank efficiency may reflect greater pressure in containing costs of credit origination and monitoring for larger loan portfolios. Moreover, our findings indicate that the effect of asset utilization on risk-taking is negative for Z-Score and Tier1-capital ratio at the 1% level.
The effect of board size (BS) on performance is positive and significant at the 1% and 5% level for return on average assets (ROAA) and return on average equity (ROAE) respectively. A large number of directors on boards may contribute positively to the decision-making process and, hence, improve the performance of banks. Regarding the risk-taking, we show that the effect of board size is negative and significant at the 10% level for non-performing loans but positive and significant at the 5% level for Tier1-capital ratio (Table 6). Thus, when we consider macroeconomic variables, the findings regarding the relationship between board size and risk-taking change on the Fixed-Effects model. One possible explanation is that high levels of economic freedom in conjunction with less labor regulation could lead to better decisions and less risk-taking through higher labor force participation. This means that in such environments the different skills and experiences of board members may constitute a large board more efficient.
In Table 5 we find that the estimated coefficient of the financial experience (EXPER) of directors is
32
and its regulatory environment. Regarding the risk-taking of banks, it is observed from Table 6 that the experience of directors reduces the percentage of non-performing loans (NPL) and increases Z-Score. Thus, the impact of macroeconomic variables does not change the effect of financial experience on both bank performance and risk-taking.
Gender diversity increases bank performance when measured by net interest margin (Table 5). This result indicates that female directors (FEMALE) are more effective than men in monitoring. Moreover, the results (Table 6) regarding the effect of female directors on risk-taking indicate that the presence of women on boards reduces bank risk when measured by Z-Score ratio. Consequently, the implementation of macroeconomic variables does not alter the effect of gender diversity on bank risk-taking.
In addition, from Table 5 we observe that the compensation of directors (COMPENSATION) has a positive and significant impact on all performance measures. Also, the impact of compensation, which is measured by cash and bonus, on bank risk-taking is positive and significant at the 10% level only for the Tier1-capital ratio. Therefore, the macroeconomic conditions do not change the impact of compensation on both bank performance and risk-taking. Thus, an increase in cash bonuses lowers bank risk.
Table 5: Empirical results for bank performance based on Fixed-Effects
Variables Tobin’sQ ROAA ROAE NIM
EC-FR 0.0258 -0.372 0.046 0.0332**
(0.276) (0.330) (0.142) (0.05) CR-REG -0.0014 0.0354*** 0.0604*** 0.0073
(0.223) (0.000) (0.000) (0.514) LB-REG 0.0044 -0.055 0.0132 0.0114***
(0.295) (0.462) (0.395) (0.001) BS-REG 0.011*** 0.245*** 0.085*** 0.0151***
(0.000) (0.000) (0.000) (0.000) LNTA -0.0856*** -0.064*** -0.345 0.0453 (0.000) (0.001) (0.293) (0.200) CAPITAL 0.00267 0.016 0.071** 0.0353***
33
(0.000) (0.000) (0.000) (0.000)
GDP 0.015* 0.0531*** 0.119*** 0.0612
(0.10) (0.001) (0.000) (0.211)
INF -0.0041*** -0.055* -0.155 -0.0377**
(0.001) (0.10) (0.192) (0.04) MACGDP -0.077*** -0.0126*** -0.213*** -0.0119
(0.000) (0.001) (0.000) (0.221) FOREIGN 0.00589 -0.00438 -0.232 0.0821*
(0.209) (0.313) (0.271) (0.06) BS 0.0025 0.0144*** 0.0528** 0.0126
(0.539) (0.001) (0.05) (0.165) EXPER -0.015 0.0521** 0.0985** 0.0325***
(0.238) (0.05) (0.05) (0.000) FEMALE 0.0017 0.0013 0.0596 0.0564*
(0.287) (0.199) (0.185) (0.10) COMPENSATION 0.00289 0.00625* 0.0076* 0.00269
(0.166) (0.09) (0.10) (0.231) Constant 1.632*** 2.45*** 3.78*** 2.214***
(0.000) (0.000) (0.000) (0.000)
Observations 758 784 649 657
Adjusted R2 0.217 0.224 0.267 0.231
N. of Banks 73 73 73 73
[image:34.595.36.560.616.763.2]Note: This table reports regression results obtained via the Fixed-Effects method. The dependent variable is bank performance (PERFOR) which measured by Tobin’sQ, ROAA, ROAE and NIM. Definitions of all variables are provided in Table 1 Superscripts *, **, *** indicate statistical significance at 10%, 5% and 1% levels, respectively. P-values are reported in parentheses.
Table 6: Empirical results for bank risk based on Fixed Effects
Variables Z-Score NPL Tier1-Capital
EC-FR 0.0865* -0.0425*** 0.0497***
(0.10) (0.001) (0.003)
CR-REG 0.0127 0.0240 0.0159
(0.178) (0.179) (0.189)