J. Range Manage.
55:576-583 November 2002
Predicting plant community response to picloram
SUSAN A. KEDZIE-WEBB, ROGER L. SHELEY, AND JOHN J. BORKOWSKI
Authors are Graduate Research Assistant and Associate Professor, Department of Land Resources Environmental Sciences, and Associate Professor, Department of Mathematical Sciences, Montana State University, Bozeman, Mont. 59717.
Abstract
Effective rangeland weed programs require the ability to pre- dict plant community responses to management. Our objective was to develop regression equations to predict the plant commu- nity after control with picloram using the pre-treatment plant community. Five transects were established from dense spotted knapweed (Centaurea maculosa Lam.) in the center of each patch to an area of low or no spotted knapweed occurrence on the out- side of the patch. Transects ended in areas dominated by Idaho fescue (Festuca idahoensis Elmer). Twenty permanent plots (20 x 50 cm, spacing along the transect ranged from 1/2 to 2 m) were placed along this gradient. Pre-treatment density and cover of all species were sampled in each plot. Biomass of all species was har- vested in plots adjacent to the transect. Picloram (4-amino-3,5,6- trichloropicolinic acid) was applied along each transect at a rate of 0.28 kg a.i. ha'1 in October 1996 to each plot. Density, cover, and biomass of all species were re-sampled in August 1998.
Regression models were fit using perennial grasses, Idaho fescue, forbs, species richness, and species diversity after treatment as predicted variables. All predicted variables were indigenous species. Regressor variables used were site, transect, and spotted knapweed, a spotted knapweed quadratic component, indigenous perennial grasses, Idaho fescue, indigenous forbs, species rich- ness, and species diversity sampled in the first year (1996) prior to treatment. The best predictive models for assessing post-man- agement indigenous perennial grass, Idaho fescue, and species richness were based on density. The best models predicting post- management forbs and species diversity were based on cover and biomass, respectively. In 4 out of the 5 models, for a given post- management parameter, an important predictor in the model was its pre-management regressor variable. Additionally, pre- management spotted knapweed was a relatively unimportant predictor in most models. The model predicting species diversity based on density (pre-treatment) predicted an increase in species diversity 2 years after management. This study indicated that it may be feasible to use pre-management plant community data to predict post-management plant community response for spotted knapweed-infested rangeland using picloram.
Key Words: Spotted knapweed, predicting plant response, inte- grated weed management, optimizing herbicide use
Over the past century, loss of indigenous rangeland communi- ties in North America has been related to the invasion of aggres- sive non-indigenous species (Kedzie-Webb 1999). Ecological impacts attributed to non-indigenous invasions include the dis-
Resumen
Los programas efectivos de control de malezas en los pastizales requieren de la habilidad para predecir las respuestas de la comunidad vegetal al manejo. Nuestro objetivo fue desarrollar ecuaciones de regresion para predecir la comunidad vegetal despues del control con picloram usandolo como pre-tratamiento de la comunidad vegetal. Se establecieron 5 transectos desde el
centro de cada parche, en donde "Spotted knapweed"
(Centaurea maculosa Lam.) tenia una alta densidad, hasta un area fuera del parche, donde la densidad de "Spotted knapweed"
era baja o no estaba presente. Los transecto terminaron en areas dominadas por "Idaho fescue" (Festuca idahoensis Elmer). Se colocaron 25 parcelas permanentes de (20 x 50 cm, el espaci- amiento entre parcelas a to largo fue de 2 m) a to largo de este gradiente. La densidad y cobertura de todas las especies se muestreo en cada parcela antes de aplicar los tratamientos. Se cosecho la biomasa de todas las especies en parcelas adyacentes al transecto. En Octubre de 1996, el Picloram (4-amino-3,5,6- acido tricloropicolinico) se aplico en cada parcela a to largo del transecto a una dosis de 0.28 kg i.a. ha'1. La densidad, cobertura y biomasa de todas las especies se muestrearon nuevamente en Agosto de 1998. Los modelos de regresion se ajustaron utilizando como variables predichas los zacates perennes, el " Idaho fes- cue", las hierbas, la riqueza de especies y la diversidad de especies despues del tratamiento. Todas la variables predichas fueron especies nativas. Las variables regresoras utilizadas fueron: sitio, transecto y Spotted knapweed", un componente cuadratico de "Spotted knapweed, zacates perennes nativos,
"Idaho fescue", hierbas nativas, riqueza de especies y la diversi- dad de especies muestreada en el primer ano (1996) antes del tratamiento. Los mejores modelos predictivos para evaluar el manejo post-tratamiento de zacates perennes nativos, " Idaho fescue" y la riqueza de especies fueron basados en la densidad.
Los mejores modelos para predecir el manejo post-tratamiento de las hierbas y la diversidad de especies se basaron en cobertura y biomasa respectivamente. En 4 de los 5 modelos, para un parametro post-tratamiento dado, un predictor importante en el
modelo fue su variable regresora de pre- tratamiento.
Adicionalmente, el manejo pre-tratamiento del " Spotted knap- weed" fue un predictor relativamente sin importancia en la may- oria de los modelos. El modelo para predecir la diversidad de especies basado en la densidad (pre-tratamiento) predijo un incremento en la diversidad de especies 2 anos despues del tratamiento. Este estudio indica que puede ser factible el use de los datos de la comunidad vegetal pre-tratamiento para predecir la respuesta de la comunidad vegetal despues del tratamiento en pastizales infestados de " Spotted knapweed" tratados con Picloram.
Manuscript accepted 26 Jan. 02.
576 JOURNAL OF RANGE MANAGEMENT 55(6) November 2002
placement of indigenous plant species, declines in biodiversity, and degradation of ecosystem function (Vitousek 1986, Randall 1996). In the western United States, saltcellar (Tamarix spp.) (Brotherson and Field 1987), leafy spurge (Euphorbia esula L.) (Belcher and Wilson 1989), downy brome (Bromus tectorum L.) (Mack 1981,
Whisenant 1990), spotted knapweed (Centaurea maculosa Lam.), and others have been documented to alter ecosystem function (Tyser and Key 1988). Ecosystem processes threatened by invasive species include primary and secondary productivi- ty, decomposition, nutrient cycles (accu- mulation or loss), soil development and fertility, and hydrologic cycles (Vitousek and Hooper 1993). In a single, cursory study, Lacey et al. (1989) suggested that surface run-off and sediment yield
increased on spotted knapweed-dominated sites under simulated rain events. Spotted knapweed negatively impacts wildlife through forage production loss, habitat modification, or by altering animal-plant interactions (Thompson 1996). Invasion by spotted knapweed into western Montana has reduced winter forage for elk resulting in an estimated loss of 220 elk annually (Spoon et al. 1983). A major eco- nomic impact of spotted knapweed inva- sion is the loss of livestock forage produc- tion (Bucher 1984).
Rangeland managers are searching for useful models on which to base their deci- sions (Archer 1989, Laycock 1991, Schlatterer 1989). The more accurate the predictions, the greater success in devel- oping integrated weed management sys- tems (Schreiber 1982). Coupled with the concept of thresholds, predicting plant community response to regulation may enhance management by providing man- agers with the information necessary to make thoughtful decisions (Griffith and Lacey 1991).
The overall objective of this study was to determine the potential to predict the post-treatment plant community after a herbicide treatment of spotted knapweed based on the pre-treatment plant commu- nity. Specific objectives were to: 1) devel- op models that predict the post-picloram- treatment plant community composition based on the pre-treatment plant commu- nity after a picloram treatment; 2) initiate development of a method to use easily col- lected field data to predict pre- and post- management biomass; and 3) introduce a
method to use predictions to enhance weed management decisions. Since cover data is one of the easiest parameters to collect, using cover to predict biomass
may be the most practical and efficient model for decision-making. Although this study was conducted using an herbicide, this method could be used in a similar fash- ion to predict post-treatment plant commu- nity response based on the pre-treatment plant community and application of other management techniques (e.g., grazing, fire, biocontrol, etc.). This research is necessary to improve decision-making abilities and management strategies.
Materials and Methods
This study was conducted on 2 sites from 1996 through 1998 within a Idaho fescue-bluebunch wheatgrass (Festuca idahoensis-Agropyron spicatum) habitat type (Mueggler and Stewart 1980). Site 1 was located in Story Hills (45° 42 N, 111 °
01' W), four km northeast of Bozeman, Mont. Elevation at this site is 1,478 m.
Average annual precipitation is 432 mm.
Soil is a clayey-skeletal, mixed Typic Argiborolls. Site 2 was located at Beartrap Canyon, about 45 km east of Norris, Mont. (45° 36' N, 111° 34 W). Elevation is 788 m with an average annual precipita- tion of 305 mm. Soil at Site 2 is classified as a loamy-skeletal, mixed Aridic
Argiborolls.
Five transects, each 20 m long, were established at both sites. Transects radiat- ed from dense spotted knapweed in the center of each patch to an area of low or no spotted knapweed occurrence on the outside of the patch. At each site, all tran- sects radiated from the center of the same patch. The plant community at each tran- sect origin was dominated by spotted knapweed with few or no residual indige- nous species growing in association.
Transects ended in areas dominated by Idaho fescue (Festuca idahoensis Elmer) with a diverse group of associated species.
Twenty permanent plots (20 x 50 cm, spacing along the transect ranged from 2 to 2 m) were placed along this gradient of
spotted knapweed cover from 0 to 100%
(about every 5%). Pre-treatment density (juveniles plus adults) and cover of all species were sampled in each plot.
Picloram (4-amino-3,5,6-trichloropicolinic acid) was applied along each transect in a 2 m swath at a rate of 0.28 kg a.i. ha' in October of 1996 to each plot. Density (juveniles plus adults) and cover of all species were re-sampled in August 1998.
Thirty temporary plots (20 x 50 cm) were also established along the spotted knapweed gradient to sample biomass and soil at each site. Biomass was sampled for
all species by clipping plants to ground- level at peak standing crop in August 1996 and 1998. Samples were dried at 60° C to a constant weight and weighed. Soil sam- ples were collected along the transect to determine whether the spotted knapweed gradient was related to differences in soil nutrients. Soil samples were tested for available nitrogen, phosphorous, and potassium using a standardized extraction process (Page and Klute 1982). There were no differences in available soil nutri- ents, therefore, the data are not presented.
Data Analysis
Data were compiled into tables showing the number of transects in which individ- ual species were present both before and after the picloram treatment (maximum of 5). Plant density, cover, and biomass data were analyzed using a multi-step process.
Covariance analysis was conducted to test for sample independence within transects.
Analysis indicated independence among all plots, therefore, a step-down linear regression procedure was used to identify the best model (Neter et al. 1985). A com- bination of P-value, model simplicity, and R2 values was used to identify the best model for each step-down procedure.
Scatter-plots of the residuals versus the standardized predicted values were used to evaluate heterogeneity of variance for each model. Data transformations were conducted where necessary on predicted and/or regressor variables using square- root transformations. Inverse, quadratic, and log transformations were tested, but did not improve the models. Collinearity was evaluated using a SAS tolerance pro- cedure to test for relatedness of predictors (SAS 1990). Collinearity was not a prob- lem in this analysis.
Regression models were fit using densi- ty, cover, and biomass after treatment (1998) as predicted variables that include perennial grasses, Idaho fescue, forbs, species richness, and species diversity. All
predicted variables were indigenous species. Regressor variables used were site, transect, and density, cover, and bio- mass of spotted knapweed, a spotted knap- weed quadratic component, indigenous perennial grasses, Idaho fescue, indige- nous forbs, species richness, and species diversity sampled in the first year (1996) prior to treatment.
Regression models were also fit using
density, cover, and biomass of brome
species post-treatment as predicted vari-
ables. In these models, regressor variables
were density, cover, and biomass of pre-
treatment brome species, a brome quadrat-
is component, spotted knapweed, and a spotted knapweed quadratic component.
Additionally, regression models were fit to predict production from cover. The pre- dicted variables include: post-treatment indigenous perennial grass, Idaho fescue, forbs, and brome species biomass.
Regressor variables used were pre-treat- ment indigenous perennial grass, Idaho fes- cue, indigenous forbs, brome species cover, and their respective quadratic components.
All models presented were significant at P < 0.05. The effects of transects were averaged across sites when significant.
Coefficient means and standard deviations for transects are presented. These regres- sion models do not imply causality.
Diversity measurements were estimated using Shannon-Weaver's diversity index (Shannon and Weaver 1949).
Results Presence and Distribution
Nine indigenous grasses, 2 non-indige- nous grasses, 9 indigenous forbs, and 3 non-indigenous forbs were present at Site
1. Of the indigenous grasses, bluebunch wheatgrass [Agropyron spicatum (Pursh)
Scribn. & Smith] was found in 3 or more
transects, and western wheatgrass (Agropyron smithii Rydb.) was present in at least 1 transect along the gradient. Idaho fescue was present in all transects except at 85 and 90% pre-treatment spotted knap- weed. All other indigenous grasses were limited in presence after 50% pre-treat- ment spotted knapweed. Japanese brome (Bromus japonicus Thunb.) was present along the entire transect. Kentucky blue- grass (Poa pratensis L.) was limited in presence below 30% pre-treatment spotted knapweed. The most abundant indigenous forbs included hairy goldenaster
[Chrysopsis villosa (Pursh) Nutt.], blazing- star (Liatris punctata Hook.) and sagewort cudweed (Artemisia ludoviciana). Post- treatment bastard toadflax [Comandra umbellata (L). Nutt.] was the most abun- dant non-indigenous forb present at Site 1.
Seven indigenous grasses, 3 non-indige- nous grasses, 5 indigenous forbs and 2 non- indigenous forbs were present at Site 2.
Blue grama [Bouteloua gracilis (H. B. K.) Lag.] was present along the entire gradient.
Idaho fescue was found at all pre-treatment spotted knapweed levels except 70 and 100%. Prairie sandreed (Calamovilfa longi-
folio Hook.) and needle-and-thread grass (Stipa comata Trin. & Rupr.) were well represented along the transect except above 60% spotted knapweed. The most abundant forb based on presence in number of Iran- sects was the non-indigenous Berteroa spp.
Density
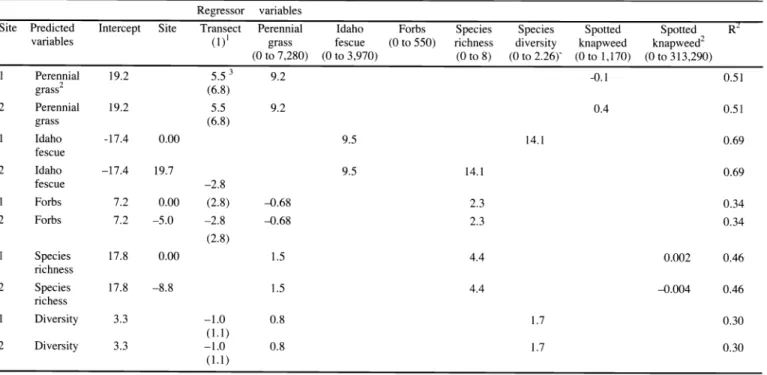
Regression models were generated to predict the plant density 2 years after picloram treatment (predicted variables) based on the density of plants sampled prior to treatment (regressor variables) (Table 1). Site was significant when pre- dicting Idaho fescue and forb density, as well as species richness based on density.
Estimated effects of site were -8.8, -5.0, and 19.7 for species richness, forbs, and Idaho fescue density, respectively.
For each 1 unit increase in pre-treatment indigenous perennial grass density, predict- ed post-treatment indigenous perennial grass density increased by about 9.2 tillers m 2 (Table 1). For each 1 unit increase in
spotted knapweed density, predicted indigenous perennial grass density decreased by 0.1 tillers m 2 at Site 1. At Site 2, for each 1 unit increase in spotted knap- weed density, predicted indigenous perenni-
Table 1. Regression models predicting post-treatment indigenous species based on pre-treatment density (plants m 2) of regressor variables. Empty cells represent non-significant regressor variables.
Regressor variables
Site Predicted Intercept Forbs R
variables (1)' grass (0 to 550)
(0 to 7,280) (0 to 3,970) (0 to 8) to 2.26)' to 1,170) to 313,290)
1
Perennial 19.2 3
grass2 (6.8)
2 Perennial 19.2
grass (6.8)
1 Idaho -17.4
2
fescue Idaho
fescue -2.8
1
Forbs 7.2
2 Forbs 7.2
(2.8)
1
Species 17.8
2
richness Species
1
richess Diversity
(1.1)
2 Diversity 3.3
(1.1)
1Possible range of values for each parameter on a m2 basis.
A model predicting post-treatment IPG density based on pre-treatment density of PIG and CEMA treatment includes
Site 1; y =19.2(B0)+ 5.5 (B1)+9.2(B2)-0.10(B3), where BO is the intercept, BI is the average of transect, B2 is the density of the indigenous perennial grass prior to treatment.and B3 is the density of CEMA at Site 1.
Site 2; y =19.2(B0)+ 5.5 (B1)+9.2(B2)+(0.40(B3), where B0 is the intercept, B1 is the average of transect, B2 is the density of the IPG prior to treatment.and B3 is the density of CEMA at Site 2.
3Means represent the average of 10 transects across site with standard deviations are provided below means in table.
578 JOURNAL OF RANGE MANAGEMENT 55(6) November 2002
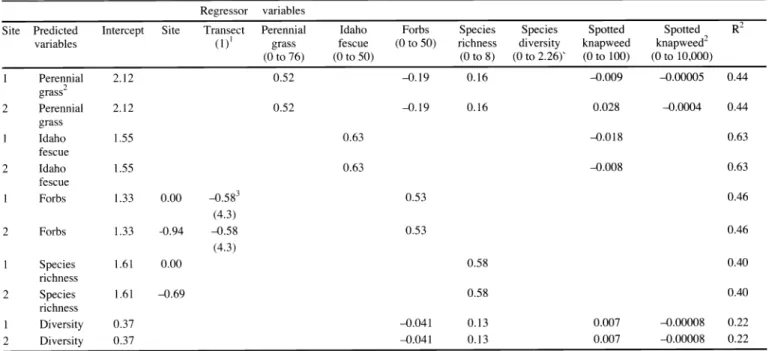
Table 2. Regression models predicting post-treatment indigenous species based on pre-treatment cover of regressor variables. Empty cells represent non-significant regressor variables.
Regressor variables
Site Predicted Intercept Species
variables (1)
1grass to 50) diversity
(0 to 76) (0 to 50) (0 to 8) (0 to 2.26)' to 100) to 10,000)
1
Perennial 2.12
2
grass 2
Perennial 0.52 -0.19 0.16 0.028 -0.0004
1
2
1
fescue
0.00
2 -0.94
1
richness
1
richness
Diversity 0.37 -0.041 0.13 0.007 -0.00008 0.22
2 Diversity 0.37 -0.041 0.13 0.007 -0.00008 0.22
Possible range of values for each parameter on a m 2 basis.
A model predicting IPG cover (after treatment) based on cover of IPG, Forbs, Species Richness, CEMA, and CEMA 2 prior to treatment includes:
Site l; y = 21.7(B0)+ 5.2 (BI)-0.19(B2)+0.16(B3), -0.009(B4)-0.00005(B5),z here Bp is the intercept, B1 is the cover of IPG prior to treatment, B2 is the cover of forbs, B3 is the species richness, B4 the cover of CEMA, and B5 is the cover of CEMA at Site 1;
Site 2; y = 2.17(B0)+ 0.52 (B1 )-0.19(B2)+0.16(B3)+0.028(B4)-0.0004(B5), where Bp is the intercept, B
1is the cover of IPG prior to treatment, B2 is the cover of forbs, B3 is the species richness, B4 the cover of CEMA, and B5 is the cover of CEMA at Site 2.
of CEMA at Site 2.
3Means represent the average of 10 transects across site with standard deviations are provided below means in table.
al grass density increased by 0.4 tillers m 2.
Effect of transect was positively associated with indigenous perennial grass density.
In the model predicting Idaho fescue density, post-treatment Idaho fescue densi- ty was positively associated with pre-treat- ment Idaho fescue density and species diversity (Table 1). Specifically, each 1 unit increase in pre-treatment Idaho fescue density was associated with a 9.5 tillers m 2 increase in post-treatment Idaho fescue density. For each 1 unit increase in species diversity, Idaho fescue density increased by 14.1 tillers m 2.
In general, predicted post-treatment indigenous forb density was negatively related to pre-treatment indigenous peren- nial grass density and positively related to species richness (Table 1). For each 1 unit increase in indigenous perennial grass density, forb density decreased by 0.68 plants m 2. Each 1 unit increase in species richness was associated with a predicted 2.3 plants m_2 increase in forb density.
Effect of transect was negatively associat- ed with forb density.
For each 1 unit increase in indigenous perennial grass density, predicted species richness increased by about 1.5 plants m 2
at both sites (Table 1). For each 1 unit
increase in pre-treatment species richness, predicted post-treatment species richness increased by 4.4 plants m 2 at both sites.
The spotted knapweed quadratic compo- nent was associated with an increase in species richness by about 0.002 plants m 2
at Site 1 and a decrease of 0.004 plants m 2
at Site 2.
Predicted post-treatment species diversi- ty was positively related to both pre-treat- ment indigenous perennial grass density and species diversity (Table 1). Each 1 unit increase in indigenous perennial grass density was associated with an increase in
species diversity by 0.8 Shannon- Weaver's diversity index units. For each 1 unit increase in pre-treatment species rich- ness, post-treatment species diversity increased by 1.7 Shannon-Weaver's diver- sity index units. Effect of transect was negatively associated with species diversi- ty at both sites.
Cover
Site was significant when predicting forb cover and species richness based on cover. The estimated effects of site were -0.94 and -0.69 for forbs and species rich- ness, respectively (Table 2).
Predicted post-treatment indigenous
perennial grass cover was positively relat- ed to indigenous perennial grass and species richness, but negatively related to forb cover at both sites (Table 2). Each 1%
increase in pre-treatment indigenous
perennial grass cover was associated with a 52% increase in post-treatment indige- nous perennial grass cover. For each 1 % increase in forb cover, indigenous perenni- al grass cover decreased by 19%. Each 1%
increase in species richness based on cover was associated with a predicted increase in indigenous perennial grass cover by 16%. For each 1% increase in
spotted knapweed cover, indigenous
perennial grass cover decreased by 0.9 % at Site 1 and increased by 2.8% at Site 2.
Each 1 % increase in the spotted knapweed quadratic component was associated with a decrease in indigenous perennial grass cover by 0.005 and 0.04% for Sites 1 and 2, respectively.
In general, predicted post-treatment
Idaho fescue cover was positively related
to pre-treatment Idaho fescue cover (Table
2). Each 1% increase in pre-treatment
Idaho fescue cover was associated with an
increase in post-treatment Idaho fescue
cover by 63%. Each 1% increase in spot-
ted knapweed cover was associated with a
predicted decrease in Idaho fescue cover
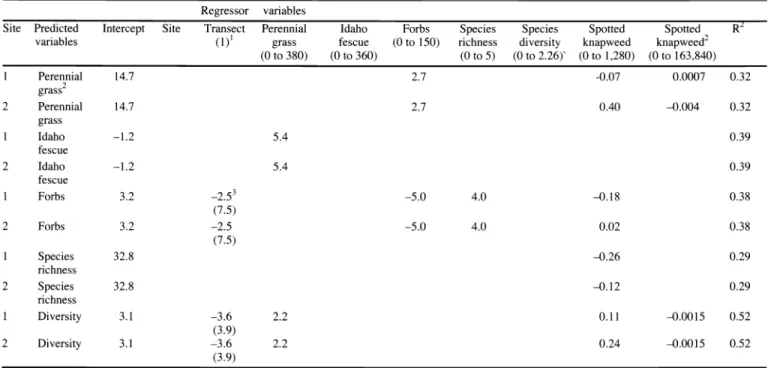
Table 3. Regression models predicting post-treatment indigenous species based on pre-treatment biomass (plants m 2) of regressor variables. Empty cells represent non-significant regressor variables.
Regressor variables
Site Predicted Intercept Site Idaho Species R
variables (1)i grass fescue to 150) diversity
(0 to 380) (0 to 360) (0 to 5) (0 to 2.26)' (0 to 1,280) to 163,840)
1
Perennial 14.7
2
2
Perennial
1
grass Idaho
2
fescue Idaho
1
fescue Forbs
(7.5)
2 Forbs 3.2
(7.5)
1
Species 32.8
2
richness Species
1
richness Diversity
(3.9)
2 Diversity 3.1
(3.9) ZPossible range of values for each parameter on a m2 basis.
A model predicting post-treatment IPG biomass based on biomass of Forbs, CEMA, and CEMA prior to treatment includes 2
Site 1; y =14.7(B0)+ 2.7 (B1)-0.07(B2)+0.0007(B3), where Bp is the intercept, BI is the biomass of forbs prior to treatment, B2 is the biomass of CEMA, B3 is the biomass of CEMA at Site 1;
Site 2; y =14.7(Bp)+ 2.7 (B 1)+0.38(B2)-00004(B3), where Bp is the intercept, B t is the biomass of forbs prior to treatment, B2 is the biomass of CEMA B3 is the biomass of CEMA2 at Site 2.
3Means represent the average of 10 transects across site with standard deviations are provided below means in table.
by about 1.8 and 0.8% at Sites 1 and 2, respectively.
Predicted post-treatment indigenous forb cover was positively related to pre- treatment indigenous forb cover (Table 2).
For each 1 % increase in forb cover prior to treatment, forb cover after treatment increased by 53% at both sites. At Site 2, the effect of transect was negatively asso- ciated with forb cover.
In the model predicting species richness, post-treatment species richness was posi- tively associated with pre-treatment species richness (Table 2). Specifically, for each 1% increase in species richness, species richness increased by about 58%
two years after treatment.
Predicted species diversity was negative- ly associated with forb cover and the spot- ted knapweed quadratic component, but positively related to species richness and spotted knapweed cover alone (Table 2).
Specifically, each 1% increase in pre-treat- ment forb cover was associated with a decrease in species diversity by 0.041 Shannon-Weaver's diversity index units.
For 1 % unit increase in species richness, species diversity increased by 0.13 Shannon-Weaver's diversity index units.
For each 1% increase in adult spotted
knapweed cover, diversity increased by 0.007 Shannon-Weaver's diversity index units. For each 1 % increase in the spotted knapweed quadratic component, diversity decreased by 0.00008 diversity index units.
Biomass
Indigenous perennial grass biomass prior to treatment was positively related to post-treatment forb cover and both posi- tively and negatively related to spotted knapweed (Table 3). For each 1 unit increase in forb biomass, indigenous perennial grass biomass increased by 2.7 g
m 2. Each 1 unit increase in spotted knap- weed biomass was associated with a pre- dicted 0.07 g m 2 decrease in indigenous perennial grass biomass at Site 1. At Site 2, for each 1 unit increase in spotted knap- weed biomass, indigenous perennial grass biomass increased by 0.40 g m 2. Each 1
unit increase in the spotted knapweed bio- mass by spotted knapweed interaction was associated with a predicted 0.0007 g m 2 increase in indigenous perennial grass bio- mass at Site 1 and a 0.004 g m 2 decrease at Site 2.
Predicted Idaho fescue biomass was positively related to indigenous perennial grass biomass from year one (Table 3).
For each 1 unit increase in indigenous perennial grass biomass, Idaho fescue bio- mass increased by 5.4 g m 2.
Each 1 unit increase in pre-treatment forb biomass was associated with a pre- dicted 5.0 g m 2 decrease in post-treatment forb biomass (Table 3). Each 1 unit increase in species richness based on bio- mass was associated with an increase in forb biomass by 4.0 g m 2 at both sites.
Forb biomass was negatively related to spotted knapweed biomass (-0.18 g m 2) at Site 1 and positively related to spotted knapweed biomass (0.02 g m 2) at Site 2.
Effect of transect was negatively associat- ed with forb biomass.
Predicted species richness based on bio- mass was negatively related to spotted knapweed biomass (Table 3). Specifically, each 1 unit increase in spotted knapweed biomass was associated with a decrease in species richness by 0.26 g m 2 and 0.12 g
m 2 at Sites 1 and 2, respectively.
Post-treatment species diversity was pos- itively associated with perennial grass bio- mass and the spotted knapweed biomass alone, but negatively related to the spotted knapweed quadratic component (Table 3).
Each 1 unit increase in indigenous perenni- al grass biomass was associated with an
580 JOURNAL OF RANGE MANAGEMENT 55(6) November 2002
Table 4. Regression models predicting 'post-treatment non-indigenous species based on density (plants m ) cover, and biomass (g m ) variables. Empty cells represent non-significant regres- sor variables.
Regressor variables
Site Predicted Intercept R 2
variables (0 to 1,9502 (0 to 38,025)
(Brome spp.) (0 to 12) (0 to 144) to 1,170) to 313,290) (0 to 78) (0 to 608) (1 to 100) to 10,000) (0 to 1,280) (0 to 163,840)
1 Density3 -633
2 Density -220
1
Cover -0.40
2 Cover -0.11
1 Biomass 43.0
2 Biomass 181 x 10 5
Represents a pre-treatment parameter based on density, cover, and biomass to predict post-treatment Brome density, cover, and biomass, respectively.
Possible range of values for each parameter based on density, cover, and biomass on a m basis, respectively. 2 3A a model predicting pre-treatment brome density based on density of Brome, Brome
,and CEMA, prior to treatment includes:
Site l; y = 633 (B0)+10.6(B1)-0.006(B2)+3.9(B3) where Bp is the intercept B1 is the biomass of pre-treatment Brome, B2 is the biomass of pre-treatment Brome
,and B3 is the biomass of CEMA at Site l;
Site 2; y = -220(Bp)+1.1(B1)+1.4(B2), where Bp is the intercept B1 is the biomass of pre-treatment Brome, and B2 is the biomass of CEMA at Site 2.
increase in species diversity by 2.2 Shannon-Weaver's diversity index units.
For each 1 unit increase in spotted knap- weed biomass, species diversity increased by 0.11 and 0.24 Shannon-Weaver's diver- sity index units at Sites 1 and 2, respective- ly. The spotted knapweed quadratic com- ponent was related to a decrease of 0.0015 Shannon-Weaver's diversity index units.
Indigenous species diversity was negative- ly related to transect.
Brome species
Density. Regression models were gener- ated to describe density of post-treatment brome species based on pre-treatment brome species (Table 4). For each 1 unit increase in pre-treatment brome density, post-treatment brome increased by 10.6 tillers m 2 at Site 1. At Site 2, each 1 unit increase in pre-treatment brome was asso- ciated with a 1.1 tillers m 2 increase in post-treatment brome. For each 1 unit increase in the brome quadratic compo- nent, post-treatment brome decreased by
0.006 tillers m 2 at Site 1. Each 1 unit increase in spotted knapweed was associat- ed with a predicted 3.9 tillers m 2 increase in brome at Site 1. At Site 2, each 1 unit increase in spotted knapweed was associated with a 1.4 tillers m 2 increase in brome.
Cover. For each 1% increase in pre- treatment brome cover, predicted post- treatment brome cover increased by 141 % at Site 1 (Table 4). For each 1 % increase in the brome quadratic component, post- treatment brome decreased by 11 % at Site
1. At Site 2, each 1% increase in spotted knapweed cover was associated with a 0.8% increase in brome.
Biomass. For each 1 unit increase in pre-treatment brome biomass, post-treat- ment brome biomass increased by 0.05 g m 2 at Site 1 (Table 4). At Site 2, for each
1 unit increase in spotted knapweed, post- treatment brome decreased by 2.0 g m-2.
Each 1 unit increase in the spotted knap- weed quadratic component was associated with a 2.5 x 10⁻⁵ g m 2 increase in brome.
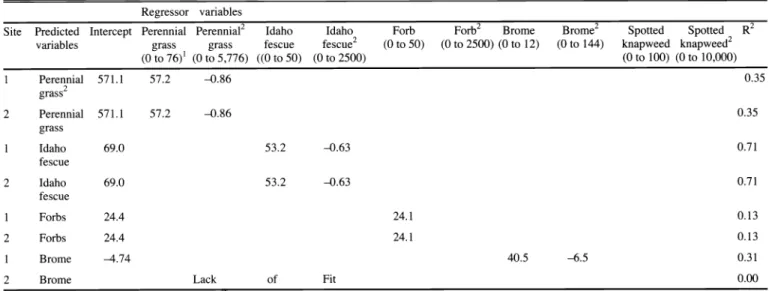
Predicting Biomass Using Cover Post-treatment perennial grass biomass was positively associated with pre-treat- ment indigenous perennial grass cover alone, but negatively associated to the indigenous perennial grass quadratic com- ponent (Table 5). For each 1 unit increase in pre-treatment indigenous perennial grass cover, predicted post-treatment perennial grass biomass increased by 57.2 g m 2 at both sites. For each 1 unit increase in the pre-treatment perennial
Table 5. Regression models predicting post-treatment biomass (g m 2) indigenous species based on pre-treatment cover of regressor variables. Empty cells represent non-significant regressor variables.
Regressor variables
Site Predicted Intercept Perennial Perennial2 Idaho Brome Spotted Spotted R2
grass
variables grass fescue to 50) to 2500) (0 to 12) to 144) knapweed knapweed2
(0 to 76)'
1(0 to 5,776) ((0 to 50) to 2500) to 100) (0 to 10,000)
1 Perennial grass2 2 Perennial
grass
1
Idaho fescue 2 Idaho
fescue
1