J. Range Manage.
57:411 -417 July 2004
Effect of canopy and grazing on soil bulk density
KENNETH W. TATE, DENNIS M. DUDLEY, NEIL K. MCDOUGALD, AND MELVIN R. GEORGE
Authors are Rangeland Watershed Specialist, Agronomy and Range Science, University of California, Davis, Calif 95616 -8515; Range Conservationist, Natural Resources Conservation Service, USDA, Madera, Calif 93637. Natural Resources and Livestock Advisor, University of California Cooperative Extension, Madera, Calif 93637; and Range and Pasture Specialist, Agronomy and Range Science, University of California, Davis, Calif 95616 -8515.
Abstract
This study compared soil surface bulk density between: 1) sites not grazed by cattle > 26 years; 2) sites not grazed for 6 years; 3) sites grazed for 15 years to October residual dry matter levels of
> 1100 kg ha-'; 4) sites grazed for 15 years to October residual dry matter levels of 670 to 900 kg ha-1; 5) sites grazed for 15 years to October residual dry matter levels of < 450 kg ha-1; and 6) sites subject to concentrated cattle use (trails, corrals, and sup- plemental feed -water stations). Sites were collected from across the 1,772 ha San Joaquin Experimental Range (SJER) in Madera County, Calif. to represent canopy cover (open grassland, blue oak (Quercus douglasii Hook and Am.), live oak (Quercus wis- lizenii A.DC.), foothill pine ( Pinus sabiniana Douglas), wedgeleaf ceanothus (Ceanothus cuneatus (Hook) Nutt.), and ceanothus interspace) and topography (swale, uplands) typical of the rocky coarse sandy loam soils of the southern Sierra Nevada foothill oak savannah. Soil surface (0 to 7.62 cm) bulk density (g cm3) was determined for 1489 soil cores collected across all available combinations of grazing management, canopy cover and topo- graphic position at the SJER. Soil surface bulk density was 0.23 to 0.30 g cm3 lower under canopy compared to open grasslands.
Bulk density was not different (P > 0.05) between sites not grazed
> 26 years and sites not grazed for 6 years. Grazing to residual dry matter levels of > 1100, 670 to 900, and < 450 kg ha-1 created bulk densities which were 0.08, 0.18, and 0.21 g cm-3 greater than non - grazed sites, respectively. Cattle concentration sites had bulk densities 0.37 to 0.47 g cm -3 greater than areas not grazed > 6 or 26 years. For the purpose of maintaining soil surface bulk density current residual dry matter recommendations for sites with canopy cover > 50% appear appropriate, but recommendations for open grasslands need additional review. In particular, residual dry matter level must be directly linked to soil surface infiltra- tion capacity.
Key Words: compaction, residual dry matter, RDM, annual rangeland, Sierra Nevada
Annual rangelands occupy an estimated 7 million ha in California, and provide 75% of the State's forage base (Griffin 1977). These rangelands contribute surface water to more than half of the State's drinking water reservoirs (FRRAP 1988).
Minimizing surface runoff and pollution transport by maintaining the infiltration capacity of annual rangeland soils is important for protecting the State's water supply. Blackburn (1984) summa-
Manuscript accepted 18 Nov. 03.
Resumen
Este estudio comparó la densidad aparente de la superficie del suelo entre:!) sitios no apacentados por ganado > 26 años;
2) sitios no apacentados durante 6 años; 3) sitios apacentados por 15 años hasta Octubre dejando niveles de materia seca residual de >1100 kg ha'; 4) sitios apacentados por 15 años hasta Octubre dejando de 670 to 900 kg ha-1 de materia seca residual; 5) sitios apacentados por 15 años hasta Octubre dejando niveles de materia seca residual de < 450 kg ha-1 y 6) sitios sujetos a concentraciones de ganado (caminos, corrales, y aguajes y estaciones de suplementación). Los sitios se selec- cionaron a través de las 1772 ha de la estación Experimental de Pastizales San Joaquin (SJER) en el condado de Madera, California para representar la cobertura de copa (pastizal abierto, y el interespacio de "Blue oak" (Quercus douglasii Hook and Arn.), "Live oak" (Quercus wislizenii A.DC.),
"Foothill pine" (Pinus sabiniana Douglas), "Wedgeleaf ceanoth- us" (Ceanothus cuneatus (Hook) Nutt.) y "Ceanothus ") y la topopgrafía (valles y terrenos altos) típica de los suelos franco arenosos pedregosos de la savana de encino de piedemonte del sur de la Sierra Nevada. La densidad aparente (g cm 3) de la superficie del suelo (0 a 7.62 cm) se determinó en 1489 muestras de suelo colectadas a través de todas las combinaciones disponibles de manejo del apacentamiento, cobertura de copa y posición tipográfica en el SJER. La densidad aparente de la superficie del suelo fue de 0.23 a 0.30 g cm -3 menor bajo la copa que en el pastizal abierto. La densidad aparente no fue difer- ente (P > 0.05) entre sitios no apacentados por mas de 26 y sitios no apacentados por 6 años. Apacentar hasta dejar niveles de materia seca residual de > 1100, 670 a 900 y < 450 kg ha -1 crearon densidades aparentes que fueron 0.08, 0.18, y 0.21 g cm-
3mayores que la de los sitios no apacentados. Los sitios de con- centración de ganado tuvieron densidades aparentes de 0.37 a 0.47 g cm -3 mayores que las áreas no apacentadas por > 6 o 26 años. Con el proposito de mantener la densidad aparente del suelo las recomendaciones actuales de materia seca residual en sitios con cobertura de copa > 50% parecen ser apropiadas, pero las recomendaciones para los pastizales abiertos necesitan una revisión adicional. En particular, los niveles de materia seca residual deben ser directamente relacionados con la capacidad de infiltración de la superficie del suelo.
rized the concerns that grazing may lead to soil compaction which increases soil bulk density, reduces soil porosity and infil- tration capacity causing increased surface runoff, soil erosion, and transport of non -point source pollutants. These concerns were reiterated in the Sierra Nevada Ecosystem Project Report, which serves as the science base for the amendment of grazing manage-
ment plans for the 10 National Forests in the Sierra Nevada Mountain Range (UCWRC 1996). Soil compaction from domestic livestock is attributed to hoof action, particularly under moist to wet soil conditions, and to reductions in soil organic matter content due to removal of above- ground herbaceous plant material and reduc- tion in rooting density and depth. A potential
benefit of moderate soil compaction is increased water holding capacity, which could benefit on -site plant production.
The most commonly reported measure of soil compaction is soil dry bulk density, expressed as the oven dry mass of soil per volume of soil (g cm') (Blake and Hartage 1986). In general as the soil surface is compacted, the volume of pore space in the soil's O and A horizon is reduced and its dry bulk density increases. This results in reduced pore space for surface water to infiltrate the soil surface, resulting in greater runoff. Several rangeland studies have shown that soil bulk density is nega- tively correlated with infiltration capacity and positively correlated with surface runoff (Packer 1953, 1963, Liacos 1962, Rauzi and Hanson 1966, Spaeth et al.
1996). Atwill et al. (2002) found soil sur- face bulk density to be positively correlat-
ed to the transport of the pathogen Cryptosporidium parvum from annual grass vegetated soil boxes under simulated rainfall conditions. In this experiment, soil bulk density interacted with percentage slope to determine pathogen transport. At a slope of 5 %, Atwill et al. (2002) report- ed a 12 to 49% increase in pathogen trans-
port in overland flow per 0.1 g cm-3 increase in soil bulk density across silty clay to sandy loam soil textures. Soils used in the experiment were typical of California's annual rangelands and agri- cultural regions.
A few experiments have compared soil surface bulk density under various levels of grazing management on annual range- lands. A common grazing management recommendation on California annual range is the achievement of end of dry season (October) residual dry matter (RDM) levels expected to promote sus- tainable forage production and quality lev- els, soil surface protection from erosion, and other benefits (Bartolome et al. 1980, 2002, and Clawson et al. 1982). On Los Osos clay loam soils east of Berkeley, Calif., Liacos (1962) found that soil sur- face bulk density on non - grazed sites (RDM -3800 kg há') averaged 1.4 g cm3, on heavily grazed sites (RDM -670 kg ha')
averaged 1.6 g cm', and that lightly grazed sites (RDM - 1400 kg ha') were interme-
diate. On coarse sandy loam soils at the San Joaquin Experimental Range (SJER) north of Fresno, Calif. Ratliff and Westfall (1971) found that soil surface bulk density was 24% lower within a 36 year non grazed site than on adjacent grazed sites.
At the SJER, Assaeed (1982) observed higher mean soil surface bulk densities on grazed sites (1.38 g cm-3) compared to 10 year non grazed sites (1.22 g cm-3).
Increased soil surface bulk density can be mitigated by natural processes such as burrowing rodents and freeze -thaw events.
The presence of blue oaks (Quercus dou- glasii Hook and Arn.) and other trees is a major factor effecting soil properties across California's annual rangelands (Dahlgren et al. 2003). The effects of tree canopy on soil properties is generally attributed to organic matter contributions from leaf litter and from nutrients con- tributed as through -fall during precipita- tion events. Frost and Edinger (1991) compared soil physical and chemical prop- erties in open grasslands to soils under blue oak, interior live oak (Quercus wis- lizenii A.DC.), foothill pine (Pinus sabini- ana Douglas) canopy under grazed and non - grazed conditions at the SJER. They
report a general trend toward greater amounts of organic carbon, lower bulk densities, larger cation exchange capacity, and greater amounts of most nutrients below tree canopy compared to open grasslands at both the 0 to 5 cm and 5 to 20 cm soil depth. Jackson et al. (1990), Dahlgren et al. (1997), and Camping et al.
(2002) report significantly higher overall soil quality (lower bulk density, higher organic matter, increased nutrient cycling, etc.) under oak canopy relative to open sites on oak woodland sites with clay loam soils at the Sierra Foothill Research and Extension Center near Browns Valley, Calif. Camping et al. (2002) also exam- ined soil quality between sites not grazed for 28 years and moderately grazed sites (residual dry matter levels > 900 kg há').
The authors report that soil surface bulk density (0 to 5 cm) was 12 and 9% higher under grazed conditions for sites under blue oak canopy and open grassland, respectively. There was no significant dif- ference in bulk density between grazed and non - grazed sites below a soil depth of 5 to 15 cm.
The specific objective of this study was
to compare soil surface bulk density between 6 levels of grazing management across canopy and topographic conditions typical of southern Sierra Nevada annual rangelands. Annual grasslands and associ-
ated tree and shrub communities occupy
approximately 1.8 million ha in the south- ern Sierra Nevada foothills (FRRAP 1988). Grazing levels examined were: 1) not grazed by domestic livestock for greater than 26 years, 2) not grazed by domestic livestock for 6 years, 3) 15 year history of light (> 1100 kg ha'' RDM) grazing by beef cattle, 4) 15 year history of moderate (670 -900 kg há' RDM) graz- ing by beef cattle, 5) 15 year history of heavy ( <450 kg ha' RDM) grazing by beef cattle, and 6) sites of cattle concentra- tion (trail, corral, supplemental feeding watering stations).
Methods Study Area
The study was conducted on the 1,772 ha San Joaquin Experimental Range (SJER) in Madera County, Calif. (37°
6'8 "N 119 °43'33 "W). The SJER has been operated by the USDA Forest Service as a rangeland research station since the early 1930's and has been grazed year around since that time with cattle. Elevation ranges from 213 m to 518 m. Climate is Mediterranean with 485 mm average annual precipitation falling almost entirely
November through May as rainfall.
Topography at the SJER is rolling with 0 to 30% slopes and significant swale areas formed from alluvial deposits. Swales at the SJER are intermittent wetlands which become saturated during the rainfall sea- son, gradually drying as the rainfall season ends. Swales produce green forage later into the summer months than adjacent uplands, leading to preferential grazing of swales by cattle.
Vegetation is oak savannah with annual grassland understory. Blue oak, interior live oak, foothill pine, and wedgeleaf ceanothus (Ceanothus cuneatus (Hook) Nutt.) dominate the overstory, while wild
oats (Avena fatua L.), ripgut brome (Bromus diandrus Roth), soft chess
(Bromus mollis, L.), and redstem filaree (Erodium cicutarium (L.) L'Her) dominate the open grassland and understory. Mean aerial canopy cover by trees and shrubs at SJER is approximately 30 %. Isolated trees and intermixed stands of live oak, blue oak, and foothill pine trees are both corn - mon. Wedgeleaf ceanothus stands are characterized with open interspaces of 0.5 to 2 m between small (2-4 m) groups of ceanothus.
The only soil type present at SJER is the Ahwanhnee Vista rocky coarse sandy loam (a coarse loamy, mixed, thermic Mollic Haploxeralf) (Ulrich and
Stromberg 1990). The soil dominates the southern Sierra Nevada foothills, for instance occupying 54,000 ha or 15.3% of Madera County's surface area. The soil
occurs in a north south belt approximate- ly 16 to 24 km wide ranging in elevation from 150 to 450 m, and is found in associ- ation with oak savannah vegetation com- munities. The soil is derived from decom- posing granite parent materials with soil depths from 0.5 to 1.0 m in upland positions (8 to 30% slope) and 1.0 to 3.0 m in swale positions (3 to 8% slopes). Granite bedrock outcrops are common. Representative tex- ture reported as percentage sand/silt/clay for the soil is 74.3/17.7/8.0, 74.1/16.9/9.0, and 86.5/7.5/6.0 for profile depths 0 to 30 cm, 31 to 70 cm, and 70 cm to bedrock, respec- tively. Organic matter contents for these same profile depths are 1.0 to 2.7 %, 0.5 to 1.5 %, and 0.1 to 0.5 %, respectively.
Grazing Management
Livestock exclosures have been con- structed and maintained at the SJER for various research related purposes.
Livestock exclosures were used in this study based upon the criteria of: 1) avail- ability of canopy cover type and topo- graphic position within the exclosure, 2) certainty of duration and effectiveness of livestock exclusion, and 3) comparability to grazed sites in terms of vegetation type, percentage slope, percentage rock outcrop, etc. Two livestock exclosures greater than 26 years of age (total area = 70 ha) at the time of sample collection (2001) and 3 exclosures created 6 years prior to sample collection (total area = 15 ha) met these criteria and were selected for use in this
study.
Detailed mapping of residual dry matter has been conducted annually in October across the SJER since 1985. Geographic information system technology was used to generate a 15 year average residual dry matter map for the entire SJER from the 15 individual annual residual dry matter maps (Harris et al. 2002). For this study, areas (10 to 30 ha) across the SJER with a 15 year residual dry matter history of less than 450 kg ha -I, 670 -900 kg ha-', and greater than 1100 kg ha' were randomly selected for inclusion in this project. Also existing across the SJER are various cattle concentration areas including corrals, sup- plemental feed and water stations, and trails. For this study we used cattle con- centration sites which were confirmed to have been in use for 15 years prior to sam- ple collection.
Soil Surface Bulk Density
Soil surface bulk density (g cm') was determined via the core method (Blake and Hartage 1986) using a 7.62 cm long by 4.78 cm diameter cylindrical metal core. All live vegetation and litter at each sample site (0.1 m2) was clipped to the mineral soil surface and removed prior to collection of the soil core. Soil cores were dried at 105° C in a forced air oven until a constant weight was achieved (24 to 48 hours). Soil cores were weighed on an analytical balance accurate to 0.001 g, and bulk density calculated as soil dry weight (g) divided by total core volume (136.74 cm3). A total of 1,489 soil cores were col- lected across the SJER during the fall, early winter, and spring of 2001, when soils were moist but not saturated.
Experimental Design
This study was a stratified random sur- vey of soil surface (0 -7.5 cm) bulk density across all available combinations of 3 fac- tors at SJER. The 3 factors were: 1) graz- ing management, 2) canopy cover, and 3) topographic position. Grazing manage- ment levels examined were: 1) not grazed by domestic livestock > 26 years, 2) not grazed by domestic livestock for 6 years,
3) 15 year history of light (> 1100 kg ha' RDM) grazing by beef cattle, 4) 15 year history of moderate (670 -900 kg ha' RDM) grazing by beef cattle, 5) 15 year history of heavy (< 450 kg ha' RDM) grazing by beef cattle, 6) cattle trails, 7) cattle corrals, and 8) cattle supplemental feeding and watering stations. Canopy cover types examined were: 1) open grass- land, 2) blue oak, 3) live oak, 4) foothill pine, 5) wedgeleaf ceanothus, and 6) cean- othus interspace. Topographic positions examined were: 1) swale, and 2) upland.
Sample areas with each level of grazing management were identified across the SJER (stratification). Sample areas ranged in area from 5 to 30 ha. Soil surface bulk density samples were randomly collected across all available canopy cover types and topographic positions within each sampling area. Where there was blue oak, live oak or foothill pine canopy, trunk diameter at breast height (DBH) was mea- sured for each individual tree by bulk den- sity sample combination. This cross -sec- tional survey is inherently unbalanced because: 1) not all combinations of graz- ing management, canopy cover, and topo- graphic position exist at the SJER, and 2) combinations do not exist in equal num-
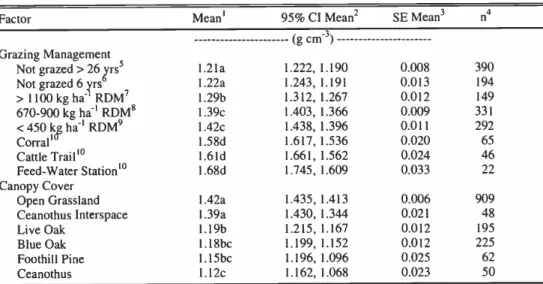
Table 1. Mean soil surface (0 to 7.6 cm) bulk density (g cm 3) across oak savannah rangeland sites
with different grazing management practices and canopy cover on the San Joaquin
Experimental Range, Madera County, Calif.
Factor Mean' 95% CI Meant SE Mean3 n4
Grazing Management
(g cm3)
Not grazed > 26 yrs5 1.21a 1.222, 1.190 0.008 390
Not grazed 6 y rs 1.22a 1.243, 1.191 0.013 194
> 1100 kg há 1 RDM7 1.29b 1.312, 1.267 0.012 149
670 -900 kg ha-1 RDM8 1.39c 1.403, 1.366 0.009 331
< 450 kg ha-1 RDM9 1.42c 1.438, 1.396 0.011 292
Corrals 1.58d 1.617, 1.536 0.020 65
Cattle Trail10 1.61d 1.661, 1.562 0.024 46
Feed -Water Station10 1.68d 1.745, 1.609 0.033 22
Canopy Cover
Open Grassland 1.42a 1.435, 1.413 0.006 909
Ceanothus Interspace 1.39a 1.430, 1.344 0.021 48
Live Oak 1.19b 1.215, 1.167 0.012 195
Blue Oak 1.18bc 1.199, 1.152 0.012 225
Foothill Pine 1.15bc 1.196, 1.096 0.025 62
Ceanothus 1.12c 1.162, 1.068 0.023 50
Within factor (management history and canopy cover), means with different letters were determined to be significantly different (P < 0.05).
295% confidence interval (upper, lower) of the mean.
3Standard error of the mean.
4Number of samples for each factor, total sample size = 1489.
5Not grazed by cattle for more than 26 years prior to sample collection.
6Not grazed by cattle for 6 years prior to sample collection.
7Grazed with cattle to an annual residual dry matter level of >1100 kg ha 1 over the 15 year period prior to sample col- lection.
$Grazed with cattle to an annual residual dry matter level of 670 to 900 kg ha 1 over the 15 year period prior to sample collection.
9Grazed with cattle to an annual residual dry matter level of less than 450 kg ha 1 over the 15 year period prior to sam- 1'le collection.
Cattle concentration sites (corral, trail, and supplemental feed - water station) for the 15 year period prior to sample collection.
bers across all sample areas available at the SJER. For example, there were no cat- tle corrals with tree cover, nor were there foothill pine or wedgeleaf ceanothus in swales. While open grassland, blue oak and live oak were prevalent across all sample areas, foothill pine and wedgeleaf ceanothus were less prevalent resulting in
a smaller sample size relative to the oaks.
Table 1 reports the sample size for each level of grazing management and canopy cover. Sample size for uplands and swales was 1011 and 478, respectively.
The data set (n = 1489) was analyzed via backward stepwise general linear model procedures with a test criterion of P
< 0.05 (SPSS, Inc. 2000) to identify sig- nificant main factors effecting soil surface
bulk density. Independent variables
included in the original model were graz- ing management history; topographic position; and canopy cover. Soil surface bulk density was the dependent variable.
Mean separation for levels of significant
factors was accomplished using a
Bonferroni test (P < 0.05). Two -way inter- actions were examined for all main fac- tors. Evaluation of residual error plots indicated that assumptions of normality, independence and constancy were met.
Simple linear regression was used to
examine relationships between tree size as measured by DBH (independent variable) and soil surface bulk density (dependent variable). It would be reasonable to expect soil surface bulk density to decrease with tree age -size, or time that the soil has been under the influence of canopy cover.
Results and Discussion
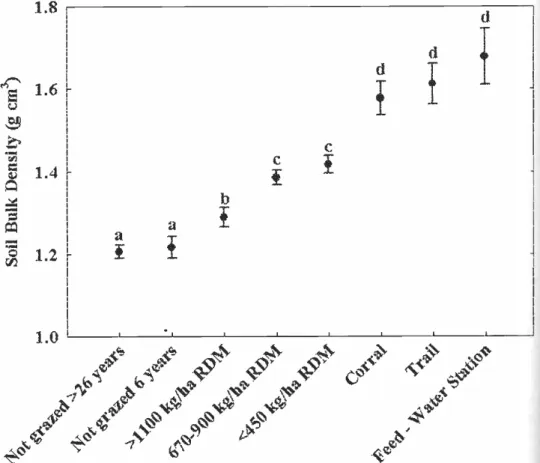
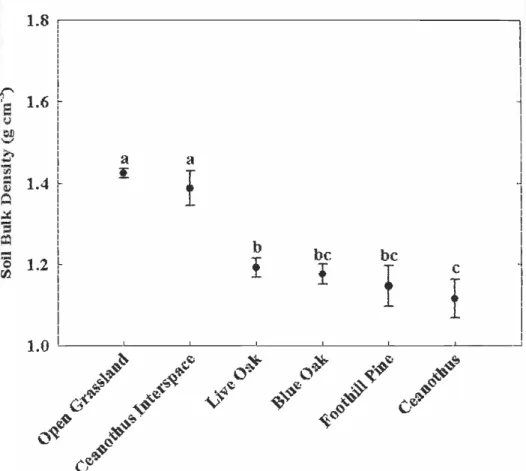
Backward stepwise analysis produced a final general linear model (multiple R2 = 0.56, n = 1489) identifying grazing man- agement and canopy cover as significant factors (P < 0.001) associated with soil surface bulk density at SJER. Topographic position was not a significant predictor of soil surface bulk density (P = 0.89). No interactions were found to exist between any of the main factors (grazing manage- ment, canopy cover, and topographic posi- tion). Figures 1 and 2 illustrate mean soil surface bulk density with 95% confidence intervals for grazing management and canopy cover, respectively. Table 1
reports the mean, mean standard error, and sample size for each factor.
Grazing Management
Livestock Exclusion. Soil surface bulk density was not different (P = 0.22) between sites not grazed for > 26 years and sites not grazed for 6 years; however, variation in surface bulk density was greater at sites not grazed for 6 years (Fig.
1, Table 1). The significant reduction in surface bulk density associated with live- stock exclusion compared to any level of grazing supports results reported from pre-
vious research on annual rangelands (Liacos 1962, Ratliff and Westfall 1971, Assaeed 1982). While this result provides information on potential surface bulk den- sity condition in the absence of grazing by cattle, it provides limited information for making grazing management decisions to minimize soil compaction in the presence of grazing.
Our results indicate that the reversal of soil compaction from grazing on these coarse sandy loam soils is relatively rapid.
Assaeed (1982) observed a significant reduction in surface bulk density (mean of 1.22 g cm-3) on sites not grazed for 10
1.8
years compared to grazed sites (mean of 1.38 g cm') at the SJER. The mean sur- face bulk densities reported by Assaeed (1982) are approximate, and supporting, to our findings (Table 1). One potential mechanism is an increase in activity of burrowing mammals within the exclo- sures, which was our casual observation in the non grazed sites and the conclusion of Ratliff and Westfall (1971). Another mechanism could be increased soil surface organic matter due to high levels of resid- ual dry matter within the exclosures. The mild climate at the SJER does not generate soil freezing and thawing, known to effect soil bulk density in colder climates. The rate at which soils recover from com-
paction from livestock grazing will likely vary based upon soil properties such as texture and structure, as well as antecedent grazing intensity.
Residual Dry Matter Level. Sites with grazing to any residual dry matter level had significantly higher bulk density (P <
0.001) than sites not grazed for > 26 years or for 6 years (Fig. 1, Table 1). Of grazed
1.0
a G3
}
d
d
.
-.S ,
,
b1::?`' ;4P:.,.A, t, V
G 9 ` L,?' F hr
1 ..;..S'a,-;44-S \. C-) ,--
°b
Fig. 1. Mean soil surface bulk density (g cm -3) for oak savannah rangeland sites subject to grazing management practices at the San Joaquin Experimental Range, Madera County, Calif. Grazing management practices are not grazed by domestic livestock for > 26 years and not grazed for 6 years; sites grazed annually by cattle for 15 years to residual dry mat- ter (RDM) levels of > 1100, 670 to 900, and < 450 kg ha-1; and cattle concentration areas including corrals, trails, and feed -water stations. Bars represent the 95 % confidence inter-
val of the mean. Means with different letters are significantly different (P < 0.05).
LS
1.6
°, t
L4
1 .2 L
L bc be
_j
1.0
. z
0'1 ß,to.
C."
Fig. 2. Mean soil surface bulk density (g cm 3) ent canopy cover types at the San Joaquin Bars represent the 95 % confidence interval significantly different (P < 0.05).
sites, those with a 15 year history of >
1100 kg ha-' residual dry matter had the lowest mean bulk density, followed by sites with a 15 year history of grazing to residual dry matter levels of 670 to 900 kg ha' and < 450 kg ha', which were not sig- nificantly different (P = 0.98). Sites grazed
> 1100, 670 to 900, and < 450 kg ha', had soil surface bulk densities which were 6, 15, and 17% greater than non grazed sites, respectively.
Our results agree with work by Liacos (1962) indicating that the level of soil compaction due to grazing on annual rangeland can be managed, at least in part, by managing for specific residual dry mat- ter levels. Analyzing soil surface infiltra- tion data collected on northern Great Plains grasslands, Spaeth et al. (1996) found infiltration capacity to be positively correlated with mulch levels, similar to our results showing soil surface bulk den- sity to be negatively correlated with resid- ual dry matter or mulch levels. It is likely that the season of grazing (winter growing season, summer drought period, continu- ous) also determines soil compaction. The predominant grazing season on annual rangelands in the south Sierra Nevada
for oak savannah rangeland sites with differ - Experimental Range, Madera County, Calif.
of the mean. Means with different letters are
foothills is during the winter rainfall grow- ing season when soils are moist and most susceptible to compaction. Season of graz- ing records are not available for the SJER, making it impossible to test for season of grazing effect, or a season of grazing by residual dry matter level interaction, on soil surface bulk density. The study areas used in this survey represent the range of season of use, but the season of use was certainly not constant at each site over the past 15 years.
Cattle Concentration Activities.
Activities which concentrate cattle were associated with the greatest soil com- paction encountered in this study having bulk densities 30 to 40% greater than areas not grazed > 26 years, and 18 to 22%
greater than surrounding grazed areas (Fig. 1, Table 1). While there was an apparent increase in soil surface bulk den- sity from corrals to trails to supplemental feed water stations, these sites were not significantly different (P > 0.85 for all comparisons). This result clearly illus- trates the importance for managers to con- sider the location of cattle concentration sites relative to waterbodies of concern.
Compacted soil conditions at cattle con-
centration sites pose the greatest livestock related risk of increased surface runoff and transport of non -point source pollutants on these rangelands. Significantly higher cat- tle fecal loading rates are associated with concentration sites compared to other grazed areas (Larsen 1996, Bailey and Welling 1999, Tate et al. 2003). Trails almost always lead to and from cattle con- centration sites, crossing streams and wet- lands, and thus greatly increasing the hydrologic connectivity between sources of contaminants and waterbodies. George et al. (2002) report 136 to 550% greater sediment transport from livestock trails than adjacent grassland at the SJER.
Canopy Cover
Canopy cover by any tree or shrub species used in this survey significantly reduced soil surface bulk density (16 to 22 %) compared to open grassland or wedgeleaf ceanothus interspace (P < 0.001 for all comparisons) (Fig. 2, Table 1). Soil surface bulk density was not significantly different for open grassland sites and sites located in ceanothus interspace (P = 0.99).
Soils under live oak and ceanothus had significantly different (P = 0.02) surface bulk density, but all other canopy types were statistically similar (P > 0.31 for all comparisons). Our results confirm that canopy cover is a major factor determin- ing soil bulk density on annual rangelands, agreeing with work conducted by others illustrating that oaks create enhanced fer- tility beneath their canopy through organic matter incorporation and nutrient cycling, leading to elevated soil quality relative to adjacent grasslands (Kay 1987, Jackson et al. 1990, Frost and Edinger 1991,
Dahlgren et al. 1997, 2003). Low soil sur- face bulk density is one component of high soil quality.
Simple linear regression revealed no significant relationships between tree size as measured by diameter at breast height (DBH) and soil surface bulk density for live oak (P = 0.85, n = 195). Significant relationships between DBH and soil bulk density were found for blue oak (P = 0.03, multiple R2 = 0.02, slope = 0.003, inter- cept = 1.22, n = 225) and foothill pine (P = 0.002, multiple R2 = 0.16, slope = 0.01, intercept = 1.39, n = 62). Minimum and maximum DBH for live oak, blue oak and foothill pine used in this study was 16 to 200, 7 to 137, and 16 to 86 cm, respective- ly. Due to the multi -stem growth habit of live oak, the relationship between age and DBH is weak at best. While age and DBH are positively correlated for blue oak, numerous researchers have concluded that
the relationship is highly variable across sites and within stands (McClaran 1986, McClaran and Bartolome 1989, Kertis et al. 1993). Foothill pine has a short life - span (< 100 years) relative to blue oak (200 to 300 years) which probably accounts for the stronger relationship between soil surface bulk density and DBH compared to blue oak.
Topographic Position
Topographic position was not a signifi- cant predictor of soil surface bulk density despite swales having a higher grand mean bulk density (1.41 g cm -3) compared to upland bulk density (1.29 g cm-3). Grazing management and canopy levels accounted for the differences between topographic positions due to the fact that there is limit- ed canopy cover by trees or shrubs in swales, and that swales are almost always associated with low residual dry matter levels (heavy grazing pressure) due to the late season green forage they produce.
Residual Dry Matter Recommendations
The results of our research are directly comparable to published residual dry mat- ter recommendations for the sustainable management of annual rangelands in California. Current residual dry matter recommendations are based upon research and observation linking residual dry mat- ter to herbaceous plant community compo- sition, forage production and ground cover. Recently revised residual dry mat- ter recommendations are based upon pre- cipitation amount, percentage slope and percentage canopy cover (Bartolome et al.
2002). Recommended residual dry matter levels increase as precipitation amount and percentage slope increase, and decrease as
percentage canopy cover increases.
Recommendations for oak savannah range sites in the south Sierra Nevada foothills range from a minimum of 110 kg ha' for
> 75% canopy cover at < 10% slope to 900 kg ha-' for < 25% canopy cover at >
40% slope (Bartolome et al. 2002).
Original recommendations given by Clawson et al. (1982) for the same range type were from 450 kg ha-' at "low" slopes to 900 kg ha' at "steep" slopes. The origi- nal recommendations by Clawson et al.
(1982) did not account for the variable effect of canopy cover on potential herba- ceous production. While scattered blue oaks will increase herbaceous production, canopy cover reaches a level ( -50 %) where shading negatively effects herba- ceous production.
Our results and other published research indicate that canopy cover will maintain mean soil surface bulk density at or below the mean bulk density for non - grazed con- ditions, off - setting soil compaction by livestock (Table 1) (Frost and Edinger 1991, Dahlgren et al. 2003). For the pur- poses of maintaining soil surface bulk density, recommended residual dry matter levels for canopy levels > 50% (110 to 560 kg ha-') appear appropriate. However, for canopy cover < 50 %, recommended residual dry matter levels (450 to 900 kg ha') correspond to a 15 to 17% increase in soil surface bulk density compared to non - grazed conditions (Fig. 1, Table 1). The results reported in this paper for open grassland sites, and published studies of grazing intensity effects on soil surface bulk density and infiltration capacity, clearly illustrate that any level of grazing will increase soil bulk density, and likely reduce infiltration capacity, relative to no grazing (Liacos 1962, Ratliff and Westfall 1971, Gifford and Hawkins 1978, Assaeed 1982, Dahlgren et al. 2003).
From a water quality protection perspec- tive, the important issue is whether the level of soil compaction associated with accepted residual dry matter recommenda- tions reduces infiltration capacity suffi- ciently to increase surface runoff and transport of pollutants to nearby waters.
There is limited published information available on the infiltration capacity of the coarse sandy loam soils typical of the south Sierra Nevada foothills, particularly relative to residual dry matter levels.
Infiltration capacity on these rangelands is inherently high due to soil texture (74.3%
sand, 17.7% silt, 8% clay). In a previous rainfall simulator experiment examining pathogen transport at the SJER we applied 7.62 cm hour' of rainfall to a saturated open grassland plot having soil surface bulk density of 1.50 g cm-3 and a 15 year residual dry matter level of < 450 kg ha' (Tate et al. 2000). This rainfall rate exceeds the 100 year return internal 30 minute duration rainfall event (Hershfield 1961). During the course of the 90 minute application period, only 4% of the applied rainfall was realized as overland flow, 96%
of the applied water was infiltrated. Thus, the increase in soil surface bulk density associated with recommended residual dry matter levels potentially does not result in increased surface runoff in this landscape, given the inherently high infiltration capac- ity of these soils. This possibility must be examined in future studies which directly link residual dry matter, infiltration and runoff. A potential benefit of moderate soil
compaction associated with grazing to rec- ommended residual dry matter levels, par- ticularly in these sandy soils, is increased water holding capacity which would bene- fit on -site plant production.
Summary and Conclusions We found canopy cover and grazing management to significantly affect soil surface bulk density on oak savanna rangelands at San Joaquin Experimental Range. Soil surface bulk density was 16 to 22% lower under canopy compared to open grasslands or wedgeleaf ceanothus interspace. There was no significant dif- ference in soil surface bulk density between sites not grazed > 26 years and sites not grazed for 6 years, indicating that reversal of soil compaction from grazing occurs rapidly in this landscape. Sites with a 15 year history of grazing to residual dry matter levels of > 1100, 670 to 900, and <
450 kg ha' had soil surface bulk densities 6, 15, and 17% greater than non grazed sites, respectively. Cattle concentration sites had bulk densities 30 to 40% greater than areas not grazed > 26 years, and 18 to 22% greater than surrounding grazed areas, and clearly represent the largest risk of increased runoff and contaminant trans- port on these rangelands. Current residual dry matter recommendations for sites with canopy cover > 50% appear appropriate for maintaining soil surface bulk densities.
Residual dry matter recommendations for open grassland sites need further critical review to determine if the observed increases in soil surface bulk density translate to sufficient reductions in soil infiltration capacity to increase surface runoff and subsequent contaminant trans- port. The decrease in soil surface bulk density associated with decreasing resid- ual dry matter level may not correlate to a proportional increase in surface runoff.
Literature Cited
Assaeed, M.A. 1982. The effect of cattle graz- ing on soil compaction on California foothill grasslands. M.S. Thesis, Calif. State Univ.
Fresno, Calif.
Atwill, E.R., L. Hou, B.M. Karle, T. Harter, K.W. Tate, and R.A. Dahlgren. 2002.
Transport of Cryptosporidium parvum Oocysts through Vegetated Buffer Strips and
Estimated Filtration Efficiency. Appl.
Environ. Microbiol. 68:5517 -5527.
Bailey, D.W. and G. R. Welling. 1999.
Modification of cattle grazing distribution with dehydrated molasses supplement. J.
Range Manage. 52:575 -582.
Bartolome, J.W., M.C. Stroud, and H.F.
Heady. 1980. Influence of natural mulch on forage production on differing California annual range sites. J. Range. Manage.
33:4 -8.
Bartolome, J.W., W.E. Frost, N.K.
McDougald, and M. Connor. 2002.
California guidelines for residual dry matter (RDM) management on coastal and foothill annual rangelands. Univ. Calif. Div. Agr. and Nat. Resourc. Pub. 8092.
Blackburn, W.H. 1984. Impacts of grazing intensity and specialized grazing systems on watershed characteristics and responses. p.
927 -1000. In: Developing strategies for rangeland management. Nat. Res.
Counc. /Nat. Acad of Sci. Westview Press, Boulder, Colo. and London, England Blake, G.R. and K.H. Hartage. 1986. Bulk
Density. p. 363 -367. In: A. Klute (ed.) Methods of Soil Analysis. Part 1. Physical and Mineralogical Methods Agronomy Monograph #9 (2nd Edition).
Camping, T.J., R.A. Dahlgren, W.R.
Horwath, and K.W. Tate. 2002. Changes in soil quality due to grazing and oak tree removal in California oak woodlands. p.
75 -85. In: R.B. Standiford, D. McCreary, and K.L. Purcell (tech. coord.) Proc. Symp.
Oaks in California's Changing Landscape.
Gen. Tech. Rep. PSW -184. Pacific SW Forest and Range Exp. Sta., USDA Forest Serv., Berkeley, Calif.
Clawson, W.J., N.K. McDougald, and D.A.
Duncan. 1982. Guidelines for residue man- agement on annual range. Leaflet 21327.
Univ. of Calif. Div. of Agr. And Nat. Res. 3 p.
Dahlgren, R.A., M.J. Singer, and X. Huang.
1997. Oak tree and grazing impacts on soil properties and nutrients in a California oak woodland. Biogeochem. 39:45 -64.
Dahlgren, R.A., W.R. Horwath, K.W. Tate, and T.J. Camping. 2003. Blue oak enhance soil quality in California oak woodlands.
California Agr.. 57:42 -47.
Frost, W.E. and S.B. Edinger. 1991. Effects of tree canopies on soil characteristics of annual rangeland. J. Range. Manage.
44:286 -288.
FRRAP. 1988. California's forests and range- lands: growing conflict over changing uses.
Forest and Rangeland Resources Assessment Program. Calif. Dept. Forestry and Fire Protection. 348 pp.
Gifford, G.F. and R.H. Hawkins. 1978.
Hydrologic impacts of grazing on infiltra- tion: a critical review. Water Resour. Res.
14:305 -313.
George, M.R., N.K. McDougald, K.W. Tate, and R.E. Larsen. 2002. Sediment dynamics and sources in a grazed hardwood rangeland watershed. p.65 -74. In: R.B. Standiford, D.
McCreary, and K.L. Purcell (tech. coord.) Proc. Symp. Oaks in California's Changing Landscape. Gen. Tech. Rep. PSW -184.
Pacific SW Forest and Range Exp. Sta., USDA Forest Serv., Berkeley, Calif.
Griffin, J.R. 1977. Oak woodland. p.383 -416.
In: M.G. Barbour and J. Major (eds)
Terrestrial Vegetation of California. Wiley, New York, N.Y.
Harris, N.R., W.E. Frost, N.K. McDougald, M.R. George, and D.L. Nielsen. 2002.
Long -term residual dry matter mapping for monitoring California hardwood rangelands.
p. 87 -96. In: R.B. Standiford, D. McCreary, and K.L. Purcell (tech. coord.) Proc. Symp.
Oaks in California's Changing Landscape.
Gen. Tech. Rep. PSW -184. Pacific SW Forest and Range Exp. Sta., USDA Forest Serv., Berkeley, Calif.
Hershfield, D.M. 1961. Rainfall frequency atlas of the United States for durations from 30 minutes to 24 hours and return periods from 1 to 100 years. Tech. Pap. No. 40. U.S.
Dept. Commerce, Weather Bureau,
Washington, D.C. 120 pp.
Jackson, L.E., R.B. Strauss, M.K. Firestone, and J.W. Bartolome. 1990. Influence of tree canopies on grassland productivity and nitro- gen dynamics in deciduous oak savanna.
Agr. Ecosys. Environ. 32:89 -105.
Kay, B.L. 1987. The effect of blue oak removal on herbaceous production on a foothill site in the northern Sierra Nevada. p.
343 -350. In: T.R. Plumb and H.R. Pillsbury (tech. coord.) Proc. Symp. Multiple use man-
agement of California's oak hardwood
resources. Gen. Tech. Rep. PSW -100. Pacific SW Forest and Range Exp. Sta., USDA Forest Serv., Berkeley, Calif.
Kertis, J.A.; R. Gross; D.L. Peterson, R.B.
Standiford, and D.D. McCreary. 1993.
Growth trends of blue oak (Quercus dou- glasii) in California. Can. J. Forest Res. 23:
1720 -1724.
Larsen, R.E. 1996. Survival and transport of fecal pathogens in grazed watersheds.
p.59 -71. In: M.R. George (ed) Livestock management in grazed watersheds. Univ.
Calif. Div. Agr. and Nat. Resourc. Pub. 3381.
Liacos, L.G. 1962. Water yield as influenced by degree of grazing in the California winter grasslands. J. Range Manage. 15:67 -72.
McClaran, M. P. 1986. Age structure of Quercus douglasii in relation to livestock grazing and fire. Ph.D. Diss., Univ. Calif.
Berkeley, Calif. 119 pp.
McClaran, M.P. and J.W. Bartolome. 1989.
Fire related recruitment in stagnant Quercus
douglasii populations. Can. J. Forest
Research. 19: 580 -585.
Packer, P.E. 1953. Effect of trampling distur- bance on watershed condition, runoff and erosion. J. Forestry 51:28 -31.
Packer, P.E. 1963. Soil stability requirements for the Gallatin elk winter range. J. Wildl.
Manage. 19:351 -356.
Ratliff, R.D. and S.E. Westfall. 1971.
Nongrazing and gophers lower bulk density and acidity in annual -plant soil. Res. Note PSW 254. Pacific SW Forest and Range Exp.
Sta., USDA Forest Serv., Berkeley, Calif.
Rauzi, F. and C.L. Hanson. 1966. Water intake and runoff as affected by intensity of grazing. J. Range Manage. 19:351 -356.
Spaeth, K.E., F.B. Pierson, M.A. Weitz, and R.G. Hendricks. 1996. Grazing land hydrol- ogy issues: Perspectives for the 21' Century.
Soc. Range Manage. 136 pp.
SPSS, Inc. 2000. Systat 10 Statisitcs I.
Chicago, Ill. 663 pp.
Tate, K.W., E.R. Atwill, M.R. George, and N.K. McDougald. 2000. Cryptosporidium parvum transport from cattle fecal deposits on California rangeland watersheds. J. Range Manage. 53:295 -299.
Tate, K.W., E.R. Atwill, N.K. McDougald, and M.R. George. 2003. Spatial and tempo- ral patterns of cattle feces deposition on rangeland. J. Range Manage. 56:432 -438.
Ulrich, R. and L.R. Stromberg. 1990. Soil survey of Madera area, California. USDA NRCS. 155 pp.
UCWRC. 1996. Status of the Sierra Nevada:
summary of the Sierra Nevada Ecosystem Project report. Univ. Calif. Wildl. Resources Center Rep. No. 39. Univ. California, Davis.