Munich Personal RePEc Archive
Research on Optimization Strategy of
CPPI
HU, Baoyuan
Rennes schcool of business
2018
Online at
https://mpra.ub.uni-muenchen.de/88703/
Research on
Optimization Strategy
of CPPI
Authors:
Abstract
Economic globalization and financial market integration have increased fluctuation in
financial markets. Investors expect an investment and wealth management product
that can maintain the minimum protection when the price decreases, while it brings profits when the market grows. So the portfolio insurance strategy just meets the
investors' requirements.The research analyzes the operation mechanism of CPPI, and
then empirically tests the performance and risk of CPPI strategy based on the
back-testing method.
Keywords: CPPI; operating mechanism; investment and wealth management
Introduction
Investors encounter a variety of risks when investing in the financial markets, the key
of risk control is that seeks ways to quantify risks.In other words, the meaning is how
to quantify the risk, so that venture capital investors can more clearly understand the
market they face. The rapid development of new financial derivatives makes the
financial market more difficult to control, resulting in a sharp improvement in risk. It is important to investors and market regulators that grow the supervision of market risks and ensure the stable development of the market.
CPPI's operating mechanism
The core idea of CPPI is that investors set a minimum acceptable level of portfolio value, to calculate the safety margin that goes beyond the bottom line and invest in
risky assets with some amplification multiplier (Dichtl and Drobetz, 2010).In order to
implement the CPPI strategy of portfolio insurance, investors must confirm the capital
preservation bottom lineFfirstly at any moment during the capital preservation cycle.
This bottom line adds value to the risk-free return on assets and guarantees capital
preservation after maturity (Dichtl and Drobetz, 2010). CPPI strategy portfolio
consists of risk-free capital preservation assetsC such as government bonds and risky
assetsRlike equities.The margin of safetyN is between the portfolio valueV and the
bottom lineF.CPPI strategy decision rule is that in the portfolio, the risk assetsRand
safety margin N maintain a constant ratio m greater than 1, also known as
amplification multiplier.Then constitute the following model:
F N C R
V= + = + (1)
) (
= V F
R m ~ (2)
The current capital preservation bottom line, which is based on the final capital reserve target for the portfolio (which is a percentage of the principal level, such as 90%), and a reasonable discount rate (according to the bond yield to maturity Kobe)
can also be referred to as the value reference line(Louis and Xavier, 2010). For
preservation. The risk mat is a certain proportion of the investment principal, which is
generally within 5%.The minimum target value line for the portfolio is the sum of the
capital preservation bottom line and the risk cushion, and the safety margin is the current portfolio value minus the portfolio minimum target value line, which represents the asset portfolio's ability to withstand impairment when the market fluctuates (Chen and Liao, 2007).
Moreover, the Portfolio Insurance CPPI strategy requires ensuring that the
amplification multiplier is within the target's monitoring range.However, too frequent
adjustments also imply huge transaction costs, for which reason dynamic adjustment
rules of risk assets must be determined on a regular basis. For convenience of
explanation, the following symbols are defined: T is the CPPI strategy to protect the
deadline; Rtis the value of a risky asset at time t (t [0, T ]);Nt is the safety
offset oft;mtis the calculated amplification multiplier for t,md is the lower bound
for the calculation of the amplification multiplier, muis the upper bound for the
calculation of the amplification multiplier, m is the standard amplification multiplier,
andCt is the capital preservation value of t(If
t
C is a negative cash position when
the CPPI strategy allows borrowing, further assume the largest cash lending position is Cd).
During CPPI strategy [0, T ], on a certain dynamic day, the dynamic adjustment rules
of risky assets ratio can be divided into the following four cases:
1. WhenNt>0, andmd mt mu, it indicates that the proportion of risk assets
within the scope of monitoring will not be adjusted. The value of the risky asset
configured at this time isRt=Ntmt.
2. WhenNt>0, andmt>mu, it indicates that the proportion of risky assets is too
large. At this point, the ratio of risky assets must be adjusted downwards to the
standard amplification multipliermon the period of regular adjustment, and the
adjusted risk asset value isRt=Ntm.
3. WhenNt>0, and
d t<m
m , At this point, ifCt>Cd, should further reduce the
capital preservation of assets and increase the risk-holding assets; ifCt=Cd, that
has reached the maximum amount of borrowing, maintaining the number of original risk assets, will not be adjusted.
The occurrence of cash events is generally due to the sudden and drastic decline of
the market, which cannot result in the timely liquidation of risky assets. For
ensuring that the portfolio is above the capital preservation level at the end of the
capital preservation period, when the safety margin is reduced to Nt=0, the risk
assets in the investment portfolio must be cleared and allocated to the
capital-guaranteed assets, with Rt=0.
In summary, the following proposition can be drawn.
Proposition 1: When the decrease of market causes the calculation of amplification multiplier to exceed the upper limit of the monitoring ratio, the CPPI strategy requires
the reduction of holdings of risky assets and the preservation of assets; When
calculated multiplier fall to the lower limit of the monitoring ratio because of the improvement of market, the CPPI strategy requires the holdings of risky assets to be
capital-protected up to the maximum borrowing limit. Therefore, in essence, the
portfolio insurance CPPI is a" more and more to buy, more or sell more" investment strategy.
CPPI's payment function
Assume that a CPPI portfolio can invest in two types of assets: one is a money market
account, denoted byB;the other is a tradable portfolio of risk assets, denoted byS,
such as a composite stock index. The investment period is [0, T ] and each
investment strategy is self-financing. The value of Brisk-free asset obeysdB rdt
t
t=B .
Among them, r is the risk-free interest rate of continuous compound interest. The
market value of a risk portfolio obeys the following classic stochastic diffusion process(Joossens and Schoutens, 2015):
) =(udt t
dS dW
t + (3)
At any momentt, the CPPI strategy must ensure that the portfolio value is above the
bottom line valueFt,Ft provides the dynamically variable maturities, apparentlyFt
obeys the following:
rdt dF Ft
t= (4)
According to the operating mechanism of the portfolio CPPI strategy, Vt=Ct+Rt;
Taylor formula, the CPPI portfolio value at time t can be expressed as: t t t t S dS R F dF R V
V t +
t t
t
-d =( ) (5)
And because of Vt=Ft+Nt, according to type (3), type (4) and type (5), the safety
offset meets the following random process:
) (
d dNt= Vt−Ft
] d m dt r u m [ d d d d -t t t t t t t t t t t t t t t t t W r N F mN F F mN F N dF S S R F F R V + + − − + − + − + ) ) ( ( = ) =( ) =( (6)
Obviously, F0 must be less thanV0, and the difference between the two V0−F0 is
denoted by N0. Based on formula (6):
] t ) 2 ) ( m [ exp t 2 2 0
t m W
m r r u N
N= ( − + − + (7)
From (3), the stochastic differential equation ) ]
2 ( exp[
2
0
t S W u t
S= t + − of risk
asset S can be drawn as:
t ) 2 1 ) ln 1 2 0 t
t − u−
S S
W= ( ( (8)
Substituting formula (8) into formula (7):
} {
) (
= ]t
2 ) 2 2 ( [ exp 2 2 m 0 t 0 t m r m r S S N
N − − − (9)
Letting ] 2 ) 2 r [ ] t [ exp 2 2 2 0 0 t
r m m
S N
m) , = − ( − −
=( , according toVt=Ft +Nt,
from (4) and (9), the value of CPPI strategy portfolio at any time t in the investment
interval [0, T] is a function of the amplification multipliers m and S as follows:
m t S F S V t rt 0 t
t m, )= e +
( (10)
Generally, the portfolio insurance CPPI strategy has a capital preservation cycle of 1 year, a risk asset initial price of 100, a volatility of 20%, a capital preservation target
maturity asset prices is 0 ~ 200. And CPPI standard amplification multipliers m respectively is 2, 4, 6 and 8(Joossens and Schoutens, 2010).
Proposition 2: Portfolio Insurance CPPI strategy effectively controls the downside risk in the market while also giving investors an opportunity to participate in an upside market.
Proposition 3: The payment curves of any two CPPI strategies intersect, and the payment curve of one CPPI strategy will not be completely above another curve. Therefore, there is no dominant CPPI strategy.
CPPI strategy and its optimization of empirical research
The following report empirically tests CPPI strategy performance and its risk based
on back-testing. At present, 55 surviving capital preservation funds have relatively
short term of protection, usually 3 years. In order to examining the impact of the capital preservation term on the CPPI strategy, this paper selects two capital
preservation periods: the first, the long-term portfolio, April 23, 2009 ~ December 24,
2014; the second, the short-term portfolio, 2014 July 1 ~ June 28, 2017 This paper
selects the SSE 180 Index and the CSI 300 Index as risk assets for long-term and
short-term portfolios respectively.
adjustment mechanism can be activated in advance;(6) The CPPI strategy costs are as follows: the management fee is 1% and the hosting fee is 0.5%; (7) The main interest
rates are as follows: the interest rate of short-term funds is 2.5%, and the term
structure of capital preservation assets refers to Interest rate level of the inter-bank
bond market; (8) Mandatory dividend or split clause. If the asset portfolio share is
more than 1.5 yuan for two consecutive dynamic adjustment days, the manager can choose to dividend or divide to return the share face value back to $ 1 and start a new
CPPI simulation; (9) After the cash incident, investors further have the following
options: Fixed-income securities held with the remaining duration of the guaranteed
period achieves the capital preservation target,Or the combined share of assets after
the cash incident causes the share of the value of the restoration of 1 yuan and a new round of CPPI strategy simulation.
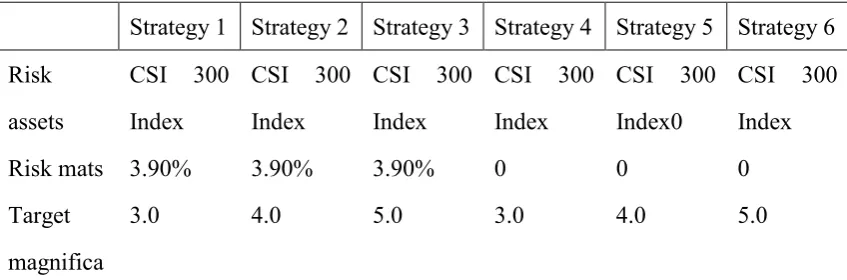
Table 1 shows the results of the short-cycle CPPI strategy back-testing. Among them,
the target amplification multipliers are set to 3, 4, and 5 respectively. The risk mats for strategy 1 to strategy 3 are 3.9% and the level of principal protection is set to 100%; while the risk mat of Strategy 4 ~ Strategy 6 is 0, and the guaranteed level is set as 90%. During the sample period, the CSI 300 Index fluctuated from 2526 points to
2201 points with a gain of -12.59%.However, strategies 1 ~ 3 with relatively low risk
[image:8.595.86.510.586.726.2]levels all achieved the capital preservation successfully, while strategies 4 ~ 6 with relatively high risk levels also achieved 90% of the capital preservation targets.
Table 1 Short-cycle CPPI Strategy Back-testing Results (2014-07-01 ~ 2017-06-28)
Strategy 1 Strategy 2 Strategy 3 Strategy 4 Strategy 5 Strategy 6
Risk
assets
CSI 300
Index
CSI 300
Index
CSI 300
Index
CSI 300
Index
CSI 300
Index0
CSI 300
Index
Risk mats 3.90% 3.90% 3.90% 0 0 0
Target
magnifica
tion
multiplier
Amplify
the lower
limit of
the
multiplier
2.5 3.5 4.5 2.5 3.5 4.5
Enlarge
the
multiplier
limit
3.5 4.5 5.5 3.5 4.5 5.5
Guarantee
d level
100% 100% 100% 91% 91% 91%
CPPI
revenue
4.22% 0 0 -3.34% -5.01% -7.52%
CPPI
Volatility
6.99% 8.91% 10.95% 12.90% 15.17% 17.11%
CSI 300
Index
earnings
-12.59% -12.59% -12.59% -12.59% -12.59% -12.59%
CSI 300
Index
volatility
20.61% 20.61% 20.61% 20.61% 20.61% 20.61%
As the stock market continued to fall, Strategy 2, Strategy 3, had a cash incident on
January 2, 2017. Compared with the 20.61% volatility of the CSI 300 Index, the
volatility of all CPPI strategies is significantly reduced. In particular, the volatility of Strategy 1 is only 6.99%(Schöttle and Werner, 2015).
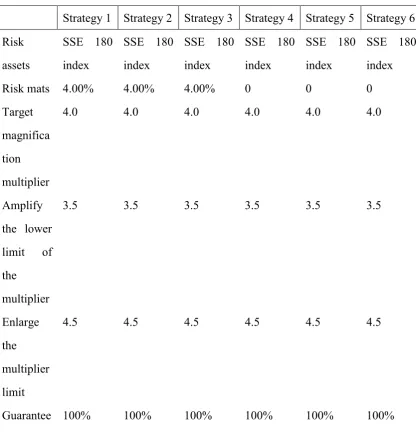
The long-period CPPI strategy returns and volatility characteristics are shown in Table
guaranteed level is 100%.During the sample period, the SSE 180 index rose 41.17%,
but it experienced a surge and then a sharp decline. This paper introduces the cash
lending mechanism, mandatory dividend or disagreement clause and investors' cash event option mechanism while examine the impact of CPPI strategy optimization on
performance and risk characteristics. Among them, Strategy 1 is the standard CPPI
strategy; Strategies 2 and 5 introduce investors’ cash event options; Based on this,
[image:10.595.88.505.324.766.2]strategies 3 and 6 also introduce a mandatory dividend or split clause strategy; the maximum loan ratio of strategy 4 to strategy 6 is 50% (Schöttle and Werner, 2015).
Table 2: Long-cycle CPPI Strategy Back-testing Results (2009-04-23 ~ 2014-12-24)
Strategy 1 Strategy 2 Strategy 3 Strategy 4 Strategy 5 Strategy 6
Risk
assets
SSE 180
index
SSE 180
index
SSE 180
index
SSE 180
index
SSE 180
index
SSE 180
index
Risk mats 4.00% 4.00% 4.00% 0 0 0
Target
magnifica
tion
multiplier
4.0 4.0 4.0 4.0 4.0 4.0
Amplify
the lower
limit of
the
multiplier
3.5 3.5 3.5 3.5 3.5 3.5
Enlarge
the
multiplier
limit
4.5 4.5 4.5 4.5 4.5 4.5
d level
The
maximum
loan ratio
0 0 0 50% 50% 50%
Mandator
y
dividend
or split
No No Yes No No Yes
Cash
incident
option
No Yes Yes No Yes Yes
CPPI
revenue
0 42.05% 169.85% 0 46.24% 188.25%
CPPI
Volatility
6.54% 27.12% 15.74% 6.54% 31.14% 17.23%
SSE 180
Index
earnings
41.17% 41.17% 41.17% 41.17% 41.17% 41.17%
SSE 180
Index
volatility
[image:11.595.90.499.79.568.2]29.41% 29.41% 29.41% 29.41% 29.41% 29.41%
Table 2 shows that Strategy 1 had a cash event on January 18, 2012 with a simulated
return of zero.Strategy 2 sets the investor option after a cash incident but does not set
a mandatory dividend or split clause.For example, a cash event occurred on January
18, 2012 with simulated earnings of 42.05%.Strategy 3 not only has set a mandatory
dividend or split clause, but also set the investor cash event option mechanism. There were four mandatory dividends or split events, including: October 20, 2010, July 5,
2012, January 31, 2013, October 17, 2013,and a cash incident occurred on February
CPPI strategies 1 ~ 3, after the introduction of the lending mechanism, the simulation benefits of strategies 4 ~ 6 have been improved, at the same time the volatility has also increased accordingly.
Back-testing results show that CPPI strategy volatility is significantly lower relative
to the SSE 180 Index and the CSI 300 Index, except for the long-term CPPI strategy 5.
In addition, optimizing the CPPI strategy through innovative mechanisms, such as the introduction of cash event option mechanism, can make full use of possible reversal
opportunities after the market falls sharply (Moresi, et al. 2011); In a significantly
rising market, the introduction of a mandatory dividend or split mechanism can lock in huge income earlier; The introduction of a cash lending mechanism will help to capture the higher returns from the market as it suffers from a higher level of risk.
Conclusion
Portfolio Insights CPPI strategies not only enjoy high returns in the bull market cycle, but also achieve capital preservation goals in the bear market cycle where the market
is either sharply or declining.CPPI strategy is a "more and more to buy, more or sell
more" strategyin the magnification of the monitoring range relative to the risk of
assets.Relative to the major investment benchmark of market, the improved CPPI
strategy outperformed the passive index investment strategy during the simulation period, with less volatility.
The corrective measures adopted in this paper include: 1.compulsory dividend or split clause. In the increasing bull market, the proportion of investment in risky assets
should be reduced; 2. Designinvestors' options after the cash-in event. It is the chance
to capture a rebound after the market has dropped sharply; 3. Establish a cash lending mechanism. The reason is that improve the effectiveness of CPPI's strategy under greater risk.
Reference
Electronic Publishing, 2010, 18(3):207-225.
[2]Chen J S, Liao B P. (2007). Nonlinear Goal-Directed CPPI Strategy[M]//
Computational Intelligence in Economics and Finance. Springer Berlin Heidelberg,
2007:857-869.
[3]Joossens E, Schoutens(2015) W. PORTFOLIO INSURANCES, CPPI AND CPDO, TRUTH OR ILLUSION?[J]. Alternative Investments & Strategies, 2015.
[4]Joossens E, Schoutens W. (2015) PORTFOLIO INSURANCES, CPPI AND CPDO, TRUTH OR ILLUSION?[J]. Alternative Investments & Strategies, 2015.
[5]Chen J S, Liao B P. (2007) Piecewise nonlinear goal-directed CPPI strategy[J].
Expert Systems with Applications, 2007, 33(4):857-869.
[6]Moresi S, Reitman D, Salop S C, et al. (2011) Gauging Parallel Accommodating Conduct Concerns with the CPPI[J]. Social Science Electronic Publishing, 2011. [7]Null N. (2009) Efficient Pricing of CPPI using Markov Operators[J]..
[8]Joossens E, Schoutens W.(2010) PORTFOLIO INSURANCES, CPPI AND CPDO, TRUTH OR ILLUSION?[M]// Alternative Investments And Strategies.
2010:259-294.
[9]Schöttle K, Werner R.(2015) ON THE BENEFITS OF ROBUST ASSET ALLOCATION FOR CPPI STRATEGIES[M]// Alternative Investments And
Strategies. 2015:295-326.
[10]Dichtl H, Drobetz W.(2010) On the Popularity of the CPPI Strategy: A
Behavioral-Finance-Based Explanation and Design Recommendations[J]. Journal of