http://www.scirp.org/journal/acs ISSN Online: 2160-0422
ISSN Print: 2160-0414
DOI: 10.4236/acs.2017.74039 Oct. 23, 2017 540 Atmospheric and Climate Sciences
Attenuation of UV-C Solar Radiation as a
Function of Altitude (0
≤
z
≤
100 km): Rayleigh
Diffusion and Photo Dissociation of O
2
Influence
José Luis Pinedo-Vega, Carlos Ríos-Martínez, David Jacobo Navarro-Solís,
J. Ignacio Dávila-Rangel, Fernando Mireles-García, Sonia Azucena Saucedo-Anaya,
Eduardo Manzanares-Acuña, Valentín Badillo-Almaraz
Department: UAEN, Universidad Autónoma de Zacatecas, Zacatecas, Mexico
Abstract
In this paper, we present an analysis of attenuation for UV-C radiation (λ≤290 nm) as a function of the altitude z
(
0≤ ≤z 100 km)
bycalculat-ing the interaction ratio between the UV-C radiation and the molecular spe-cies susceptible of interact with UV-C radiation. The Rayleigh scattering spectral cross sections were calculated, the UV-C spectral cross sections of the species susceptible of interact with UV-C radiation and the UV extra-terrestrial (ETR)solarspectrum were standardized with wavelength steps of 1 nm, and The International Standard Atmosphere model (ISO 1972) was adapted to calculate the molecular density. These data were utilized to cal-culate the photodissociation and Rayleigh scattering ratios as a function of the altitude and to determine to what measure the photodissociation and the Rayleigh diffusion were determinants of the attenuation of UV-C radiation. It became clear that the photo dissociation of O2 is the primordial
mechan-ism of attenuation for the UV-C radiation, but the Rayleigh diffusion ap-pears like a mechanism that encreases the photon flux, raising the perfor-mance of the O2 photodissociation. The attenuation capacities of N2O, CO2
and water vapor (H2O) over the UV-C radiation are all similar, although
smaller (less than 0.6%), and this is due to their low concentration. The O3,
has the theoretical greater attenuation capacity, but it is found in mid-range altitudes
(
15≤ ≤z 40 km)
, where the residual UV-C photons has almostva-nished by O2 photo dissociation or Rayleigh diffusion, so the real effect over
the UV-C attenuation is minimum.
How to cite this paper: Pinedo-Vega, J.L., Ríos-Martínez, C., Navarro-Solís, D.J., Dávi-la-Rangel, J.I., Mireles-García, F., Sauce-do-Anaya, S.A., Manzanares-Acuña, E. and Badillo-Almaraz, V. (2017) Attenuation of UV-C Solar Radiation as a Function of Altitude (0 ≤ z ≤ 100 km): Rayleigh Diffu-sion and Photo Dissociation of O2 Influ-ence. Atmospheric and Climate Sciences, 7, 540-553.
https://doi.org/10.4236/acs.2017.74039
Received: September 15, 2017 Accepted: October 20, 2017 Published: October 23, 2017
Copyright © 2017 by authors and Scientific Research Publishing Inc. This work is licensed under the Creative Commons Attribution International License (CC BY 4.0).
http://creativecommons.org/licenses/by/4.0/
DOI: 10.4236/acs.2017.74039 541 Atmospheric and Climate Sciences
Keywords
UV-C Radiation, Rayleigh Scattering, O2 Photodissociation
1. Introduction
It is well known that UV-C radiation does not reach the surface of the Earth. However, there is no precise knowledge about its spectral attenuation.
The attenuation of UV radiation, in general, is the result of the interaction of the photons with the species or molecules that are susceptible to interact. The photons extinguish themselves upon reacting, transferring their energy to the molecules either causing the breaking of their molecular bonds or the dissocia-tion of the molecule. Due to its nature, this type of interacdissocia-tion is called photo-dissociation.
The spectral photodissociation ratio Rλ
( )
z can be defined as the number ofmolecular photodissociation produced by the solar radiation of each wavelength
λ at any altitude in the atmosphere. This must be proportional to the spectral
photon flow φλ
( )
z and to the molecular density N z( )
of each chemicalspe-cies at z altitude
( )
( ) ( )
Rλ z =φλ z N z σλ (1)
λ
σ known as the cross section, represents the probability of reacting or of
molecular photodissociation which is specific to each wavelength λ for each
molecular species.
The total photodissociation ratio at each altitude z is the integral of the
spectral photodissociation ratio
( )
( )
d( ) ( )
dR z =
∫
Rλ zλ
=∫
φ
λ z N zσ λ
λ (2)The attenuation of the residual spectral photon flux at each altitude z can be
calculated by subtracting the number of reactions of photodissociation from the spectral photon flux at the altitude
z
+
1
( )
z(
z 1)
R z(
1)
λ λ
φ =φ + − + (3)
The initial spectral photon flux φ0λ can be calculated from the spectral irra-diance I0λ received at the top of the atmosphere or ETR spectrum
0 0
I E
λ λ
λ
φ = (4)
where, Eλ=hcλ , is the photon energy, h the Planck constant and c the
speed light in vacuum.
The molecular density at altitude𝑧𝑧 can be expressed in terms of the pressure and the average temperature with the equation
( )
P z N( )
( )
AN z
MRT z
DOI: 10.4236/acs.2017.74039 542 Atmospheric and Climate Sciences
where, 23
6.0221415 10 molecules mol
A
N = × is Avogadro’s number,
3
28.96644 10 kg mol
M = × − is the air molecular weight at TP standard and R
is the specific gas constant R=287.05 J K kg⋅ .
A priori, one can assume, in accordance with hydrostatic law, that the de-crease of the pressure with the altitude is exponential in nature; nevertheless, because of photodissociation reactions, layers in the atmosphere with different temperature gradients λn alternate. The temperature in the stratosphere, for
example, can be characterized through three temperature gradients—the lower one positive, the highest one negative, and an isothermal layer in between—until reaching the mesopause.
The temperature gradients λn have an approximately linear nature in each
layer n of the atmosphere
d
d n
T
z =λ (6)
Through integration, the temperature inside the layer n can be expressed as
( )
n n(
n)
T z =T +λ z−z
where Tn y zn are the temperature and altitude base of each layer.
According to The International Standard Atmosphere, between 0 and 100 km the standard atmosphere is comprised of 8 layers [1].
For a layer with gradient λ ≠n 0, the molecular density is given by
( )
1(
)
n 1g R n n n A n n z z P N N z
M RT T
λ
λ − −
−
= +
(8)
where g is the acceleration due to gravity.
While for one isothermal layer λ =n 0, or one without a temperature gradient the molecular density is given by
( )
e n ( n) g z z T R n A n P N N z M RT − −= (9)
The species susceptible to reacting with UV-C radiation are O2, O3, CO2, H2O
and N2O. The corresponding cross sections are consulted in The MPI-Mainz
UV/VIS Spectral Atlas [2].
The first claim of this paper is to determine to which measure these molecular species are determinant in the attenuation of the UV-C radiation. The region for the study of the attenuation of UV-C radiation is the homosphere
(
0≤ ≤z 100 km)
. The homosphere—the region in which the composition of airand the molecular weight are approximately constant—contains 99.79% of the total mass reported in the atmosphere, and it is also the region where the mole-cular species susceptible to reacting with UV-C radiation reside.
DOI: 10.4236/acs.2017.74039 543 Atmospheric and Climate Sciences
2. Materials and Methods
2.1. ETR Solar Spectrum
The Gueymard extraterrestrial (ETR) spectrum
(
2)
0 W m nm
I λ ⋅ was used, due
to it being the only one found in literature that begins in 0.5 nm. The Gueymard spectrum covers the spectral region from 0.5 nm to 280 nm in 1 nm steps, 280 to 400 nm in 0.5 nm steps, from 400 nm to 1705 nm in 1 nm steps, 5 nm steps from 1705 nm to 4000 nm, and variable steps beyond 4000 nm [3].
The integral of the Gueymard spectrum is equal to 1366.1521372347 W/m2,
which is in the same order as the Solar Constant 2
0 1366.1W m
I = [4]. The
UV-C irradiance is 10.712521 W/m2, representing 0.7841% of the whole solar
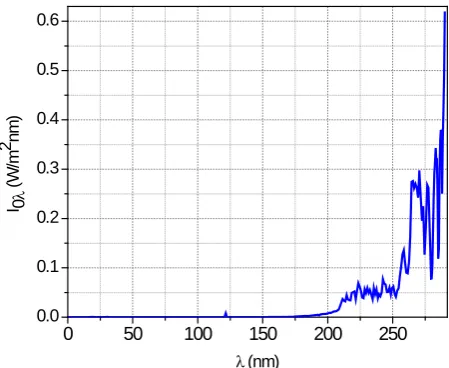
spectrum. In Figure 1 the UV-C region of the Gueymard spectrum is presented. By the Gueymard spectrum having variable wavelength steps, in this paper the spectrum was standardized with wavelength steps of 1 nm centered on multiples of 0.5 nm. The error propagated by this standardization was evaluated by com-paring the integrals of the original and the homologated spectrums. The differ-ence between the original integral of UV-C irradiance and the standardized integral of UV-C irradiance was 0.132 W/m2, which equals a relative error of
0.1272%.
2.2. Cross Sections
In Figure 2 the cross sections of the principal molecular species of the atmos-phere that absorb UV radiation are presented.
The cross section of O2 (black line) extends until 250 nm and given its
con-centration in the atmosphere (0.20953) it is one of the most determinant species in the attenuation of the UV-C radiation between 0 and 244 nm.
Under 150 nm, the most important cross sections are those of N2O and CO2
[image:4.595.261.486.514.698.2](magenta and blue line). Nevertheless, the capacity for attenuation of these spe-cies cannot be too important, due to their low concentrations in the atmosphere
Figure 1. Solar UV-C spectrum. Source: Gueymard (2004).
0 50 100 150 200 250
0.0 0.1 0.2 0.3 0.4 0.5 0.6
I 0λ
(
W/
m
2 nm
)
DOI: 10.4236/acs.2017.74039 544 Atmospheric and Climate Sciences
Figure 2. Cross sections of molecular species in the atmos-phere which are susceptible to reacting with the UV-C radia-tion [2].
(fractions 3.15 × 10⁻⁷ and 4 × 10⁻⁴ respectively) and because in this region the
solar ETR irradiance is only 0.01522 W/m2 (0.14% of UV-C irradiance) (See
Figure 1).
The water vapor cross sections (navy line) are important up until 200 nm, but given their relatively reduced concentration in the troposphere, they also cannot have an important attenuation capacity for the UV-C radiation.
The ozone, for its part (red line), is the only species whose cross sections are important between 200 nm and 300 nm, the region of the spectrum in which the ETR solar irradiance is in the range of 10 W/m2; although its concentration is
relatively reduced (3.5 × 10⁻⁷), the ozone must play a significant role in the
at-tenuation of the UV-C radiation.
2.3. Rayleigh Scattering
Another phenomenon that must influence the attenuation of the radiation UV-C is the Rayleigh scattering or the Rayleigh diffusion.
The Rayleigh scattering theory was proposed at the end of XIX century by John William Strutt (British physicist known like Lord Rayleigh). Using Elec-tromagnetic Theory Rayleigh assumed that the molecules of the air, at being pushed into their excited state by the electromagnetic radiation of the sun, are converted into oscillating dipoles that re-emit the radiation in 4π esterora-dians.
The expression for the Rayleigh scattering cross section σR for standard air
−790 mm Hg, 15°C and containing 300 ppm CO2 is the Penndorf equation [5]
presented like the classic equation in many textbooks (e.g. [6])
( )
(
)
(
)
2 3 2
2 4 2 2
24π 1 6 3
6 7 2
s R
s s n
N n
δ σ λ
δ λ
− +
=
−
− (10)
where ns is the refractive index of air,
19 3
2.54743 10 cm
s
N = × − is the air
0 50 100 150 200 250 300
0.00E+000 2.00E-017 4.00E-017 6.00E-017 8.00E-017 1.00E-016
λ (nm)
DOI: 10.4236/acs.2017.74039 545 Atmospheric and Climate Sciences
molecular standard density, 6 3
6 7 D F δ δ +
= − is the depolarization term or the
King factor and δ is the depolarization factor which describes the effect of
molecular anisotropy.
For the refractive index ns, Peck and Reeder [7] proposed the formula for
300 ppm CO2
(
)
( ) 8300
2 2
2480990 17455.7
1 10 8060.51
1 1 132.274 39.32957 s n
λ
λ
− × = + +− − (11)
Scaling for the desired CO2 concentration in ppm
[image:6.595.247.541.382.695.2](
ns−1)
(CO2)=(
ns−1)
(300)(
1 0.54 CO+(
2−0.0003)
)
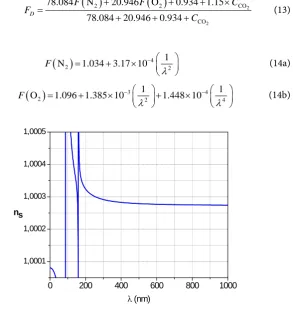
(12)Figure 3 presents the behavior of the refractive index of air ns for 300 and
380 ppm CO2. The numerical differences in the calculation of ns with both
concentrations are so small that the graphics overlap. Discontinuities are ob-served under 160 nm—this simply gives an account of which expressions from Peck and Reeder were deduced for values of λ>200 nm. Thus, the Rayleigh
scattering cross sections are only reliable for wavelengths λ>200 nm.
The King factor depends on air composition and wavelength radiation. Ac-cording to Bates [8]
( )
( )
22
2 2 CO
CO
78.084 N 20.946 O 0.934 1.15
78.084 20.946 0.934
D
F F C
F
C
+ + + ×
=
+ + + (13)
where
( )
42 2
1 N 1.034 3.17 10
F
λ
−
= + ×
(14a)
( )
3 42 2 4
1 1
O 1.096 1.385 10 1.448 10
F
λ λ
− −
= + × + ×
(14b)
Figure 3. Refractive index of air ns for CO2 300 and 380 ppm.
0 200 400 600 800 1000
1,0001 1,0002 1,0003 1,0004 1,0005
λ (nm)
DOI: 10.4236/acs.2017.74039 546 Atmospheric and Climate Sciences
( )
Ar 1F = (14c)
(
CO2)
1.15 [image:7.595.261.486.411.582.2]F = (14d)
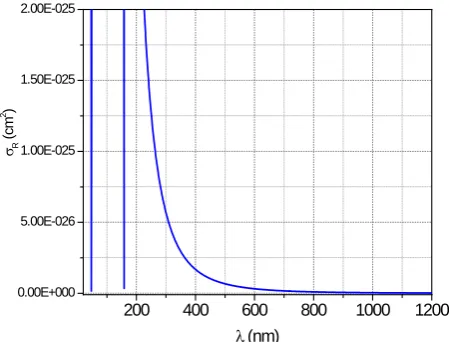
Figure 4 shows the Rayleigh cross sections calculated using the Peck and Reeder refractive index ns and Bates King factor. The discontinuities for
200 nm
λ< reappear.
In Table 1, we present the values of σR reported by Penndorf [5], Bodhain
[9] and Bucholtz [10] as well as the values calculated using the Equations (10)-(14) for the concentrations of CO2 360, 380 and 400 ppm. The differences
between authors are around 10−27 cm2; meanwhile the differences for the
differ-ent concdiffer-entrations of CO2 are around 10−29 cm2. For the purpose of the
calcula-tions of attenuation of UV-C radiation, those minute differences do not cause a great impact.
2.4. Limitations
The spectral cross sections available in literature present important differences between authors and no one author has uniform wavelength steps. It is known that the cross sections vary with temperature, but it was not possible to take into account this dependence, seeing as no data exists that permits taking the gamma temperatures that exist in the atmosphere. The majority of the cross sections used in this work were measured at 298 K, with exceptions of the higher part of the spectrum of O2, whose cross sections were measured at 202 and 243 K, and
[image:7.595.211.540.634.720.2]Figure 4. Rayleigh scattering cross sections.
Table 1. Rayleigh cross section comparison.
( )μm
λ σ λR( )
Penndorf [5] ( )
R σ λ Bodhaine [9]
( )
R σ λ Bucholtz [10]
( )
R σ λ
2
CO =360ppm
( )
R σ λ
2
CO =380pp
( )
R σ λ
2
CO =400ppm
0.250 1.259E−25 1.2610E−25 1.259E−25 1.25707E−25 1.25707E−25 1.25707E−25 0.300 5.642E−26 5.6525E−26 5.642E−26 5.64514E−26 5.64515E−26 5.64516E−26 0.400 1.689E−26 1.6738E−26 1.673E−26 1.67498E−26 1.67498E−26 1.67498E−26
200 400 600 800 1000 1200
0.00E+000 5.00E-026 1.00E-025 1.50E-025 2.00E-025
σR
(
cm
2)
DOI: 10.4236/acs.2017.74039 547 Atmospheric and Climate Sciences
the cross sections of CO2 which were measured at 310 K.
In the case of the ozone, values for the cross sections which are under 110 nm were not found. Nevertheless, under this wavelength the Irradiance is equal to only 0.00517 W/m2, in such a way that the error generated due to the omission
of this region must be very small. In the case of the Rayleigh scattering cross sec-tion the only reliable values are those calculated for wavelength λ>200 nm,
with this in mind the Rayleigh scattering for this wavelength was omitted. The ETR solar spectrum and the cross sections were standardized into wave-lengths through interpolation and/or extrapolation and into wavelength steps of 1 nm were situated values of 0.5 nm. The error generated was evaluated by comparing the integral of the original and homologated spectrums. The relative differences between the integrals under the curve from the reported cross sec-tions and the standardized cross secsec-tions were: in the case of O2: 9.818 × 10⁻⁵, in
the case of the O3: −0.01599; in the case of CO2: 0.040026, in the case of N2O:
5.3782 × 10⁻⁵, and in the case of H
2O: 0.00243.
3. Results
3.1. UV-C Attenuation by the O
2The cross sections of O2 were utilized: Brion [11] from 0 to 120 nm, Ackerman
[12] from 120 to 170 nm, Brion [11] from 170 to 250 and Bogumil [13] from 250 to 444 nm. The molecular density was calculated using Equations (8)-(9) and the degradation of the photons flow was calculated by Equations (3)-(4).
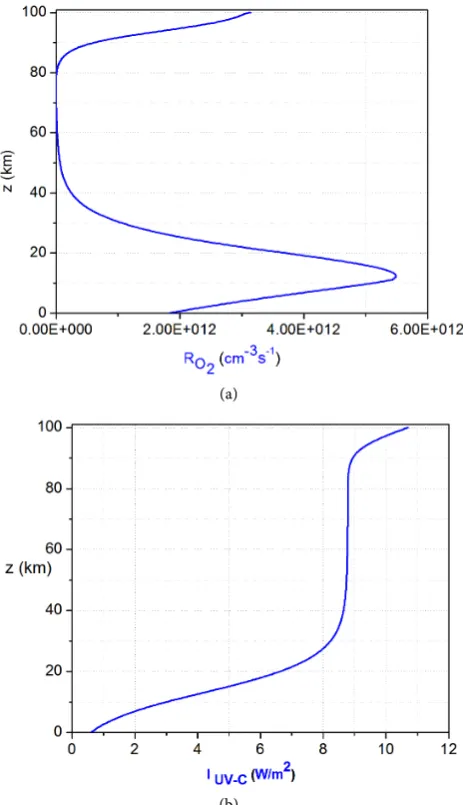
In Figure 5(a) the photodissociation ratio of O2 is presented as a function of
altitude, considering the O2 as the only species that produces attenuation of the
UV-C radiation. Two regions of interaction between the UV-C radiation and O2
molecules are observed, one in the upper layers of the homosphere (z > 80 km), and the other between 0 and 40 km—which is approximately the region in which one would find the distribution of the ozone in the atmosphere.
In Figure 5(b), UV-C Irradiance is presented as a function of the altitude that corresponds to the residual flow of UV-C radiation reacting strictly with the O2.
Between 100 and 80 km, the molecules of O2 only attenuate around 18% of the
UV-C radiation. Between 80 km and 50 km, it is observed that the residual quantity of the UV-C radiation is constant. Left is an irradiance of 8.79 W/m2 of
the 10.71 W/m2 which are produced from the sun. Between 40 and 0 km, the O
2
attenuates another 76.4% of the UV-C irradiance which is composed of lower energy photons. Nevertheless, if the UV-C radiation interacts exclusively with the O2 it would not be able to attenuate completely with the UV-C radiation
given that on the Surface of the Earth (sea-level), a residual irradiance around 0.6 W/m2 (5.6% of the UV-C ETR).
Partial conclusion, the O2 is not the only species that prevents the UV-C
radi-ation from reaching the surface of the Earth.
3.2. UV-C Attenuation by the Rayleigh Diffusion
DOI: 10.4236/acs.2017.74039 548 Atmospheric and Climate Sciences (a)
[image:9.595.258.490.70.473.2](b)
Figure 5. (a) Density of the reactions to the interaction of UV-C radiation and the O2 molecules; (b) Residual irradiance from the UV-C radiation upon reacting with O2 molecules.
the air molecules is presented as a function of the altitude while taking into con-sideration exclusively the Rayleigh Diffusion as the only mechanism for the at-tenuation of the UV-C radiation. In Figure 6(b) eqs. the UV-C Irradiance is presented as a function of the altitude that corresponds to the residual flow of the diffused UV-C radiation. One can observe that the scattering is practically null for greater altitudes and begins to be important only under 40 km. This is
due to the increase of molecular density:
(
)
16 340 km 7 10 cm
N = − and
(
)
19 30 km 2.54 10 cm
N = × − .
If the Rayleigh Diffusion was the only process of attenuation for the UV-C radiation, an irradiance equal to 1.65 W/m2 would manage to reach the surface
DOI: 10.4236/acs.2017.74039 549 Atmospheric and Climate Sciences (a)
[image:10.595.266.485.70.479.2](b)
Figure 6. (a) Density of the reactions of the Rayleigh diffusion with the UV-C radiation; (b) Residual Irradiance of the UV-C radiation due to the Rayleigh diffusion
3.3. UV-C Attenuation by the O
2Considering the Rayleigh
Diffusion
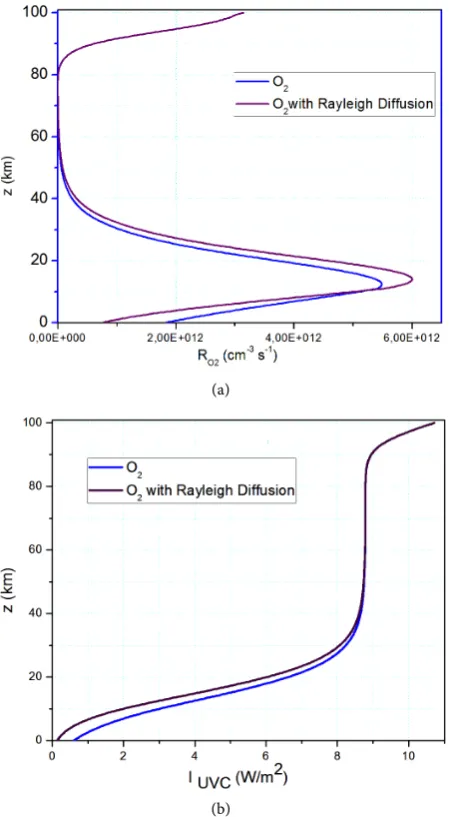
In Figure 7(a) the total photodissociation ratio is presented in between the UV-C radiation and the molecules of O2 as a function of the altitude considering
the Rayleigh diffusion. One can observe that the photodissociation ratio of O2
increases quantitively and rises slightly in altitude; in other words, the Rayleigh diffusion improves the performance of the photodissociations.
In Figure 7(b), the UV-C irradiance is presented as a function of the altitude corresponding to the residual flow of the radiation from the UV-C radiation upon reacting with O2, taking into account the Rayleigh diffusion. The
Irra-diance that reaches the surface of the earth has diminished. From being 0.6 W/m2 without considering Rayleigh diffusion, it diminished to 0.14 W/m2.
DOI: 10.4236/acs.2017.74039 550 Atmospheric and Climate Sciences (a)
[image:11.595.262.487.70.479.2](b)
Figure 7. (a) The densities of the reactions between UV-C radiation and the O2 mole-cules considering the Rayleigh diffusion (violet line) and without considering the Ray-leigh diffusion (blue line); (b) The residual irradiance of the UV-C radiation upon react-ing with the O2 molecules with and without Rayleigh diffusion.
ozone cross sections are important for the upper section of the UV-C range (see
Figure 1).
3.4. Attenuation of the UV Radiation Spectrum: Ozone’s Role in UV
Attenuation
In Figure 8 the degradation of the UV radiation spectrum is presented as a function of the altitude making the molecular dissociation of O2 and O3 and the
Rayleigh diffusion intervene. Between 100 and 80 km, the degradation of the spectrum is imperceptible; however, the spectrum degradation is evident under 40 km. The UV-C range (0≤ ≤λ 290 nm) extinguishes itself completely, this is
DOI: 10.4236/acs.2017.74039 551 Atmospheric and Climate Sciences
Figure 8. UV spectral irradiance for different altitudes, causing the photodissociation of the O2, of the O3, and the Rayleigh diffusion to intervene.
by the Rayleigh diffusion and by the O3.
To simulate the actions of the ozone, a profile of the concentration of the columns of the ozone was taken randomly, characteristic of a region with a value of 238 DU. In fact, it is the ozone that completes the elimination of the residual 0.14 W/m2 of the photodissociation of O
2.
On the other hand, the UV-B range, at ground level (z=0) only leaves 3.0529
W/m2 of the ETR UV-B irradiance (18.6707 W/m2); meanwhile the UV-A
irra-diance only 23.3126 W/m2 at ground level of the ETR UV-A irradiance (83.584
W/m2). This is a good approximation of what goes on.
3.5. UV-C Attenuation by N
2O, CO
2and Water Vapor
Although under the wavelength of 150 nm the cross sections of these molecular species are elevated (Figure 1), due to its low concentration and the fact that the irradiance of the spectrum in this region is very weak, these species are not im-portant in the attenuation of the UV-C radiation. If the attenuation is due to these exclusively, the reduction of the UV-C radiation would be around 0.06 W/m2.
4. Conclusions
Combining the air’s Rayleigh diffusion and photodissociation of O2, the profile
of dissociations of O2 as a function of the altitude was obtained to describe the
attenuation of the UV-C radiation in the atmosphere. This method demonstrates that the dissociations of O2 occur in two regions of the atmosphere. In this
alti-tude, 18% of the UV-C radiation is attenuated through the photodissociation
produced by photons of high energy (λ≤240 nm). These photodissociations
contribute to the elevation in the temperature of the lower part of the ionosphere, but at these altitudes the liberated atoms of oxygen don’t produce molecules
0 100 200 300 400
0.0 0.4 0.8 1.2 1.6
(W
/m
2 n
m)
λ (nm)
DOI: 10.4236/acs.2017.74039 552 Atmospheric and Climate Sciences
from the ozone, which is succinctly due to the low molecular density of O2. The
region where the largest attenuation of the UV-C radiation is produced is dis-tributed between the troposphere and the stratosphere, having maximum grounds for attenuation at 18 km.
The method is not enough achieved because the absence of cross section for the span of temperatures in the atmosphere. Even so it explains why the UV-C doesn’t arrive to the Earth surface givens relevance to the Rayleigh diffusion like a mechanism that encreases the photon flux, raising the performance of the O2
photodissociation.
The profile of the photodissociation ratio of O2 is similar to the conditions for
distribution of O3 in the atmosphere. This permits the explanation that the
ozone resides in the stratosphere because that is where the majority of the pho-todissociation ratio of O2 exists.
Additionally, this paper permits the emphasis that not only the photodissocia-tion of O3 is what contributes to the generation of the temperature gradient in
the stratosphere. In fact, the number of photodissociation of O2 is four times the
number of photodissociation of O3. This is meanwhile the photodissociation
ra-tio of O2 of one column of the atmosphere about 1 cm2 from the surface is
( )
2( )
16 2 12 O
O d 1.48 10 cm s
T
R =
∫
R z z= × − ⋅ −The total number of the photodissociation of O3 is
( )
3( )
15 2 1
3 O
O d 3.64 10 cm s
T
R =
∫
R z z= × − ⋅ −On the other hand, given that 15
3
1 DU=3.64 10 O× molecules per cm2
( )
O3T
R implies the destruction of 0.135 DU of O3 per second.
References
[1] ISO Standard Atmosphere (1972) Standard Atmosphere, International Organiza-tion for StandardizaOrganiza-tion, InternaOrganiza-tional Standard ISO 2533.
[2] Keller-Rudek, H., Moortgat, G.K., Sander R., Sörensen R. (2017) Atlas of Gaseous Molecules of Atmospheric Interest, The MPI-Mainz UV/VIS Spectral, On Line: http://www.uv-vis-spectral-atlas-mainz.org/ (Accessed on 02 06 2017).
[3] Gueymard, C.A. (2004) The Sun’s Total and Spectral Irradiance for Solar Energy Applications and Solar Radiation Models. Solar Energy, 76, 423-453.
[4] Johnson, C.W. (2017) The Solar Constant of the Planets and The Earth/MatriX Temperature Scale, Earth/MatiX, SCIENCE IN ANCIENT ARTWORK AND SCIENCE TODAY, On line:
http://em01.powweb.com/sciencetoday/solar_constants_%20planets.html (Accessed on 03 04 2017).
[5] Penndorf, R. (1957) Tables of the Refractive Index for Standard Air and the Ray-leigh Scattering Coefficient for the Spectral Region between 0.2 and 20.0 m and Their Application to Atmospheric Optics. Journal of the Optical Society of America, 47, 176-182.https://doi.org/10.1364/JOSA.47.000176
DOI: 10.4236/acs.2017.74039 553 Atmospheric and Climate Sciences [7] Peck, E.D. and Reeder, K. (1972) Dispersion of Air. Journal of the Optical Society of
America, 62, 952.https://doi.org/10.1364/JOSA.62.000958
[8] Bates, D.R. (1984) Rayleigh Scattering by Air. Planetary and Space Science, 32, 785-790.
[9] Bodhaine, B.A., Wood, N.B., Dutton, E.G. and Slusser, J.R. (1999) On Rayleigh
Optical Depth Calculations. Journal of Atmospheric and Oceanic Technology, 16, 1854-1871.https://doi.org/10.1175/1520-0426(1999)016<1854:ORODC>2.0.CO;2 [10] Bucholtz, A. (1995) Rayleigh-Scattering Calculations for the Terrestrial
Atmos-phere. Applied Optics, 34, 2765-2773.https://doi.org/10.1364/AO.34.002765 [11] Brion, C.E., Tan, K.H., van der Wiel, M.J. and van der Leeuw, P.E. (1979) Dipole
Oscillator-Strengths for the Photoabsorption, Photoionization and Fragmentation of Molecular Oxygen. Journal of Electron Spectroscopy and Related Phenomena, 17, 101-119.
[12] Ackerman, M. (1971) UV-Solar Radiation Related to Mesospheric Processes. In: Fiocco, G., Ed., Mesospheric Models and Related Experiments, D. Reidel Publishing Company, Dordrecht, 149-159.https://doi.org/10.1007/978-94-010-3114-1_11 [13] Bogumil, K., Orphal, J., Homann, T., Voigt, S., Spietz, P., Fleischmann, O.C., Vogel,
![Figure 2. Cross sections of molecular species in the atmos-phere which are susceptible to reacting with the UV-C radia-tion [2]](https://thumb-us.123doks.com/thumbv2/123dok_us/82876.508604/5.595.264.481.71.236/figure-cross-sections-molecular-species-atmos-susceptible-reacting.webp)