The Impact of Public Governance on
Household Income: A Quantile Panel
Analysis
Quang Tran, Tuyen and Doan, Tinh and Vu, Huong and
Nguyen, Hien
2 January 2018
Online at
https://mpra.ub.uni-muenchen.de/90415/
1
The Impact of Public Governance on Household Income: A
Quantile Panel Analysis
Tuyen Quang Tran
(corresponding author)
University of Economics and Business, Vietnam National University, Hanoi,
Room 100, Building E4, No. 144, Xuan Thuy Street, Cau Giay District, Hanoi, VietnamEmail: tuyentq@vnu.edu.vn; tuyentranquang1973@gmail.com
Tinh Doan
University of Economics and Business, Vietnam National University, Hanoi,
and the University of Waikato, New Zealand
Huong Van Vu
Department of Economics, Academy of Finance, Hanoi, Vietnam and the
University of Waikato, New Zealand
Hien Nguyen
International Labour Organization, Bangkok, Thailand
Acknowledgements
This research is funded by Vietnam National Foundation for Science and Technology Development (NAFOSTED) under grant number 502.99-2015.10
Compliance with Ethical Standards
The authors declare that they have no conflict of interest in this research
2
Abstract
This study investigated the role of provincial governance on the growth of per capita income of Vietnamese households, using a balanced panel dataset for the period 2012-2014. Whereas we found no evidence for the influence of provincial governance when a linear fixed-effect regression estimator was used, the results from a fixed-effect quantile regression estimator reveal that provincial governance has a positive effect on several groups (but not the poorest) and the effect tends to be greater for better-off households. In addition, we find that wage employment plays a larger role in the income growth of poorer households, while returns on education are higher for richer households. The findings suggest that a mean regression approach that looks only at the role of explanatory variables on mean household welfare and does not consider differences in the distribution of household welfare, may miss some heterogeneity that is of interest to policy makers.
Keywords: fixed-effect quantile regression; household welfare; public governance; policy makers.
3
1. Introduction
Launched in 1986, the economic and political reforms known as “Đổi Mới” boosted economic growth and transformed Vietnam from one of the world’s poorest nations into a lower middle-income country by 2010 (World Bank [WB] & Ministry of Planning and Investment [MPI], 2016). The proportion of the Vietnamese population remaining below the national poverty line (GSO-WB Poverty line) dropped from about 60% in 1993 to 13.5% in 2014 (WB, 2017). More than 40 million people were moved out of poverty over the course of two decades (WB, 2013).
In addition, Vietnam has made significant advances in other dimensions of well-being, ranging from high primary and secondary school enrolments to improvements in health status and reduced morbidity and mortality. Thus, the country has achieved, and in some cases surpassed, many of the Millennium Development Goals (MDGs) (WB, 2013).
Numerous studies have examined the contribution of various factors to household welfare in Vietnam. In general, these studies often examine the role of distinguishing household characteristics or assets (land, migration, access to credit, nonfarm participation) (Nguyen & Daniel, 2012; Nguyen & Marrit, 2014; Nguyen & Tran, 2013; Pfau & Giang, 2009; Ravallion & Van de Walle, 2008) and community characteristics (infrastructure, natural and geographic conditions) (Bui, Dungey, Nguyen, & Pham, 2014; Tran, Nguyen, Van, & Nguyen, 2015) in improving household welfare. Public governance can have a significant influence on the living standard of local people (Attride, 2002; Sáez, 2013) and in Vietnam, ensuring good governance is considered a prerequisite for reducing poverty and improving household welfare (Jairo, Nguyen, Tran, & Phung, 2015). To date, however, little is known about the role of local government in improving household welfare in Vietnam.
4
attempt to apply micro-econometrics to investigate the role of provincial governance in the growth of household income in Vietnam.
Our study has several strong points. First, using a balanced panel data set with fixed effect regression models allows us to control for unobservable household and province-specific effects which are invariant over time and can affect a household's income. Second, existing studies often investigate only the effect of public governance or institutions on household welfare at the mean using a mean regression approach (e.g., ordinary least squares or fixed/random effects estimators). This approach, however, may not capture heterogeneous effects, possibly because these may differ across points on the outcome distribution of households.
To address this issue, our study applied a fixed-effect quantile regression model to consider the role of provincial governance at various points in the conditional distribution of household welfare. Whereas we found no evidence for the influence of provincial governance when a linear fixed-effect regression estimator was used, the results from a fixed-effect quantile regression estimator reveal that provincial governance has a positive effect on some quantiles considered but the effect seems to be greater for better-off households. The findings suggest that a mean regression approach that does not consider differences in the distribution of household welfare, may miss some heterogeneity of interest to policy makers.
2. Theoretical and Empirical Evidence
5
Institutionalists Krueger (1974) and North (1994, 1995) pointed out that good governance reduces transaction costs for economic activities. Stiglitz (2002) and other New-Keynesians indicated that transparent legal frameworks and clear tax policies enable the market to function effectively. According to Eric, Chetwynd, and Spector (2003), two theoretical models emerge from the research literature and explain the role of good public governance in improving income and poverty reduction.
The “economic model” postulates that good public governance increases economic investment, reduces market distortions, promotes competition, and improves efficiencies by reducing the cost of doing business. In turn, these encourage economic growth and poverty reduction.
The “governance model,” on the other hand, asserts that good public governance improves the institutional capacity of government to deliver quality public services, increase public investment in major public demands, enhance compliance with safety and health regulations, and reduce budgetary pressures on government. Good public governance, in turn, increases social capital and public trust in governmental institutions, and expands public resources available to implement effective economic development programs, enhancing the capability of government to help its citizens, particularly the poor. Thus, improving governance, at both national and international levels, is important for the development of poor countries (Brinkerhoff, 2008). There is also increasing consensus that good governance is vital for human development (UNDP, 2011a).
The relationship between governance, public administration and development progress has been a main concern in the research on developing countries (Jairo et al., 2015). In consequence of the presence of comparable units of analysis, most large-scale studies that utilize econometric and statistical methods use national-level data to examine the effect of key governance variables on development progress. On the macro level, any study of governance as a unit of analysis initially focuses narrowly on the association between governance and economic growth (Sáez, 2013). Seminal work by Barro (1991) employed a cross-national study to regress economic growth on a number of country characteristics (e.g., government consumption expenditure, public investment in education, and political instability). The main finding from this study was that political instability and a high ratio of government consumption expenditure to GDP had a negative effect on income growth.
6
illiteracy rate. Governance is measured by a set of institutional factors: (i) accountability; (ii) a strong civil society; (iii) bureaucratic quality; (iv) rule of law. In their study, ordinary least squares regression (OLS) models were used with the data from a sample of 21 Latin American countries (LACs) and 8 Southeast and East Asian countries (SEACs).1 The regression results
show that the last three indicators are positively associated with the real per capita income for the whole sample. However, looking at each region, only the strong civil society factor has a positive relationship with income per capita in the SEACs, while only bureaucratic quality and the rule of law have a positive linkage with per capita income in LACs. Similar findings were also observed for the case of infant mortality and illiteracy rates. The results suggest that the relationship between governance and development progress might be different across regions and countries.
Hasan, Mitra, and Ulubasoglu (2007) re-examined the association between poverty and institutions to test if governance, political freedom, and the ease of doing business, among other indicators of institutions, affect cross-country poverty rates. Their main finding was that good governance, as measured by a strong commitment to the rule of law, among other measures, matters for poverty reduction, mainly through its influence on economic growth. Though not a panacea, less cumbersome regulations governing private sector operations, especially those pertaining to starting a business, can directly affect economic growth as well as poverty reduction. In addition, their study finds that political freedom is not linked with either higher growth or lower poverty. Combined, the findings imply that good governance and regulations supporting the establishment of new firms are more relevant for growth and poverty reduction than the nature of the political system.
Haq, Zia, and Arif (2006) examined whether there was an association between good governance and pro-poor growth in Pakistan from 1996 to 2005. The authors employed three broad indicators of governance: (i) political governance (i.e., voice and accountability, political instability and violence); (ii) economic governance (i.e., government effectiveness and regulatory quality); and (iii) institutional dimensions of governance (i.e., rule of law, control of corruption). Haq et al. (2006) investigated the relationship between governance and poverty (as well as governance and income inequality) using simple ordinary least squares (OLS) regressions. Their main finding is that voice, accountability, and political stability are negatively and significantly associated with poverty. By combining macro data (states) and
1 Socialist and transitioning nations, such as China, Cuba, Lao People’s Democratic Republic and Viet
7
micro data (child poverty) with multilevel regression models, Daoud (2015) investigated the association between the quality of local governance and absolute child poverty across states in India. His study found that controlling for all other factors, households living in a state with better local governance were more likely to escape child poverty, while those living in a state with more corruption were more likely to suffer from child poverty.
Substantial gaps in the quality of governance and institutions and in economic development across provinces have inspired few studies using provincial data levels in Vietnam to test if the quality of governance is associated with the living standard of the population. For instance, there is a positive association between the Human Development Index (HDI) and the Public Administration Performance Index (PAPI) (UNDP, 2011b). Ha and Hanh (2013) also found that provincial governance (PCI and PAPI) can have a positive effect on GDP per capita at the provincial level. It should be noted, however, that using aggregate data, cross-province studies are likely to provide biased estimates because of their failure to control for the heterogeneity of household characteristics (Blundell & Stoker, 2005). As these writers have noted (Blundell & Stoker, p. 3), “for any application, a model must be specified which captures all important economic effects, allows for relevant individual heterogeneity, and bridges the gap between individual and aggregate, facilitating analysis at both levels.” In the current study, we applied a micro-econometric approach with a balanced panel data set to examine the role of provincial governance in improving household welfare, accounting for heterogeneity in household characteristics.
3. Data and Method
3.1. Data
8
Table 1
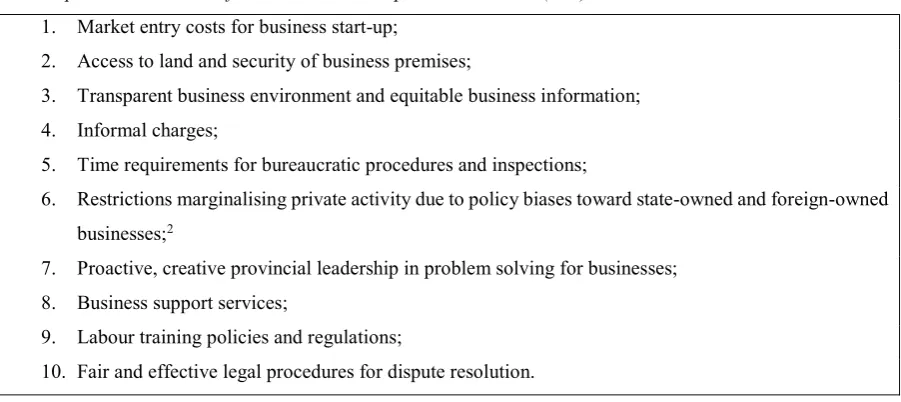
Ten Composite Sub-Indices of the Provincial Competitiveness Index (PCI) 1. Market entry costs for business start-up;
2. Access to land and security of business premises;
3. Transparent business environment and equitable business information; 4. Informal charges;
5. Time requirements for bureaucratic procedures and inspections;
6. Restrictions marginalising private activity due to policy biases toward state-owned and foreign-owned businesses;2
7. Proactive, creative provincial leadership in problem solving for businesses; 8. Business support services;
9. Labour training policies and regulations;
10. Fair and effective legal procedures for dispute resolution.
Source: (VCCI & USAID, 2016).
In this study, the quality of provincial governance is measured by the Provincial Competitiveness Index (PCI), an aggregate performance indicator that evaluates and ranks the quality of economic governance by provincial authorities in creating a favourable business environment for the development of the private sector (Table 1). The PCI has been collected annually by the Vietnam Chamber of Commerce and Industry (VCCI) since 2007 with support from USAID.3 The survey covers all 63 provinces in Vietnam. Briefly, the PCI methodology
was conducted in a three-step sequence: (i) gather data from business surveys and published documents, (ii) compute ten sub-indices and standardize to a 10-point scale, and (iii) adjust the composite PCI as the weighted mean of nine sub-indices with a maximum score of 100 points (VCCI & USAID, 2016). The combination of the VHLSSs and PCI surveys offers a unique household-provincial level panel dataset. This balanced panel dataset enables us to measure the impact of provincial governance on the growth of household income, accounting for household characteristics at the household level.
3.2. Model specifications
Since household income is considered to be one of the standard measures of household economic welfare (Deaton, 1997), household welfare is measured by household per capita income in the current study. We assume household welfare is a reduced function of provincial governance and of household characteristics, as follows:
2 This sub-index was even mentioned in the PCI’s official documentation but there is no data available on
their website to download, so in this study we use the overall PCI.
3 For the sampling and methodology of the survey, see
9
0 1 2 3
ij
y t
Xijt
PCIjt
Yeart
uij
ijt (1)where yijt is the annual per capita income of household i in province j in the year t; Xijtis a
vector of household distinguishing characteristics, such as demographic variables and assets;
jt
PCI is the measurement of the quality of public governance at province j; Yeart is the dummy variable of the year 2014. In equation (1), unobserved variables are decomposed into time invariant component uij4, and time-variant component ijt
.
Equation (1) was estimated usinga fixed-effect estimator with a balanced panel dataset of households and the PCI in 2012 and 2014. This approach allows the researcher to remove the influence of time-invariant unobservable regional, household and individual characteristics that can affect household welfare (Cameron & Trivedi, 2005).According to Wooldridge (2013), with the assumption of strict exogeneity for the explanatory variables, using a fixed effect estimator in equation (1) yields unbiased estimates. Broadly speaking, the idiosyncratic error ijtshould be uncorrelated
with each explanatory variable across all time periods.
A mean approach using standard linear regression techniques (e.g., ordinary least squares or fixed/random effects estimators) provides a methodology commonly used for considering the influence of public governance or institution on household welfare or development indicators (e.g., Azfar & Gurgur, 2008; Barro, 1991; Campos & Nugent, 1999; Hasan et al., 2007; Sáez, 2013). The mean approach looks at the average relationship between governance and household welfare based on the conditional mean of the outcome distribution.
This gives us only a partial view of the relationship. However, quantile regression enables us to examine the relationship at different points in the conditional distribution of household welfare (Buchinsky, 1994).
Several studies (e.g., Dollar & Kraay, 2002; Li, Squire, & Zou, 1998) found a public governance heterogeneous effect across levels of development. Thus, we employed a fixed effects quantile regression estimator to test whether the effect of provincial governance quality differs for households with varying levels of household per capita income. The quantile estimator also provides a richer characterization of the data, allowing us to study the effect of
4 The variable
ij
10
the quality of public governance on the entire distribution of household welfare, not merely its conditional mean (Koenker & Hallock, 2001). In addition, a quantile regression estimator is more robust to non-normal errors and outliers, while a linear regression estimator can suffer from inefficiency if the errors are highly abnormal (Koenker, 2005; Ha & Tran, 2017).
In the current study, we applied Canay’s method (2011) to estimate a fixed-effect quantile regression model. First, the conditional mean of ˆuij is estimated from equation (1)
using a fixed effects estimator. Second, a new dependent variable is computed as the difference between the original dependent variable and ˆuij
:
yijt=
yijt-
uˆij.
Finally, a fixed-effects quantileregression estimator was estimated for equation (2), where denotes the corresponding quantiles of dependent variables. Standard errors are estimated using bootstrap techniques with 1,000 replications. Under certain assumptions discussed in Canay (2011), this estimator is asymptotically consistent.
yij
Quantile t
Xijt
PCIjt
Yeart
(2)
4. Results and Discussion
4.1. Background information on household characteristics and provincial governance
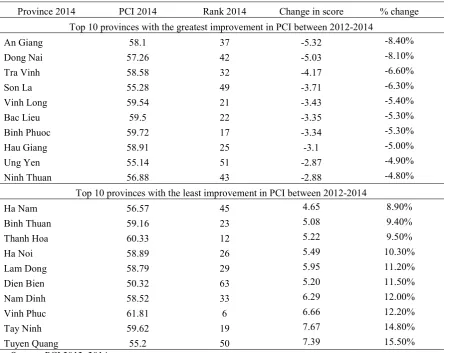
[image:11.595.75.543.683.729.2]This section provides some basic information about key variables used in the estimation. On average, there is an overall improvement in PCI with scores from 58 to 59.3 over the study period (Table 2). Table 3 indicates the top 10 provinces with the highest achievement in improving the PCI over the period 2012-2014. It also lists the 10 provinces that showed the lowest improvement in the PCI over the same period. Tuyen Quang province’s PCI increased by about 15.5% (7.4) while that of An Giang province declined by 8.4% (-5.3). The PCI data show that some provinces have high PCI scores while others are skewed to the left of the score distribution (Figure 1). Some provinces improved their scores even though their score was still relatively lower than that of others.
Table 2
Weighted Mean of PCI Sub-Indices for Wage Earning Sample Year Entry
cost access Land parency Trans- Time cost Informal charge Bias Proactive Business support training Labour Legal PCI
2012 8.66 6.34 5.87 5.82 6.55 NA 4.65 4.26 5.22 3.65 57.9
2014 8.10 5.64 6.21 6.46 5.10 5.02 4.39 5.93 6.24 5.62 59.3
11
Figure 1: Distribution of PCI between 2012-2014.Source: Authors’ calculation from PCI 2012, 2014.
Table 3
Provinces Showing Greatest and Smallest Improvement in PCI Between 2012-2014
Province 2014 PCI 2014 Rank 2014 Change in score % change Top 10 provinces with the greatest improvement in PCI between 2012-2014
An Giang 58.1 37 -5.32 -8.40%
Dong Nai 57.26 42 -5.03 -8.10%
Tra Vinh 58.58 32 -4.17 -6.60%
Son La 55.28 49 -3.71 -6.30%
Vinh Long 59.54 21 -3.43 -5.40%
Bac Lieu 59.5 22 -3.35 -5.30%
Binh Phuoc 59.72 17 -3.34 -5.30%
Hau Giang 58.91 25 -3.1 -5.00%
Ung Yen 55.14 51 -2.87 -4.90%
Ninh Thuan 56.88 43 -2.88 -4.80%
Top 10 provinces with the least improvement in PCI between 2012-2014
Ha Nam 56.57 45 4.65 8.90%
Binh Thuan 59.16 23 5.08 9.40%
Thanh Hoa 60.33 12 5.22 9.50%
Ha Noi 58.89 26 5.49 10.30%
Lam Dong 58.79 29 5.95 11.20%
Dien Bien 50.32 63 5.20 11.50%
Nam Dinh 58.52 33 6.29 12.00%
Vinh Phuc 61.81 6 6.66 12.20%
Tay Ninh 59.62 19 7.67 14.80%
Tuyen Quang 55.2 50 7.39 15.50%
Source: PCI 2012, 2014.
0
.0
5
.1
.1
5
.2
D
en
si
ty
45 50 55 60 65
PCI 2012
0
.1
.2
.3
.4
D
en
si
ty
50 55 60 65 70
[image:12.595.76.526.376.729.2]12
Table 4
Statistical Summary of Key Variables Used in the Estimation
Year 2012 2014
Variables Mean Std. Dev. Mean Std. Dev. Quality of provincial governance
Provincial competitiveness index (score) 57.07 3.99 58.33 3.00 Household welfare
Annual household per capita income (in thousands of
VND) 24,420 25,156 30,168 33,680
Poverty incidence (1=yes; 0 otherwise) 0.09 0.29 0.08 0.27 Poverty gap (percentage of income shortfall relative to the
poverty line) 0.02 0.08 0.02 0.08
Household characteristics Gender of household head
(1=male; 0=female) 0.76 0.43 0.75 0.43
Age of household head (years) 49.87 14.03 51.36 13.85 Ethnicity of household head (1=major; 0=minor) 0.83 0.38 0.83 0.37 Marital status of household head (1=married;
0=unmarried) 0.98 0.15 0.98 0.15
Household head, years of schooling (years) 8.18 4.04 8.20 4.02 Household size (number of household members) 3.93 1.53 3.84 1.59 Dependency ratio (number of dependents in the
household)a 0.35 0.29 0.36 0.30
Wage employment (1 if the household has wage income;
0=no wage income) 0.67 0.47 0.67 0.47
Nonfarm self-employment (1 if the household has
nonfarm-self-employment income; 0=not) 0.33 0.47 0.33 0.47 Land holding per household
Cropland, annual (m2) 2,887 6,108 2,895 6,776
Cropland, perennial (m2) 1,054 4,319 1,128 5,157
Forestry land (m2) 1,544 10,442 1,558 13,117
Regions (% of households in each region)
Urban (1=urban; 0=rural) 0.29 0.30
Red River Delta (1=yes; 0 otherwise) 0.20 0.20
East Northern Mountains (1=yes; 0 otherwise) 0.13 0.13 West Northern Mountains (1=yes; 0 otherwise) 0.07 0.07 North Central Coast (1=yes; 0 otherwise) 0.11 0.11 South Central Coast (1=yes; 0 otherwise) 0.09 0.09
Central Highlands (1=yes; 0 otherwise) 0.07 0.07
Southeast (1=yes; 0 otherwise) 0.14 0.14
Mekong Delta (1=yes; 0 otherwise) 0.20 0.20
Observations 4169 4152
Note a: Dependents include young dependents (under 15) and old dependents (women over 59 and men
over 64). Average exchange rate (USD/VND) was 20,919 in 2012 and 21,259 in 2014.
Source: Authors’ calculation from VHLSS 2012-2014 and PCI 2012-2014. The poverty rate was estimated using the official poverty line 2012-2014 (GSO, 2015).
13
estimated with observations from 63 provinces. The data indicate that on average, each household member earned about 2,035 thousand Vietnamese dong (VND) per month in 2012 and 2,514 thousand VND per month in 2014. The poverty head count index (poverty rate) also decreased from about 9% in 2012 to around 8% in 2012, while the poverty gap remained almost unchanged. The sample data reveal that about 30% of households live in urban areas while 70% live in rural areas. Most households lived in the Red River Delta and the Southeast region, accounting for about 40% of the total sample.
The poorest region is located in the West Northern Mountains, with monthly per capita income being estimated at about 1,134 thousand VND in 2012 and 1,660 thousand VND in 2014. Households living in the Southeast region are the richest, with per capita income at about 2,650 thousand VND per month and around 3,400 thousand VND in 2012 and 2014, respectively. On average, each household member in urban areas earned about 2,094 thousand VND in 2012 and 3,500 thousand VND in 2014, whereas each household member in rural areas earned only about 1,660 thousand VND and 2,080 thousand VND for the same period.
3.2. Determinants of household welfare
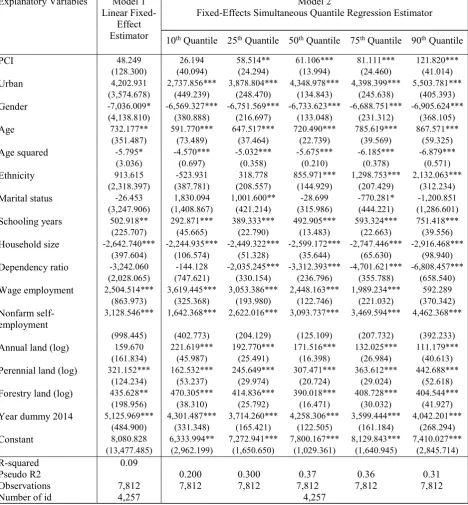
Model 1 in Table 5 reports the results from the income model using a fixed-effect estimator. It shows that the size of the PCI coefficient is about 48 thousand Vietnamese Dong (VND), not statistically significant at the conventional level of 10% (p-value =0.71). Thus, we can conclude that there is no evidence to support the hypothesis that the quality of provincial governance affects per capita income at the mean. A different picture emerged, however, when a fixed-effect quantile regression model was applied. As can be seen in Model 2 and Figure 2, local governance has a positive and statistically significant effect on household per capita income for all quantiles except the tenth.
The effect is heterogeneous across the quantiles considered, however, and tends to be larger for households with per capita income above the median. Specifically, holding all other factors constant, an increase of one point in the PCI would lead to an increase of 60 thousand VND in annual per capita income for those at the median. The corresponding figures for those at the 75th and 90th quantiles are about 81 thousand VND and 122 thousand VND, respectively. These
14
[image:15.595.73.528.187.448.2]Interestingly, our research finding reveals that the quality of local governance plays a larger role in the income growth of richer households. The greater impact of provincial governance on richer households may be explained by the fact that better-off households have more resources with which to seize economic opportunities provided by improvement in local economic governance, which in turn can lead to higher income growth.
Figure 2: Slope and 90% coefficient intervals for quantile treatment regression. Source: authors’ calculation from the VHLSSs and the PCI 2012-2014.
Note: Figure 2 reflects the varying effects of provincial governance on per capita income across different points in the distribution of income and also indicates that the effect is greater for better-off households.
Household size had a negative effect on per capita income in both models in Table 5. This finding is in line with several studies in rural Honduras (Jansen, Pender, Damon, Wielemaker, & Schipper, 2006) and peri-urban Vietnam (Tran, Lim, Cameron, & Van, 2014), which show that having more dependent members, and more family members in general, seems to reduce per capita income. Keeping all other variables constant, Model 1 shows that an additional family member results in a decrease in annual per capita income of about 2,643 thousand VND. The positive sign of the age of the household head and the negative sign of its squared term suggest that the age of the household head has a diminishing impact on per capita income.
-5
0.
00
0.
00
50
.0
0
10
0.
00
15
0.
00
20
0.
00
Pr
ov
in
ci
al
g
ov
er
na
nc
e
im
pa
ct
0 .2 .4 .6 .8 1
Quantile
Quantile Impact 90% lower CI
90% upper CI OLS impact
15
Table 5
Determinants of Household per Capita Income
Explanatory Variables Model 1 Linear
Fixed-Effect Estimator
Model 2
Fixed-Effects Simultaneous Quantile Regression Estimator
10th Quantile 25th Quantile 50th Quantile 75th Quantile 90th Quantile
PCI 48.249 26.194 58.514** 61.106*** 81.111*** 121.820***
(128.300) (40.094) (24.294) (13.994) (24.460) (41.014)
Urban 4,202.931 2,737.856*** 3,878.804*** 4,348.978*** 4,398.399*** 5,503.781***
(3,574.678) (449.239) (248.470) (134.843) (245.638) (405.393)
Gender -7,036.009* -6,569.327*** -6,751.569*** -6,733.623*** -6,688.751*** -6,905.624***
(4,138.810) (380.888) (216.697) (133.048) (231.312) (368.105)
Age 732.177** 591.770*** 647.517*** 720.490*** 785.619*** 867.571***
(351.487) (73.489) (37.464) (22.739) (39.569) (59.325)
Age squared -5.795* -4.570*** -5.032*** -5.675*** -6.185*** -6.879***
(3.036) (0.697) (0.358) (0.210) (0.378) (0.571)
Ethnicity 913.615 -523.931 318.778 855.971*** 1,298.753*** 2,132.063***
(2,318.397) (387.781) (208.557) (144.929) (207.429) (312.234)
Marital status -26.453 1,830.094 1,001.600** -28.699 -770.281* -1,200.851
(3,247.906) (1,408.867) (421.214) (315.986) (444.221) (1,286.601)
Schooling years 502.918** 292.871*** 389.333*** 492.905*** 593.324*** 751.418***
(225.707) (45.665) (22.790) (13.483) (22.663) (39.556)
Household size -2,642.740*** -2,244.935*** -2,449.322*** -2,599.172*** -2,747.446*** -2,916.468***
(397.604) (106.574) (51.328) (35.644) (65.630) (98.940)
Dependency ratio -3,242.060 -144.128 -2,035.245*** -3,312.393*** -4,701.621*** -6,808.457***
(2,028.065) (747.621) (330.154) (236.796) (355.788) (658.540)
Wage employment 2,504.514*** 3,619.445*** 3,053.386*** 2,448.163*** 1,989.234*** 592.289
(863.973) (325.368) (193.980) (122.746) (221.032) (370.342)
Nonfarm
self-employment 3,128.546*** 1,642.368*** 2,622.016*** 3,093.737*** 3,469.594*** 4,462.368***
(998.445) (402.773) (204.129) (125.109) (207.732) (392.233)
Annual land (log) 159.670 221.619*** 192.770*** 171.516*** 132.025*** 111.179***
(161.834) (45.987) (25.491) (16.398) (26.984) (40.613)
Perennial land (log) 321.152*** 162.532*** 245.649*** 307.471*** 363.612*** 442.688***
(124.234) (53.237) (29.974) (20.724) (29.024) (52.618)
Forestry land (log) 435.628** 470.305*** 414.836*** 390.018*** 408.728*** 404.544***
(198.956) (38.310) (25.792) (16.471) (30.032) (41.927)
Year dummy 2014 5,125.969*** 4,301.487*** 3,714.260*** 4,258.306*** 3,599.444*** 4,042.201***
(484.900) (331.348) (165.421) (122.505) (161.184) (268.294)
Constant 8,080.828 6,333.994** 7,272.941*** 7,800.167*** 8,129.843*** 7,410.027***
(13,477.485) (2,962.199) (1,650.650) (1,029.361) (1,640.945) (2,845.714)
R-squared 0.09
Pseudo R2 0.200 0.300 0.37 0.36 0.31
Observations 7,812 7,812 7,812 7,812 7,812 7,812
Number of id 4,257 4,257
Note: * significant at 10%; ** significant at 5%; *** significant at 1%. Robust standard errors in parentheses in Model 1 and bootstrapped standard errors in parentheses in Model 2. Log stands for natural logarithm.
16
conclusion of many studies from other parts of the world that indicate that female-led households are poorer than male-led households (Oginni, Ahonsi, & Ukwuije, 2013).
In both models, we found that the education of the household head had an increasing effect on per capita income. Keeping all other factors constant, Model 1 shows that on average, an additional year of schooling would raise per capita income by about 500 thousand VND. This result accords with recent findings in Vietnam (Doan, Le, & Tran, 2016; Tran, 2015b; Tran et al., 2014). Nevertheless, the estimates in Model 2 show that the effect tends to be greater for higher quantiles, suggesting that the return on education is higher for better-off households.
The results from the fixed effect estimator indicate that nonfarm participation has a positive effect on household income. As shown in Model 1, Table 5, the coefficient of wage employment indicates that on average, keeping all other variables constant, households that took up wage employment would have a per capita income level 2,500 thousand VND higher than those without wage employment. The corresponding figures for those with nonfarm self-employment were 3,130 thousand VND. In general, this finding also accords with that of Pham, Anh Tuan, and Thanh (2010) and Tran (2015a) in Vietnam and other developing countries (Rigg, 2006). Interestingly, the results from the fixed effects quantile regression estimator suggest that the influence of nonfarm participation on household income differs across the percentiles. Specifically, the effect of wage employment tends to be greater for poorer households, while nonfarm self-employment seems to contribute more income for richer households. This heterogeneity effect, however, might not be found by using a mean regression approach.
17
4. Concluding Remarks
In this study, we examine the effect of the quality of provincial governance on household welfare, using a balanced panel data set from VHLSSs and the PCI in 2012 and 2014. The quality of provincial governance is measured by the Provincial Competitiveness Index, while household welfare is proxied by household per capita income. Both fixed effect and quantile fixed effect regression estimators were used to investigate the impact of provincial governance on household welfare. This approach allowed us to consider the role of local governance on the entire distribution of household welfare, not merely its conditional mean. Using fixed-effect regression estimators also enabled us to minimize endogeneity bias by controlling for unobserved and time-invariant factors that can affect household welfare.
We find no evidence for the impact of provincial governance on household welfare when a linear fixed-effect regression model is used. In contrast, we find a positive effect of provincial governance on household welfare at some points in the distribution of per capita income. Interestingly, the effect differs substantially across quantiles and is higher for quantiles above the median. Thus, the finding implies that good governance tends to provide greater benefits to richer households than to other groups. While we remain aware of the difficulties of definitively establishing causation between governance and household welfare, the strength of our findings is supportive of a link. The established literature discusses numerous channels through which good governance can affect household welfare. In our study, the greater effect on richer households may be explained by the fact that these households owned more resources, enabling them to seize economic opportunities afforded by improvement in local economic governance, which in turn can help them to achieve higher income growth. While the effect of good governance has a positive effect on income growth for several quantiles, this is not the case for the poorest (those in the 10th percentile). The reason may be that lack of resources prevents the
poor from taking advantage of the improved business environment to enhance their economic welfare.
18
addition, we find that the return on education is higher for richer households. We also find that having more land results in income growth for all groups, although the proportion of agriculture in total household income has declined significantly in Vietnam over the past decade (GSO, 2015).
19
References
Appleton, S. (1996). Women-headed households and household welfare: An empirical deconstruction for Uganda. World Development, 24(12), 1811-1827.
Attride, E. (2002). Poverty task force: Ensuring good governance for poverty reduction. Hanoi, Vietnam: ADB in Vietnam.
Azfar, O., & Gurgur, T. (2008). Does corruption affect health outcomes in the Philippines?
Economics of Governance, 9(3), 197-244.
Barro, R. J. (1991). Economic growth in a cross section of countries. The Quarterly Journal of Economics, 106(2), 407-443.
Blundell, R., & Stoker, T. M. (2005). Heterogeneity and aggregation. Journal of Economic Literature, 43(2), 347-391.
Brinkerhoff, D. W. (2008). The state and international development management: Shifting tides, changing boundaries, and future directions. Public Administration Review, 68(6), 985-1001.
Buchinsky, M. (1994). Changes in the US wage structure 1963-1987: Application of quantile regression. Econometrica: Journal of the Econometric Society, 405-458.
Bui, A. T., Dungey, M., Nguyen, C. V., & Pham, T. P. (2014). The impact of natural disasters on household income, expenditure, poverty and inequality: Evidence from Vietnam.
Applied Economics, 46(15), 1751-1766.
Cameron, A. C., & Trivedi, P. K. (2005). Microeconometrics: Methods and applications.
Cambridge University Press.
Campos, N. F., & Nugent, J. B. (1999). Development performance and the institutions of governance: Evidence from East Asia and Latin America. World Development, 27(3), 439-452.
Canay, I. A. (2011). A simple approach to quantile regression for panel data. The Econometrics Journal, 14(3), 368-386.
Daoud, A. (2015). Quality of governance, corruption and absolute child poverty in India.
Journal of South Asian Development, 10(2), 148-167.
Deaton, A. (1997). The analysis of household surveys: A microeconometric approach to development policy. World Bank Publications.
Doan, T., Le, Q., & Tran, T. Q. (2016). Lost in transition? Declining returns to education in Vietnam. The European Journal of Development Research, 1-22.
Dollar, D., & Kraay, A. (2002). Growth is Good for the Poor. Journal of Economic Growth, 7(3), 195-225.
Djurfeldt, A. A., Djurfeldt, G., & Lodin, J. B. (2013). Geography of gender gaps: regional patterns of income and farm–nonfarm interaction among male-and female-headed households in eight African countries. World Development, 48, 32-47.
Eric, C., Chetwynd, F., & Spector, B. (2003). Corruption and poverty: A review of recent literature. Washington, DC: Management Systems International.
General Statistics Office. (2015). Results of Vietnam household living standard survey 2014. Hanoi, Vietnam: Author.
Ghai, D. (2000). Social development and public policy: A study of some successful experiences. London: Macmillan.
Haq, R., Zia, U., & Arif, G. (2006). Governance and pro-poor growth: Evidence from Pakistan.
The Pakistan Development Review, 45(4), 761-776.
20
Ha, H. V., & Tran, T. Q. (2017). International trade and employment: A quantile regression approach. Journal of Economic Integration, 32(3), 531-557.
Huther, J., & Shah, A. (2005). A simple measure of good governance. Washington, DC: World Bank.
Jairo, A.-A., Nguyen, C., Tran, A., & Phung, T. (2015). The urban-rural gap in governance and public administration: Evidence from Vietnam. International Public Management Review, 16(1), 165-191.
Jansen, H. G., Pender, J., Damon, A., Wielemaker, W., & Schipper, R. (2006). Policies for sustainable development in the hillside areas of Honduras: A quantitative livelihoods approach. Agricultural Economics, 34(2), 141-153.
Koenker, R. (2005). Quantile regression. Cambridge University Press.
Koenker, R., & Hallock, K. F. (2001). Quantile regression. Journal of Economic Perspectives, 15(4), 143-156.
Krueger, A. O. (1974). The political economy of the rent-seeking society. The American Economic Review, 64(3), 291-303.
Li, H., Squire, L., & Zou, H. f. (1998). Explaining international and intertemporal variations in income inequality. The Economic Journal, 108(446), 26-43.
Malesky, E. I. (2004). Push, pull, and reinforcing: The channels of FDI influence on provincial governance in Vietnam. In B. J. T. Kerkvliet & D. G. Marr (Eds.), Beyond Hanoi: Local government in Vietnam (pp. 285-333). Singapore: Institute for South East Asian Studies and NIAS Press.
Malesky, E. I. (2007). The Vietnam provincial competitive index 2007: Measuring economic governance for private sector development. Hanoi, Vietnam: USAID and VCCI. Mundial, B. (1989). Sub-Saharan Africa: From crisis to sustainable growth: A long-term
perspective study. Washington, DC: World Bank.
Nguyen, C. V., & Daniel, M. (2012). Economic impacts of international migration and remittances on household welfare in Vietnam. International Journal of Development Issues, 11(2), 144-163.
Nguyen, C. V., & Marrit, B. (2014). Informal credit, usury, or support? A case study for Vietnam. The Developing Economies, 52(2), 154-178.
Nguyen, C. V., & Tran, A. N. (2013). The role of crop land during economic development: Evidence from rural Vietnam. European Review of Agricultural Economics, 41(4), 561-582.
North, D. C. (1994). Economic performance through time. The American Economic Review, 84(3), 359-368.
North, D. C. (1995). The new institutional economics and third world development. In J. Harris, J. Hunter, & C. M. Lewis (Eds.), The new institutional economics and third world development (Vol. 21). London and New York: Routledge.
Oginni, A., Ahonsi, B., & Ukwuije, F. (2013). Are female-headed households typically poorer than male-headed households in Nigeria? The Journal of Socio-Economics, 45, 132-137.
Pfau, W. D., & Giang, L. T. (2009). Determinants and impacts of international remittances on household welfare in Vietnam. International Social Science Journal, 60(197‐198), 431-443.
Pham, T., Anh Tuan, B., & Thanh, L. (2010). Is nonfarm diversification a way out of poverty for rural households? Evidence from Vietnam in 1993-2006. Poverty and Economic Poverty PMMA Working Paper 2010-17. Social Science Research Network.
21
Rigg, J. (2006). Land, farming, livelihoods, and poverty: Rethinking the links in the rural South.
World Development, 34(1), 180-202.
Sáez, L. (2013). Methods in governance research: A review of research approaches. ESID Working Paper No. 17. School of Oriental and African Studies. Manchester, UK. Stiglitz, J. E. (2002). Globalization and its discontents (Vol. 500). New York: Norton.
Tarp, F., Vinh, D. Q., & Tuan, N. D. A. (2017). Characteristics of the Vietnamese rural
economy: Evidence from a 2016 rural household survey in 12 provinces of Viet Nam.
Tokyo, Japan: United Nations University.
Tarschys, D. (2001). Wealth, values, institutions: Trends in government and governance. In
Governance in the 21st Century (Vol. 27, p. 41). Paris: OECD.
Tran, T. Q. (2015a). Nonfarm employment and household income among ethnic minorities in Vietnam. Economic Research—Ekonomska Istraživanja, 28(1), 703-716. doi:10.1080/1331677X.2015.1087872
Tran, T. Q. (2015b). Socio-economic determinants of household income among ethnic minorities in the North-West Mountains, Vietnam. Croatian Economic Survey, 17(1), 139-159.
Tran, T. Q., Huong, V. V., Doan, T., & Tran, H. D. (2016). Corruption, provincial institutions and manufacturing firm productivity: New evidence from a transitional economy.
Estudio de Economia, 43(2), 199-215.
Tran, T. Q., Lim, S., Cameron, M. P., & Van, H. V. (2014). Farmland loss and livelihood outcomes: A microeconometric analysis of household surveys in Vietnam. Journal of the Asia Pacific Economy, 19(3), 423-444.
Tran, T. Q., Nguyen, S. H., Van, H. V., & Nguyen, V. Q. (2015). A note on poverty among ethnic minorities in the northwest region of Vietnam. Post-Communist Economies, 27(2), 268-281.
United Nations Development Programme. (2011a). Hanoi, Vietnam: UNDP.
United Nations Development Programme. (2011b). Social services for human development: Vietnam human development report 2011. Hanoi, Vietnam: UNDP.
Viet Nam Chamber of Commerce and Industry (VCCI) and the US Agency for International Development (USAID). (2016). The Provincial Competitiveness Index (PCI) 2016.
Hanoi: Vietnam.
World Bank. (1992). Governance and development. Washington, DC: World Bank.
World Bank. (2013). Not YET done: Vietnam’s remarkable progress on poverty reduction and the emerging challenges. Washington DC: World Bank.
World Bank. (2017). Vietnam: Overview. Retrieved from
http://www.worldbank.org/en/country/vietnam/overview
Wooldridge, J. M. (2013). Introductory econometrics: A modern approach. Manson, WA: Cengage Learning.