STUDY OF CHEMICAL COMPOSITION OF ROSEMARY ESSENTIAL
OIL FROM WESTERN MOROCCO AND EVALUATION OF
ANTIOXIDANT AND ANTIBACTERIAL ACTIVITY OF ITS
EXTRACTS
Sara HAIDA1*, Fatima Zahra ESSADIK1, Abdelaziz KRIBII1, Amar HABSAOUI1, Khadija OUNINE2, Abdessamad BENMOUMEN3 and Abderahim KRIBII1
1
Laboratory of Separation Processes, Team of Environment and Applied Chemistry, Faculty
of Sciences, Ibn Tofail University, Kenitra – Morocco.
2
Laboratory of Biology and Health, Applied Microbiology Team, Faculty of Sciences, Ibn
Tofail University, Kenitra – Morocco.
3
Laboratory of plants Biology and microorganisms, Faculty of Science, Mohammed I
University, Oujda - Morocco.
ABSTRACT
This work is inscribed in the frame of valorization of medicinal and
aromatic plants from Morocco. The plant chosen for this study is
rosemary (Rosmarinus officinalis L.). it can be found in the west of
Morocco. The volatile fraction obtained by hydrodistillation (0.85%)
was analyzed by GC-MS process and its chemical composition was
determined. α-pinene, camphor, verbenone and camphene were the
main components of the essential oil. The phenolic compounds of
rosemary are obtained by maceration and decoction according to
suitable extraction protocols. The best extract yields are recorded by
the decoction. UV-visible spectrophotometry analysis showed that the
highest contents of total polyphenols and flavonoids are obtained in the
methanol extract by decoction. The antioxidant activity of different
extracts was evaluated by free radical scavenging method with DPPH• (2,2-diphényl-1-picrylhydrazyl), aqueous extract obtained by decoction seems to be the most
active (IC50 = 0.138 mg/mL). The rosemary extracts were tested for antibacterial activity by
sterile disc diffusion method, using three strains of different bacteria (Escherichia coli,
Volume 4, Issue 7, 307-323. Research Article ISSN 2277– 7105
Article Received on 05 May 2015,
Revised on 30 May 2015, Accepted on 24 June 2015
*Correspondence for Author
Sara HAIDA
Staphylococcus aureus and Pseudomonas aeruginosa). The results show that only apolar
extracts responded positively to two of three bacterial strains tested.
KEYWORDS: Rosmarinus officinalis L., GC-MS, phenolic compounds, flavonoids, antioxidant activity, antibacterial activity.
1. INTRODUCTION
Plants have been used by Humans since antiquity to handle common infectious diseases.
Some of these traditional treatments are always included as part of the usual treatment of
various diseases.[1] These plants are an important reservoir of potential compounds, which have the advantage to be a big diversity of chemical structures possessing a very wide range
of biological activities.[2]
Currently, the development of bacterial resistance in antibiotics and toxicity of synthetic
antioxidants led the researchers to tap into the world of plants particularly in medicinal and
aromatic plants, for their antioxidant and antibacterial properties; these plants are used to
protect the human body against oxidation reactions and cellular pathogens.[3]
The biological properties are mainly due to polyphenols, which are secondary metabolites
widely spread in plants and known for their beneficial health effects.[4]
Among the inventory of medicinal plants from Morocco, rosemary (Rosmarinus officinalis
L.) is a shrub of the Lamiaceae family, which is widely used in traditional medicine for its
biological properties.[5] The aim of our work is to study the chemical composition of the essential oil of rosemary in western Morocco, to demonstrate the wealth of this plant into
polyphenols and evaluate the antioxidant and antibacterial activity of its extracts.
2. MATERIALS AND METHODS 2.1. Plant material
The harvesting of rosemary samples is conducted in full bloom in March in the Gharb region
(western Morocco). The aerial parts (leaves, flowers, twigs) are collected in the early
morning.
2.1. Extraction of essential oil
material and distilled water (about 2/3 of the flask) and a few grains of carborundum, the
whole is boiled for 5 hours. After extraction, the obtained condensate is constituted by the
essential oil, immiscible with water of yellow color, and the hydrosol of white color loaded
by soluble compounds (or partially soluble) in water which can be concentrated by
performing a salting out.
2.2. GC-MS analysis
The essential oil was analyzed by gas chromatography coupled to mass spectrometry. Perkin
Elmer Trademark was apparatus used in this analysis; it consisted of chromatograph Clarus
680 type coupled to a mass spectrometer Clarus SQ type 8C. The capillary column used is a
Rxi-5ms 30m long, 0.25mm diameter and 0.25μm thick. The oven temperature was
programmed at 60 °C for 5 minutes and gradually rose up to 300 °C at 2 °C/min for the
remaining 10 minutes. The carrier gas used was helium with a flow rate of 1 mL/min. The
sample was injected with a volume of 1µL.
Mass spectra of different compounds identified are recognized and affirmed by using the
database of mass spectra of pure products (NIST: National Institute of Standards and
Technology).[6] Retention indices of the various compounds were compared by referring to the literature.[7]
2.3. Extraction of phenolic compounds
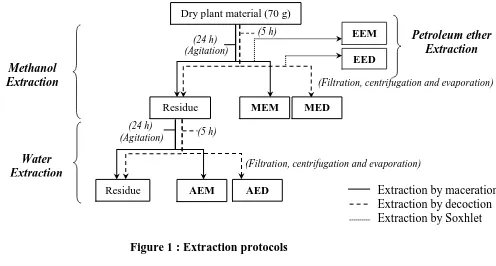
The extraction protocols are described and detailed in figure 1. Two types of extraction were
employed to isolate polar products: the extraction by maceration (at room temperature) and
the extraction by decoction (reflux). In each method the dry plant material, finely crushed, is
extracted with methanol, the residue obtained after filtration and drying is then extracted with
distilled water.
The apolar compounds are obtained by Soxhlet extraction with petroleum ether. At the end of
these protocols are obtained:
2.5. Phytochemical tests
To realize the phytochemical tests, extracts of rosmary (MEM, MED, AEM and AED) are
diluted in suitable solvents.
2.5.1. Flavonoids
The presence or absence of the flavonoids in one extract can be detected by a simple and
rapid test with magnesium. This test involves putting 5 mL of each extract in tubes, add 1 mL
of concentrated HCl and 0.5 g of magnesium turnings. The presence of flavonoids is
indicated by the transfer of the color to red or pink.[8]
2.5.2. Saponins
The saponins are characterized by a foam index. Their detection is performed by adding, in a
test tube, a little water to 2 ml of extract, after stirring, the mixture is allowed to stand 20 min
and the content of saponin is measured by measuring the height of the foam formed.[8] • No foam: negative test (-)
• Foam height lower than 1 cm: weak positive test (+) • Foam height between 1 and 2 cm: positive (++) • Foam height over than 2 cm: very positive test (+++)
Petroleum ether Extraction
Water Extraction Methanol Extraction
(5 h) (24 h)
(Agitation)
(5 h) (24 h)
(Agitation)
(Filtration, centrifugation and evaporation)
(Filtration, centrifugation and evaporation)
Residue
Dry plant material (70 g)
EEM
MEM
EED
Residue
MED
AEM AED Extraction by maceration
[image:4.595.67.563.82.348.2]Extraction by decoction Extraction by Soxhlet
2.5.3. Tannins: The presence of tannins is confirmed by adding, to 1 mL of extract, 1 mL water and 1 to 2 drops of dilute solution of ferric chloride. The color turns to blue in the
presence of gallic tannins and to greenish blue in the presence of catechin tannins.[9]
2.6. Quantitative estimation of total polyphenols
The protocol used in the laboratory is based on that described by Singleton and Rossi,[10] with some modifications. To 0.5 ml of each sample dilution or gallic acid (used as a standard), we
add 1 mL of Folin-Ciocalteu reagent diluted 10 times. After 2 min, 0.8 ml of sodium
carbonate solution (7.5%, w/v) is added and the whole is incubated for 30 min in darkness at
room temperature. A blanc is prepared in parallel under the same conditions with distilled
water instead of the extract solution, and the absorbance of each solution is determined at 765
nm. The same procedure is repeated to all standard Gallic acid solutions (0 – 0.25 mg/mL).
The reading of the absorption allows to determining the concentration of polyphenols in each
solution with reference to a calibration straight plotted from gallic acid solutions previously
prepared. The total phenolic content is expressed as milligrams of gallic acid equivalents per
gram of dry matter (mg GAE/g DM).
2.7. Quantitative estimation of flavonoids content
The estimation of the flavonoid content was determined by colorimetry according to the
method of Zhishen et al. [11] with some modifications. 1 mL of each sample dilution or of
the quercetin is mixed with 3 mL of distilled water. After stirring, a volume of 0.3mL of
sodium nitrite solution (5%, w/v) is added and the mixture was stirred well. 5 min later, 0.2
mL of aluminium chloride solution (10% w/v) is added, the whole is incubated in darkness at
room temperature for 30 min, and then 0.5 mL of sodium hydroxide is added to the mixture.
The absorbance of the solution is measured at 510 nm. In this case the calibration straight is
plotted from the quercetin solutions (0 - 0.5 mg/mL) previously prepared. The total
flavonoids content is expressed as milligrams of quercetin equivalents per gram of dry matter
(mg QE/g DM).
2.8. Evaluation of antioxidant activity
To study the antioxidant activity of different extracts, we opted for the reduction method of
standard. The solution of DPPH• is prepared by solubilization of 6 mg of DPPH• in 200 ml of ethanol.
The method involves mixing in a tube, 2 mL of the solution of DPPH freshly prepared with
100 mL of each solution. A negative control (or blanc) is prepared in parallel with ethanol.
The all is then incubated in the dark for 30 min and the absorbance is measured at 517 nm.
Three optical density measurements were determined for each solution.
The evaluation of the antioxidant activity is expressed as percentage inhibition of the DPPH
radical according to the following relationship.[13]
Where, %IP is inhibition percentage and Abs is the absorbance.
This formula allows to draw the straight line which represents the variation of inhibition
percentage as a function of the different concentrations of each sample (y = ax + b). From
this straight, it is possible to deduce the concentration which can reduces 50% of DPPH• for each sample studied and for ascorbic acid. This concentration called IC50 is generally
calculated according to the following equation:
Where IC50 is concentration required to reduces 50% of DPPH•, a is the slope of straight and
b is the intercept of the straight.
2.8. Preliminary antibacterial activity
The aim of this part is to assess the antibacterial activity of the extracts of rosemary. To
highlight this activity, we used diffusion method using sterile disks (or aromatogram). This
method relies on the diffusion of substances to be studied within a Petri dish, in a solid
nutrient medium.Three bacterial strains were used:1) - Staphylococcus aureus (Gram
positive) isolated in the laboratory. 2) - Pseudomonas aeruginosa MC1 (Gram-negative),
isolated from the water table M'nasra Kenitra (Morocco) by direct seeding on cetrimide agar
Briefly, inoculum is prepared by inoculating each culture streaked on nutrient agar medium to
obtain isolated colonies. After incubation for 18 hours at 37°C, 4 to 5 colonies are isolated
with a loop and transferred into a tube of broth Muller Hinton. Then, 1 mL from 108 CFU/mL bacterial suspensions is spread on the Muller Hinton Agar plates. After 15 min, the excess is
removed until the agar dries. Filter paper discs (6 mm in diameter) are impregnated with 5 µL
of the diluted extracts and are placed on the inoculated plates, these plates are incubated at
37°C for 24 hours. To compare the results, seven antibiotics (Norflaxacin 5 µg, Erythromycin
15 UI, Fusidic acid 10 µg, Tetracycline 30 UI, Sodium Cefotaxime 30 µg, Amoxicilline 25
µg and Gentamicine 10 µg) are tested on three bacterial strains. The diameters of the
inhibition zones are measured in millimeters.
3. RESULTS AND DISCUSSION 3.1. Quantitative results extractions
The obtained essential oil yield is of the order of 0.55%. This value, although small, is within
the AFNOR standards (0.5-2%).[16] The variation in quantity of volatile compounds which may be driven by steam are influenced by various factors such as the flowering period, the
soil, the climate.[17] and the extraction method. [18] The yield of hydrosol (0.30%) is less than that of essential oil. It is constituted of soluble compounds or partially soluble in water
isolated by salting out. There is thus obtained 0.85% of volatile products.
The results of extraction by maceration show that extractable polar extracts with methanol
and water (MEM, AEM) represent 72% of the products extracted against only 28% of apolar
compounds extracted with petroleum ether (EEM).
Compared with the results obtained by maceration, and from the same starting amount, the
polar compounds obtained by decoction (MED, AED) represent 74% of the products extracts
against 26% of apolar compounds (EED).
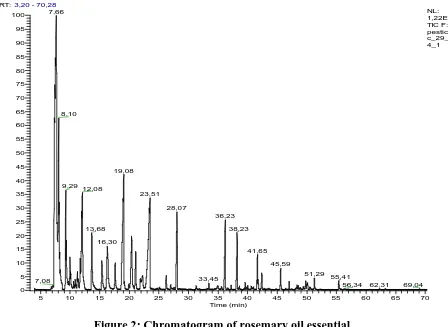
3.2. Analysis of essential oil by GC-MS coupling
Figure 2 and 3 show the chromatograms of the essential oil and the corresponding hydrosol.
The chemical composition of the rosemary essential oil and hydrosol is shown in Table 1.
Through analysis by GC-MS coupling, we identified in the essential oil 28 compounds
RT:3,20 - 70,28
5 10 15 20 25 30 35 40 45 50 55 60 65 70
Time (min) 0 5 10 15 20 25 30 35 40 45 50 55 60 65 70 75 80 85 90 95 100 R el at ive A bu nd an ce 7,66 8,10 19,08 9,29 12,08 23,51 28,07 36,23 38,23 13,68 16,30 41,65 45,59 51,29 55,41 33,45
7,08 62,31 69,04
56,34
[image:8.595.74.522.71.398.2]NL: 1,22E10 TIC F: MS pesticideso c_29_mai1 4_1
Figure 2: Chromatogram of rosemary oil essential.
RT:3,73 - 59,72
5 10 15 20 25 30 35 40 45 50 55
Time (min) 0 5 10 15 20 25 30 35 40 45 50 55 60 65 70 75 80 85 90 95 100 R el at ive A bu nd an ce 23,40 7,43 18,88 36,14 7,58 38,17 20,30 8,04 28,00 12,15 16,41
41,65 45,58 49,80
24,15
13,81 33,54 50,12
4,88 28,28 55,80
[image:8.595.73.530.425.741.2]Table 1: Chemical composition of rosemary essential oil
Compounds RT (min) % RI**
α-pinene* 7.66 30.78 936
Camphene* 8.10 7.25 950
β-pinene* 9.29 3.67 978
α-terpinene 11.25 0.38 1013
p-cymene 11.72 0.87 1015
Limonene 12.08 6.49 1025
γ-terpinene 13.68 2.31 1051
Terpinolene 15.37 1.60 1082
Linalol* 16.30 3.43 1086
Chrysanthenone 17.63 1.23 1110
Camphor* 19.08 9.54 1123
Pinocarvone 19.93 0.27 1137
Borneol* 20.41 3.33 1150
Terpinen-4-ol* 21.09 1.61 1164
α-terpineol 22.23 1.73 1176
Verbenone* 23.51 9.38 1183
Geraniol 26.26 0.53 1235
Bornyl acetate * 28.07 3.36 1270
Piperitenone 31.30 0.18 1318
α-ylangene 33.45 0.18 1376
β-Caryophyllene* 36.23 3.13 1421
α-humulene* 38.23 2.00 1455
Germacrene D 39.58 0.22 1479
α-curcumene 40.02 0.11 1484
α-muurolene 40.60 0.11 1496
β-bisabolene 41.65 1.10 1503
δ-cadinene 42.39 0.63 1520
Caryophyllene oxide 45.59 0.82 1578
* Compound also identified in hydrosol, ** Retention index.[7]
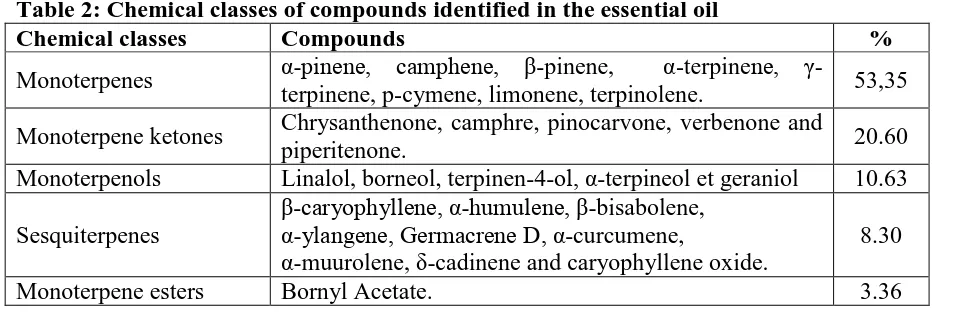
The differents classes of chemical compounds, identified in rosemary essential oil, are
classified according to their proportions in Table 2. These compounds generally have a
[image:9.595.64.548.611.768.2]monoterpene skeleton, which may be connected to an alcohol, ketone, or ester.
Table 2: Chemical classes of compounds identified in the essential oil
Chemical classes Compounds %
Monoterpenes α-pinene, camphene, β-pinene, α-terpinene,
γ-terpinene, p-cymene, limonene, terpinolene. 53,35
Monoterpene ketones Chrysanthenone, camphre, pinocarvone, verbenone and
piperitenone. 20.60
Monoterpenols Linalol, borneol, terpinen-4-ol, α-terpineol et geraniol 10.63
Sesquiterpenes
β-caryophyllene, α-humulene, β-bisabolene, α-ylangene, Germacrene D, α-curcumene,
α-muurolene, δ-cadinene and caryophyllene oxide.
8.30
3.3. Results of phytochemical tests
The phytochemical tests, carried out on polar extracts of rosemary, gave the results presented
[image:10.595.64.517.166.242.2]in Table 3.
Table 3: Results of phetochemical tests (+): presence (-): absence
Extract Flavonoids Tannins Saponosids
MEM + (Red) + (Blue) +++
MED + (Red) + (Blue) -
AEM - + (Green) -
AED - + (Green) +++
From these results, we can conclude that flavonoids and gallic tannins are present in the
methanol extracts (MEM, MED) and catechin tannins are present in aqueous extracts (AEM
AED), contrariwise saponins exist mainly in MEM and AED extracts.
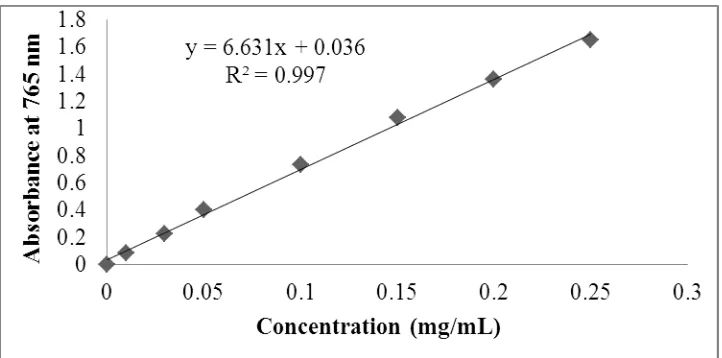
3.4. Phenolic compounds content
Due to the regression equation (y = 6.631x + 0.036, R2 = 0.997) of the calibration straight (Figure 4) which is drawn from a series of increasing concentration solutions of gallic acid,
we calculated the content of total polyphenols in each extract. This value is expressed in
milligrams of gallic acid equivalents per gram of dry matter (mg GAE/g DM).
Figure 4: The calibration straight of gallic acid
The quantification of flavonoids is obtained through the calibration straight, which is the
regression equation (y = 1.584x-0.007, R2 = 0.999) formed by a primary standard "quercetin" at different concentrations (Figure 5). Only the methanol extracts (MEM and MED), having
[image:10.595.118.479.445.624.2]The value of the flavonoids content is expressed in milligrams of quercetin equivalents per
[image:11.595.130.468.126.265.2]gram of dry matter (mg QE/g DM).
Figure 5: The calibration straight of quercetin.
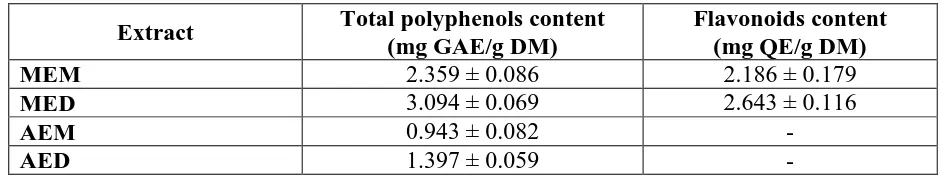
The total polyphenols and the flavonoids content of each extract are presented in Table 4.
These results show that methanol extracts provide the most important polyphenol levels in
both extractions (over 70% against less than 30% for aqueous extracts). In total, more
polyphenols obtained by decoction (58% of total polyphenols obtained by the two methods of
extraction), against only 42% obtained by maceration (about 16% more). What justifies, in
part, the higher yield obtained by this extraction method.
The results of the quantitative determination of flavonoids extract show that MED extract is
richer in flavonoids compared to the MEM extract. This shows that the extraction by
decoction can extract higher amounts of flavonoids with respect to the extraction by
maceration at room temperature.
Therefore, the decoction seems to be the best method of extracting polyphenols. However, we
must remain cautious with respect to the effect of temperature on the structural variation of
compounds, only the analysis of the chemical composition of these extracts and their
comparison can answer this question.
Table 4: The total polyphenols and the flavonoids content in the extracts of rosemary.
Extract Total polyphenols content
(mg GAE/g DM)
Flavonoids content (mg QE/g DM)
MEM 2.359 ± 0.086 2.186 ± 0.179
MED 3.094 ± 0.069 2.643 ± 0.116
AEM 0.943 ± 0.082 -
[image:11.595.61.537.656.745.2]3.5. The antioxidant capacity of the extracts of rosemary
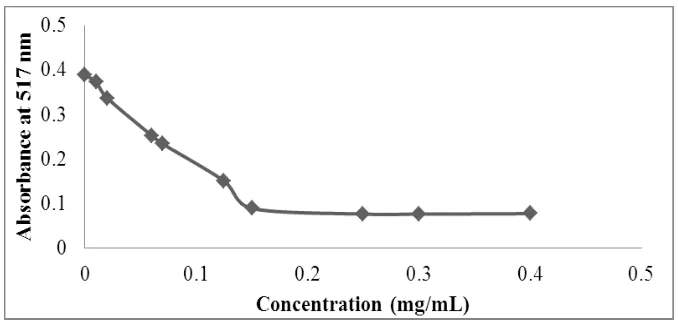
Evaluation of the antioxidant activity of rosemary extracts is performed by the DPPH• radical reduction test using the ascorbic acid as standard. The measurements of the absorbance, of
the various solutions prepared, are obtained using a UV-Visible spectrophotometer by
following the reduction of this radical which is accompanied by the change of the purple
color (DPPH•) to a yellow color (DPPH-H) measured at 517nm.
The values obtained allowed us to plot the curves of the assay (absorbance versus
concentrations) for ascorbic acid and Rosemary extracts. These curves, having an exponential
pace, are represented by two linear parts: a descending line representing the reduction of
DPPH• radical and the horizontal one that indicates that reducing the DPPH• is total.
Figure 6 shows the reduction DPPH• curve depending on the concentration of ascorbic acid and Table 5 represents the IC50 values for each extract of rosemary.
These results show that ascorbic acid has a very powerful anti-radical activity with IC50
equal to 0.097 mg/mL, this value is close to that obtained by Bentabet N. and al.[19] which is of the order of 0.08 mg/mL. Among the five extracts, essential oil has the lowest antioxidant
[image:12.595.128.467.414.576.2]power.
[image:12.595.100.533.634.740.2]Figure 6: DPPH• reduction curve depending on the concentration of ascorbic acid.
Table 5: Values of IC50 of the different rosemary extracts.
Extract Equation R2 values IC50 (mg/mL)
Ascorbic acid 501.1x + 1.627 0.991 0.097
MED 132.4x + 1.181 0.988 0.364
MEM 112.5x – 1.949 0.994 0.462
AED 354.5x + 1.146 0.994 0.138
AEM 26.91x + 0.888 0.991 1.825
It has been shown that antioxidant molecules such as ascorbic acid, flavonoids and tannins
reduce and discolored DPPH• due to their ability to give hydrogen.[20] Therefore, the polyphenols in the extracts of rosemary are probably responsible for the antioxidant activity
of these extracts. However, it seems that the high antioxidant activity of the aqueous extract
AED is probably due to the significant presence of saponins in this extract, which have an
antioxidant effect.[21]
Further, some research has shown that the antioxidant activity of rosemary extracts in
particular is produced by phenolic diterpenes which are essentially rosmarinic acid, carnosol,
rosmanol, and carnosic acid.[22]
3.5. Antibacterial activity of the extracts of Rosemary
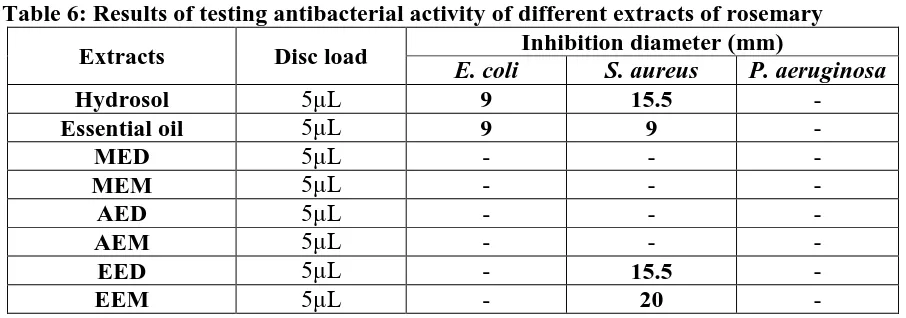
The preliminary test results of the antibacterial activity of different extracts of rosemary and
[image:13.595.71.524.339.498.2]antibiotics are shown in Tables 6 and 7.
Table 6:Results of testing antibacterial activity of different extracts of rosemary
Extracts Disc load Inhibition diameter (mm)
E. coli S. aureus P. aeruginosa
Hydrosol 5μL 9 15.5 -
Essential oil 5μL 9 9 -
MED 5μL - - -
MEM 5μL - - -
AED 5μL - - -
AEM 5μL - - -
EED 5μL - 15.5 -
EEM 5μL - 20 -
(E. coli : Escherichia coli, S. aureus : Staphylococcus aureus, P.aeruginosa : Pseudomonas
aeruginosa), (- : no inhibition zone).
Table 7: Antibacterial activity of antibiotics studied.
Antibiotiques Disc load
Inhibition diameter (mm) Acceptance limits Critical concentrations
(μg/mL) E. coli S.
aureus
P.
aeruginosa sensitive resistant
Norfloxacin 5μg - 26.5 - ≥19 <19 5
Erythromycin 15UI - - - ≥15 <15 4
Fusidic acid 10μg - 32 - ≥11 <11 20
Tetracyclin 30UI - - - ≥23 <23 2
Sodium
cefotaxime 30μg - 8 8 ≥15 <15 10
Amoxycillin 25μg - 8 - ≥18 <18 8
Gentamicin 10μg 24 8 16 ≥15 <15 6
From these results we find that:
The essential oil and hydrosol of Rosmarinus officinalis have the same effect on Escherichia
coli with a 9 mm zone of inhibition, representing 37.5% inhibition compared to Gentamicin
which is the only antibiotic active against this strain. This strain showed a resistance against
methanol (MED, MEM), aqueous (AED, AEM) and petroleum ether (EED, EEM) extracts.
In comparison with Fusidic acid, the most active against Staphylococcus aureus strain is the
extract of petroleum ether, isolated at the end of extraction by maceration, which recorded the
most power inhibitor (62.5%) against this strain. Further, the extract of decoction of
petroleum ether and hydrosol showed significant antibacterial activity corresponding to
48.4%. However, the essential oil of Rosemary revealed only moderate activity with a 9 mm
zone of inhibition corresponding to 28.1% relative to Fusidic acid.
It turned out that no zone of inhibition around the discs was observed against Pseudomonas
aeruginosa. Thus, this bacterium has a very high resistance against potential antibacterial
action of Rosemary extracts.
From these results it seems obvious that only the apolar extracts, obtained either by
hydrodistillation or by petroleum ether extraction, which answered positively to tests
conducted with two of the three selected bacterial strains. As these volatils compounds are
easy to analyze by GC-MS, it would be interesting to know the responsible compound of this
antibacterial effect.
It has been demonstrated that the resistance of gram negative bacteria extracts and
particularly the essential oils is related in part to the complexity of the cell wall of these
organisms which contains an outer membrane, in contrast to the structure of the
Gram-positive bacteria.[23]
CONCLUSION
The analysis of the essential oil by coupling GC-MS, allowed us to determine its chemical
composition. We identified 28 compounds whose major products are α-pinene, camphene, camphor, β-pinene and verbenone.
Phenolic compounds of Rosemary are obtained by maceration and decoction, the best
Also, assay results showed that the highest concentrations of total polyphenols (3.094 ± 0.069
mg GAE/g DM) and flavonoids (2.643 ± 0.116mg QE/g DM) are recognized in the decoction
of methanol extract. Therefore, the decoction seems to be the best technique for the extraction
of total polyphenols and flavonoids.
The DPPH• test results showed that the aqueous extract obtained by decoction (AED) is most active with IC50 = 0.138 mg/mL, this activity is not negligible compared to that of ascorbic
acid (IC50 = 0.097 mg/mL) which is a good antioxidant.
The results of the antibacterial testing of the extracts compared to those of commercial
antibiotics used in parallel, have shown that only apolar extracts, obtained either by
hydrodistillation or by extraction with petroleum ether, responded positively on two of the
three strains used. The essential oil and hydrosol demonstrated antibacterial activity, against
Escherichia coli, of the order of 37.5% compared to Gentamicin. The EEM extracts, EED,
essential oil and hydrosol proved active against Staphylococcus aureus, but the highest
antibacterial power is obtained with the EEM extract, with 62.5% inhibition compared to the
Fusidic acid.
REFERENCES
1. Rios JL, Recio MC. Medicinal plants and antimicrobial activity. J of ethnopharmacology,
2005; 100: 80-84.
2. Rollinger JM, Haupt S, Stuppner H, Langer T. Combining ethnopharmacology and virtual
screening for lead structure discovery: COX-inhibitors as application example. J Chem
Inf Comput Sci, 2004; 44: 480-488.
3. Sengul M, Yildiz H, Gungor N, Cetin B, Eser Z, Ercisli S. Total phenolic content,
antioxydant and antimicrobial activities of some medicinal plants. Park J Pharm Sci,
2009; 22: 102-106.
4. Koechlin-Ramonatxo C. Oxygen, oxidative stress and antioxidant supplementation, or
another way for nutrition in respiratory diseases. Nutrition Clinique et Métabolique, 2006;
20: 165- 177.
5. Wikipedia. The free encyclopedia (online): http://www.wikipédia.com
6. Standard reference data program: webbook.nist.gov/chemistry/
7. Dr. Detlev Hochmuth, scientific consulting Terpenoids library list.
8. Yadav RNS, Agarwala M. Phytochemical analysis of some medicinal plants. J of
9. Trease GE, Evans WC. Pharmacognosy, 13th edition Bailliere Tindal, London: 1989; pp.
278-279.
10.Singleton VL, Rossi JA. Colorimetry of total phenolic with
phosphomolybdic-phosphotungstic acid reagents. J The American Society for Enology and Viticulture,
1965; 16: 144-158.
11.Zhishen J, Mengcheng T, Jianming W. The determination of flavonoid contents in
mulberry and their scarvening effects on superoxide radicals. J Food Chemistry, 1999; 64:
555-559.
12.Sanchez-Moreno C, Review: Methods used to evaluate the free radical scavenging
activity in food and biological systems. J Food Science and Technology International,
2002; 3: 121-137.
13.Djeridane A, Yousfi M, Nadjemi B, Maamri S, Djireb F, Stocker P. Phenolic extracts
from various Algerien plants as strong inhibitors of porcine liver carboxyl esterase. J.
Enzyme Inhibition and Medicinal Chemistry, 2006; 21: 719-726.
14.Bricha S, Ounine K, Oulkheir S, El Haloui NE, Attarassi B. Heat resistance of
Pseudomonas aeruginosa in preparations at the base of cucumber, tomato and lettuce as
affected by pH and sodium chloride. World Journal of Biological Research, 2010; 3: 8
pages.
15.Oulkheir S, Ounine K, Elhaloui NE, Attarassi B. Survie d’Escherichia coli des conditions
acides. Bull. Soc. Pharm. Bordeaux, 2006; 145: 41-52.
16.ANONYME, Norme AFNOR. Huile essentielle du romarin. ISO 1342 (T75-214), 2001.
17.Hassiotis CN, Nata F, Lazari DM, Poulios S, Vlachonasios KE. Environmental and
developemental factors affect essential oil production and quality of Lavandula
angustifolia during fowering period. J. Industrial corps and products, 2014; 62: 359-366.
18.Gavahian M, Farhoosh R, Javidnia K, Shahidi F, Farahnaky A. Effect of applied voltage
and frequency on extraction parameters and extracted essential oils from Menthapiperita
by ohmic assisted hydrodistillation. J. Innovative Food Science and Emerging
Technologies, 2015; 29: 161-169.
19.Bentabet N, Boucherit-otmani Z Boucherit k. Composition chimique et activité
antioxydante d’extraits organiques des racines de Fredolia aretioides de la région de
Béchar en Algérie. Journal Phrmacognosie, 2014; 12: 364-371.
20.Gheffour K, Boucherit K, Boucherit-Otmani Z. Etude phytochimique et évaluation de
21.Almeida B, Ribas O, Novelli ELB. Antioxidant effect of saponin: potential action of a
soybean flavonoid on glucose tolerance and risk factors for atherosclerosis. International
Journal of Food Sciences and Nutrition, 2005; 2(56): 79-85.
22.Ibanez E, Aranzazu O. Supercritical Fluid Extraction and Fractionation of Different
Preprocessed Rosemary Plants. Journal Agricultural Food Chemistry, 1999; 47:
1400-1404.
23.Burt S. Essentieloils: their antibacterial propreties and potential applications in foods-a