SIMULTANEOUS ESTIMATION OF METHOTREXATE AND
TRETINOIN BY REVERSE PHASE –HPLC METHOD
Aditya S., Arun P.*, Neelesh D., Neeraj K., Shailendra P., Shivani T. and Stuti P.
Shri Ram Group of Institution Faculty of Pharmacy, Jabalpur M.P.
ABSTRACT
A simple fast, precise and accurate liquid chromatographic method was
developed for simultaneous estimation of Methotrexate(MTX) and
tretioin(ATX) combined dosage form by RP-HPLC (Reverse Phase
High Performance Liquid Chromatography) method. Chromatography
was out on a column -18 and ACN:Buffer (85:15 v/v) of resultant pH
3.0, as mobile phase, at a flow rate of 1.2ml/min and measured at
340nmth. The calibration curves linearity range were 1-6ug/ml for
methorexate and 1-16 ug/ml for tretioin, regression coefficient values
are 0.9989 and 0.9999 respectively. The average retention time of
Methotrexate and trition were found to be 1.95 and 8.98 min
respectively. The method was reproducible, with good resolution and sharp peak of
Methotrexate and tretioin. There results of the analysis have been validated statistically.
KEYWORDS: METHOTREXATE, TRETIONIN, RP-HPLC, ASSAY, UV DETECTION.
INTRODUCTION
Analytical chemistry plays vital role in development of science, which involves separation,
identification and determination of the relative amounts of components in a sample of matter.
Drug should be available in such a form that quality including bioavailability, adequate
plasma concentration, desired duration and onset of action, accurate dose, safety, efficacy and
stability on storage of product, can be assured during the storage of the product.
Volume 6, Issue 10, 535-548. Research Article ISSN 2277– 7105
*Corresponding Author
Arun P.
Shri Ram Group of
Institution Faculty of
Pharmacy, Jabalpur M.P. Article Received on 06 July 2017,
Revised on 26 July 2017, Accepted on 16 August 2017
DRUG PROFILE
Table for Drug Profile of MTX.
Common Name Methotrexate (MTX)
IUPAC Name (S)-2-(4-(((2,4-diaminopteridin-6-yl)methyl) (methyl)amino)benzamido)pentanedioic acid Chemical Formula C20H22N8O5
Mol. Mass 454.44 g/mol
Physical Parameters MTX is a bright yellow-orange, odorless powder.
Solubility
MTX is practically insoluble in water, chloroform and ether. It is freely soluble in dilute solutions of alkaline and carbonates; it is slightly soluble in dilute HCL and alcohol.
Uses
Intake of MTX is dangerous, so is useful only in the following conditions :
MTX is used to treat only life-threatening cancer. It is ingested in severe psoriasis.
It also works in rheumatoid arthritis.
It is also applicable in psoriatic arthritis, mycosis fungoides, and a variety of solid tumors.
Adverse Effects
Dry cough, shortness of breath; diarrhea, vomiting, white patches or sores inside your mouth or on your lips; blood in your urine or stools; fever, chills, body aches, sore throat and headache with a severe blistering, peeling and red skin rash, nausea, stomach pain, low fever, loss of appetite, dark urine, clay-colored stools, jaundice (yellowing of the skin or eyes).
Pharmacokinetics
1. Bioavailability--17–90% 2. Protein binding—70% 3.Metabolism—Hepatic
4. Half Life—3–15 hours (dose dependent) 5. Excretion—Renal (48–100%).
Therapeutic Cons
Pregnancy cat : D(AU) X(US)
Legal Status : Prescription Only (S4)(AU), POM(UK). Routes : Oral, iv, im, sc, intrathecal.
Table for Drug Profile of ATRA.
Common Name Tretinoin (all-trans retinoic acid or ATRA)
IUPAC Name 3,7-dimethyl-9-(2,6,6-trimethyl-1-cyclohexenyl)–nona-2,4,6,8-tetraenoic acid
Chemical Formula C20H28O2
Mol. Mass 300.4412 g/mol
Chemical Structure
Physical Parameters Tretinoin is a slightly yellow powder.
chloride.
Dosage Cream or Gel : 0.01%, 0.025%, 0.04%, 0.05%, 0.1%. Cream:
0.02%, 0.025%, 0.05%, 0.1%.
Uses
1. It is commonly used to treat Acne Vulgaris and Keratosis Pilaris.
2. It is also used to treat Acute Promyelocytic Leukemia (APML).
3. It is also used in the treatment of Photoaging.
4. Topical tretinoin is also used to treat and reduce the appearance of Stretch Marks by increasing collagen production in the dermis.
Contraindications
Combining other topical acne medications (for example, salicylic acid) with tretinoin may lead to excessive skin irritation.
Use of abrasive soaps or cleansers, astringents, skin waxes and other products that irritate the skin may add to tretinoin induced skin irritation.
Adverse Effects
Redness, Scaling, Itching, And Burning of skin.
It is aTeratogen. Dyspepsia, Fever, Weight gain, Peripheral Edema in patients with Acute Promyelocytic Leukemia.
Pharmacokinetics 1. Protein binding—> 95% 2. Half Life—0.5-2 hours
Therapeutic Cons
Pregnancy cat. : C(topical), D(oral)(USA)
Legal Status : Prescription Only (S4)(AU) Routes : Topical, oral.
EXPERIMENTAL PROFILE
Types of Chemical Analysis
Qualitative Method
When a completely unknown sample is taken for analysis, presence of one or more component in the sample and prediction of structural features of the compound, are done by qualitative method.[4,5]
Quantitative Method
This method deals with the determination of quantity i.e. content of each component or
specified component of the sample, whose chemical behavior is known. Quantitative analysis
can be classified into two categories
• Classical Method of Analysis. • Instrumental Method of Analysis.
A. Classical Method of Analysis
In these methods volume and mass are used as means of detection i.e. Gravimetry, titrimetry
B. Instrumental Method of Analysis
These methods are based on the measurement of specific and nonspecific physical properties
[image:4.595.47.556.148.716.2] [image:4.595.42.559.152.750.2]of a substance by using instrument.
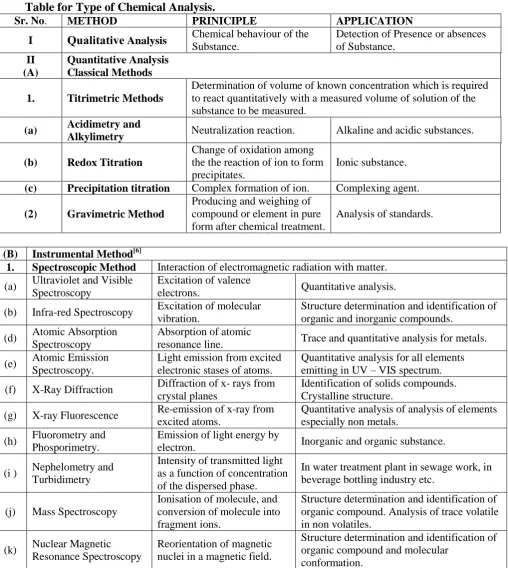
Table for Type of Chemical Analysis.
Sr. No. METHOD PRINICIPLE APPLICATION
I Qualitative Analysis Chemical behaviour of the
Substance.
Detection of Presence or absences of Substance.
II (A)
QuantitativeAnalysis Classical Methods
1. Titrimetric Methods
Determination of volume of known concentration which is required to react quantitatively with a measured volume of solution of the substance to be measured.
(a) Acidimetry and
Alkylimetry Neutralization reaction. Alkaline and acidic substances.
(b) Redox Titration
Change of oxidation among the the reaction of ion to form precipitates.
Ionic substance.
(c) Precipitation titration Complex formation of ion. Complexing agent.
(2) Gravimetric Method
Producing and weighing of compound or element in pure form after chemical treatment.
Analysis of standards.
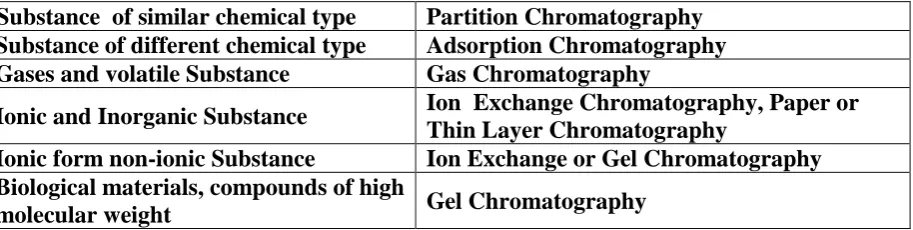
(B) Instrumental Method[6]
1. Spectroscopic Method Interaction of electromagnetic radiation with matter.
(a) Ultraviolet and Visible
Spectroscopy
Excitation of valence
electrons. Quantitative analysis.
(b) Infra-red Spectroscopy Excitation of molecular
vibration.
Structure determination and identification of organic and inorganic compounds.
(d) Atomic Absorption
Spectroscopy
Absorption of atomic
resonance line. Trace and quantitative analysis for metals.
(e) Atomic Emission
Spectroscopy.
Light emission from excited electronic stases of atoms.
Quantitative analysis for all elements emitting in UV – VIS spectrum.
(f) X-Ray Diffraction Diffraction of x- rays from
crystal planes
Identification of solids compounds. Crystalline structure.
(g) X-ray Fluorescence Re-emission of x-ray from
excited atoms.
Quantitative analysis of analysis of elements especially non metals.
(h) Fluorometry and
Phosporimetry.
Emission of light energy by
electron. Inorganic and organic substance.
(i ) Nephelometry and
Turbidimetry
Intensity of transmitted light as a function of concentration of the dispersed phase.
In water treatment plant in sewage work, in beverage bottling industry etc.
(j) Mass Spectroscopy
Ionisation of molecule, and conversion of molecule into fragment ions.
Structure determination and identification of organic compound. Analysis of trace volatile in non volatiles.
(k) Nuclear Magnetic
Resonance Spectroscopy
Reorientation of magnetic nuclei in a magnetic field.
Structure determination and identification of organic compound and molecular
conformation.
(l)
Electron Spin Resonance Spectroscopy
Reorientation of magnetic electrons in a magnetic field.
4. Hyphenated Method[8]
(a) GC-Mass Spectroscopy
Combine separation efficiency of GC with sensitivity and
specificity of mass spectroscopy.
Identification and analysis of mixtures.
(b) GC-IR Spectroscopy
Combine separation efficiency of GC with specificity of IR.
Separation and structural determination of mixtures.
(c) HPLC-Mass Spectroscopy
Combine separation efficiency of HPLC with sensitivity and specificity of mass spectroscopy.
Analysis and identification of mixtures.
3. Chromatographic method[7]
(a) Gas Chromatography (GC)
Partitioning between vapour phase and solid/liquid.
Multi-component and qualitative analysis of volatile organics.
(b) Liquid
Chromatography(HPLC)
Partitioning between liquid and solid phase
Separation technique for ionic materials. Used for
multicomponent analysis.
(c) Size-Exclusion Chromatography
Solute size dependent partitioning between packing pore volume and interstitial volume.
Separation according to hydrodynamic volume, Determination of polymer molecular weight distribution.
(d) High-Performance Thin Layer Chromatography
Partitioning between liquid
solution and solid. Multi-component analysis.
(e) Paper Chromatography Partitioning between liquid
solution and paper. Separation of amino acids.
2. Electrochemical Method:
(a) Potentiometry
Difference in electrode potential depends on concentration of ionic species in solution
PH determination, fluride determination.
(b) Voltametry and Polarography
Voltage current time Relationship during electrolysis.
Metals, anions and many organic species.
(c) Stripping Method
Electrodeposition of ion onto an electrode surface area and electrochemically stripped from electrode back into solution.
Determination of metals in tap water.
(d) Amperometry Method
Difference in voltage is a function of
volume of the titrating reagent. Trace metal analysis.
(e) Coulometry Method
The extent of chemical reaction of an electrode is directly proportional to the quantity of electricity passing through electrode.
Reagents which are difficult to analyze by ordinary chemical means like nitrates.
(f) Electrogravimetry Method
The amount of chemical action is proportional to quantity of electricity which passes through the electrode.
Metal elements.
(g) Conductance
5. Miscellaneous Method:
(a) Thermal Analysis
Change in physical and/or chemical property of substances as a function of temperature.
Determination of purity and thermal stability.
(b) Refractrometry Method
Refractive index is function of concentration.
Determination of composition of binary liquid or gaseous mixtures.
(c) Polarimetry Method
Substance solution cause
rotation of plane polarized light.
Quantitative analysis of optically active compounds.
(d) Radiometric Methods
Counting of radioactive species
produced by substance. Trace and ultra trace element analysis.
(e)
Biological and Microbiological Method
Analysis of microbial inhibitions.
Biological assay of elements microbiological assay of antibiotic and vitamins.
The instrumental methods are more accurate, precise, sensitive, selective and less time
consuming than classical methods.
Chromatography
Chromatography is ―a separation process that is achieved by distribution of substance
between two phases, stationery phase and mobile phase. Chromatography is probably the
most power full and versatile analytical technique available to modern chemist. Its power
arises from its capacity to determine quantitatively many individual components present in
[image:6.595.74.531.482.597.2]the mixture in one, single analytical procedure.
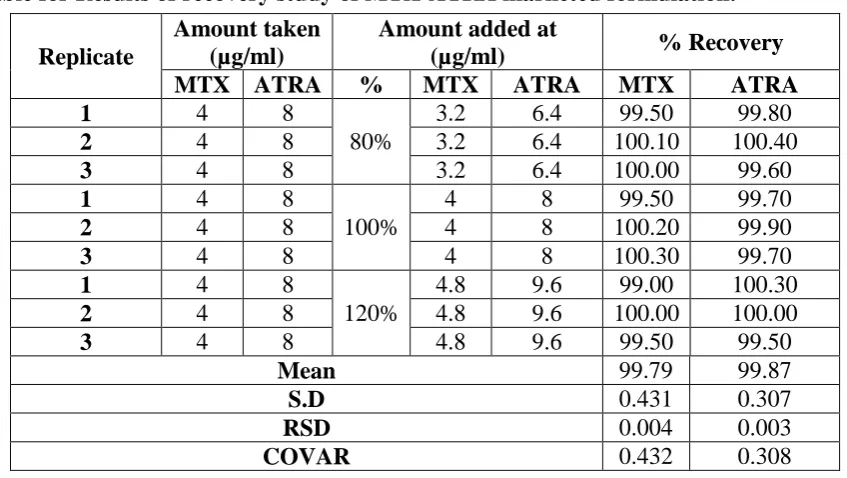
Table for Choice of Method.
Substance of similar chemical type Partition Chromatography
Substance of different chemical type Adsorption Chromatography
Gases and volatile Substance Gas Chromatography
Ionic and Inorganic Substance Ion Exchange Chromatography, Paper or
Thin Layer Chromatography
Ionic form non-ionic Substance Ion Exchange or Gel Chromatography
Biological materials, compounds of high
molecular weight Gel Chromatography
High Performance Liquid Chromatography
Early in the development of liquid chromatography, scientist realized that increase in column
efficiency could be brought about by decreasing the partial size of packaging. The technology
for producing and using pickings with particle diameter as smalls 3 to10µm was developed.
This technology required sophisticated instruments operating at high pressure, which
contrasted markedly with the simple glass columns of classic gravity-flow liquid
INSTRUMENTATION
The Essential Feature of Modern High Performance Liquid Chromatography In normal phase
LLC, the stationary phase is polar and the mobile phase is non-polar. In reversed phase LLC,
the polarity of these phases is reversed, i.e., stationary phase non-polar and mobile phase is
polar (RP – HPLC).
Fig: 1.1 Block diagram of a complete HPLC. The item connected by Dashed lines are
necessary only for gradient elution.
RP-High Performance Liquid Chromatography
Reverse phase chromatography refers to the use of a polar eluent with a non polar stationary
phase in contrast to normal phase chromatography, where a polar stationary phase is
employed with a non-polar mobile phase.
Reverse Phase Chromatography is widely used due to the following advantages
Many compounds such as biologically active substances have limited solubility in non polar
solvents that are employed in normal phase chromatography.
Ionic or highly polar compounds have high heats of adsorption on straight silica or
alumina columns and therefore can elute as a tailing peaks.
Column deactivation from polar modifiers is a problem in liquid solid chromatography which
Ionic compounds can be chromatographed via ion exchange chromatography. This mode of
chromatography is tedious because precise control of variables such as pH and ionic strength
is required for reproducible chromatography.
Step in HPLC Method Development
The steps involved in HPLC method development are summarized in following the series of
step.[10]
Fig-For Steps in HPLC Method Development.
Analytical Method Validation
The purpose of method validation is to demonstrate that the established method is ―fit for the
purpose‖. This means that the method, as used by the laboratory generating the data, will
provide data that meets the criteria set in the planning phase. There is not a single accepted
procedure for conducting a method validation. The ultimate objective of the method
validation is to provide evidence that the method does what it is intended to do, accurately,
reliably and reproducibly. The validation parameters as per ICH guidelines are:
2. Precision
3. Specificity
4. Limit of Detection
5. Limit of Quantitation
6. Linearity
7. Ruggedness
8. Robustness
9. System Suitability Testing.
Method Validation
On the basis of fixed parameters the method of estimation was validated for following
parameters.
1. Accuracy (Recovery Studies)
Recovery studies were carried out at 80%, 100% and 120% level. The results for recovery
[image:9.595.85.509.414.653.2]studies showed that results were within acceptable limits, above 99% and below 101%.
Table for Results of recovery study of MTX-ATRA marketed formulation.
Precision
Table forData of Method Repeatability of MTX and ATRA Formulation.
Drug Label
claim
Amount Found*
(%)
Standard Deviation*
% Co- efficient of Variation*
RSD*
MTX (mg/tab) 7.5 99.64 0.0787 0.0311 0.019
ATRA (%gel) 0.1 98.12 0.098 0.0477 0.041
Replicate
Amount taken (µg/ml)
Amount added at
(µg/ml) % Recovery
MTX ATRA % MTX ATRA MTX ATRA
1 4 8
80%
3.2 6.4 99.50 99.80
2 4 8 3.2 6.4 100.10 100.40
3 4 8 3.2 6.4 100.00 99.60
1 4 8
100%
4 8 99.50 99.70
2 4 8 4 8 100.20 99.90
3 4 8 4 8 100.30 99.70
1 4 8
120%
4.8 9.6 99.00 100.30
2 4 8 4.8 9.6 100.00 100.00
3 4 8 4.8 9.6 99.50 99.50
Mean 99.79 99.87
S.D 0.431 0.307
RSD 0.004 0.003
Denotes average of six determinations
Limit of Detection (LOD) and Limit of Quantitation (LOQ)
Sample solution was subjected to Limit of Detection (LOD) and Limit of Quantitation (LOQ)
studies, results are given in Table.
Table for LOD and LOQ of MTX and ATRA Formulation.
Drug LOD (μg/mL) LOQ (μg/mL)
MTX 0.6 0.8
ATRA 0.5 0.7
[image:10.595.159.435.285.446.2] [image:10.595.29.564.515.750.2]System Suitability / Repeatability
Table for HPLC System suitability of MTX and ATRA Formulation.
Injection No
Standard Response MTX
2(µg/mL)
ATRA 4(µg/mL)
1. 1115973 452765
2. 1115750 452701
3. 1115130 452720
4. 1115127 452750
5. 1115247 452738
Average 1115342 452736
SD 420.9301 27
%RSD 0.25 0.012
Robustness
Table for HPLC Robustness of MTX-ATRA Formulation
Effect on AUC
S.No Sys Suitability Flow (-10%) Flow (+10%) pH= 2.97 pH= 3.03
MTX ATRA MTX ATRA MTX ATRA MTX ATRA MTX ATRA
1. 5973 2765 5965 2760 5950 2768 5971 2765 5978 2767
2. 5945 2770 5955 2740 5945 2779 5949 2754 5940 2770
3. 5956 2748 5950 2750 5940 2741 5950 2749 5965 2742
Mean 5957 2761 5959 2750 5947 2766 5956 2755 5953 2759
SD 13.1 11.5 12.3 10.5 10.4 14.5 9.5 9.2 15.4 12.6
Effect on Retention time S.
No
Rt Flow (-10%) Flow (+10%) pH= 2.97 pH= 3.03
MTX ATRA MTX ATRA MTX ATRA MTX ATRA MTX ATRA
1. 1.95 8.98 1.93 8.97 1.94 8.95 1.96 8.99 1.94 8.95
2. 1.93 8.97 1.95 8.95 1.92 8.92 1.94 8.95 1.92 8.96
3. 1.94 8.98 1.92 8.96 1.94 8.93 1.92 8.94 1.96 8.97
Mean 1.94 8.98 1.93 8.96 1.93 8.93 1.94 8.96 1.94 8.96
System Suitability Parameters
Table for System Suitability Test Parameters.
System Suitability Parameter Proposed Method
MTX ATRA
Retention Time (tR) 1.95 8.98
Capacity Factor (k) 0.95 7.98
Therotical plate Number (N) 2562 1535
Tailing Factor (T) 0.58 0.85
Resolution (R) 6.8
RESULTS AND DISCUSSION
RP-HPLC method for the Simultaneous estimation of MTX and ATRA
[image:11.595.165.432.312.428.2]Determination of solubility of both drugs in different solvents.
Table for Result of Solubility of Drugs in Different Solvents.
Keywords: (+++), Freely Soluble; (++), Soluble; (+), sparingly soluble; (-), insoluble.
Linearity and Calibration curve For MTX
The Linearity range of MTX 1–6µg/ml in (Table No-7.2) with correlation coefficient 0.9989.
Table for Standard Calibration data of MTX.
Sr. No. Concentration(μg/ml) *Area Under Curve(AUC)
1 0 0
2 1 657109
3 2 1115973
4 3 1809860
5 4 2416707
6 5 2990067
7 6 3600123
Denotes average of three determinations.
Solvents Solubility
MTX ATRA
0.1 N NaOH +++ +++
Water + ++
Acetonitrile ++ +++
Methanol ++ ++
Chloroform - +
[image:11.595.110.480.537.653.2]Fig. for Standard Curve for MTX Pure.
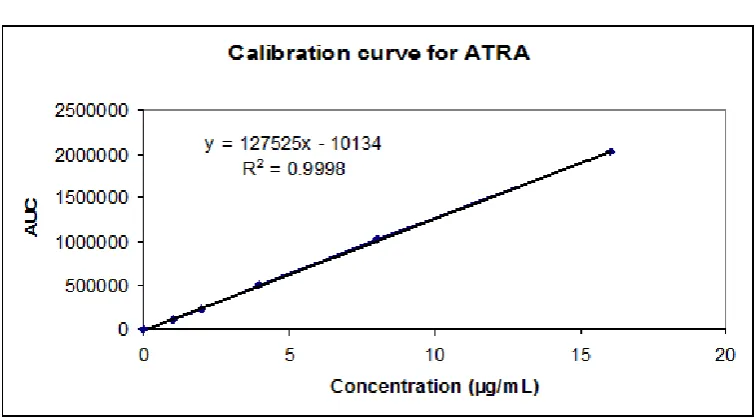
For ATRA
The Linearity range of ATRA 0–16 µg/ml in (Table) with correlation coefficient 0.9998.
Table for Standard Calibration data of ATRA.
Sr. No. Concentration(μg/ml) *Area Under Curve(AUC)
1 0 0
2 1 114123
3 2 226783
4 4 452765
5 8 913467
6 16 1825342
*Denotes average of three determinations.
DISCUSSION AND CONCLUSION
Methotrexate and Tretinoin both drugs are most commonly used drugs. Literature survey
reveals that Tretinoin and MTX are given in combination for effective management of
leukemia. The combination has shown great success rates in clinical practice. A simple,
rapid, accurate and precise Reverse Phase High Performance Liquid Chromatographic and
UV methods were developed and validated for Simultaneous estimation of Methotrexate and
Tretinoin in bulk and in pharmaceutical dosage form.
ACKNOWLEDGMENT
The authors would like to thank the personnel of medicinal chemistry research lab, Shri Ram
Group of Pharmacy for their sincere assistance to conduct this research.
REFERENCES
1. Ewing, G. W., Eds., In; Instrumental Methods of Chemical Analysis, 2nd Edn., McGraw
Hill Book company, Inc, New York, 1960; 2-3.
2. Sharma, B. K., Eds., In; Instrumental Methods of Chemical Analysis, 18th Edn., Goel
Publishing Housing, Meerut, 1999; 1-77.
3. Willard, H. H., Merritt L. L., Dean, J. A., and Settle, F. A., Eds., In; Instrumental
Methods of Analysis, 7th Edn., CBS Publishers and Distributors, New Delhi, 2001;
1,532,592-604.
4. Chatwal, G. R., Anand, S. K., Instrumental Methods of Chemical Analysis, 5th Edn.,
Himalaya Publishing House, Mumbai, 2005; 2.150-2.181.
5. Rabisankar, S., Text Book of Pharmaceutical Analysis, 2nd Edn., Rx
Publications,1.1-1.26,2.2-2.5.
6. Kasture, A. V., Mahadik, K. R., Wadodkar, S. G., and More, H. N., Pharmaceutical
Analysis- Instrumental Method, 9th Edn., Part-II, Nirali Prakashan, Pune, 2003;
6-7,10,49-50,156-159.
7. Snyder, L. R., Kirklad, J. J., Glajch, L. J., and Limbird, L. E., Eds., In; Practical HPLC
Method Development, Wiley Interscience Publishing Inc, Co., USA, 1996; 1,3,15,631.
8. M. Cociglio, D. Hillaire-Buys, C.Alric; Determination of MTX and 7-hydroxyMTX by
LC for routine monitoring of plasma levels; Journal of Chromatography B, 1995; 674:
101-110.
9. Giovanni Puglisi; Lipophilicity evaluation by RP-HPLC of two homologous series of
10.A. Zarghi, Giovanni Puglisi; HPLC determination of stability of Tretinoin in
tretinoin-minoxidil solution; Pharmaceutica Acta helvetiae, 1998; 73: 163-165.
11.Tretinoin treatment before carbon-dioxide laser resurfacing: A clinical and biochemical
analysis; American Academy of Dertatology, Inc. 2004.
12.http://www.wickepedia.com/encyclopedia/Tretinoin.
13.Quality Assurance Guide, Organization of Pharmaceutical Producer of India; Section 7.2,
1-20.
14.Validation of Analytical Procedures: Methodology, ICH Harmonized Tripartite
Guidelines, 1996; 1-8.
15.Validation of analytical Procedures Text and Methodology; U.S.F.D.A Technical Review
Guide: 2005.
16.Review Quality specifications for peptide drugs: a regulatory-pharmaceutical approach.[J
Pept Sci. 2009]Vergote V, Burvenich C, Van de Wiele C, De Spiegeleer B,J Pept Sci.
2009 Nov; 15(11): 697-710.
17.Sobhani H, Shafaati A, Nafissi-Varcheh N, Aboofazeli R. A Reversed Phase High
Performance Liquid Chromatographic Method for Determination of Rapamycin. Iran. J.