www.wjpr.net Vol 6, Issue 12, 2017. 904
DEVELOPMENT AND VALIDATION OF A METHOD FOR
SIMULTANEOUS DETERMINATION OF DAPAGLIFLOZIN AND
SAXAGLIPTIN IN A FORMULATION BY RP-UPLC
S. Madhavi* and A. Prameela Rani
University College of Pharmaceutical Sciences, Acharya Nagarjuna University, Nagarjuna
Nagar, Guntur, Andhra Pradesh, India - 522 510.
ABSTRACT
In the present study, a rapid, an accurate and precise Ultra Performance
Liquid Chromatography (UPLC) method was developed and validated
for simultaneous estimation of Saxagliptin and Dapagliflozin in its
tablet dosage form (10mg Dapagliflozin and 5mg Saxagliptin) by
selecting chromatographic parameters. The UPLC method was
developed using 2.1 × 100 mm, reverse phase C18 column (Acquity
UPLC ethylene bridge hybrid (BEH) C18 1.7 μm) with mobile phases
containing 0.1% ortho phosphoric acid and acetonitrile (40:60) as
mobile phase. Flow rate was 0.3 ml/min with PDA detection at (λmax)
254 nm and the injection volume was set at 1 μl with run time 3 min.
The method was validated by using various validation parameters like
accuracy, precision, linearity and robustness. These results show the
method could find practical application as a quality control tool for analysis of the drug in its
tablet dosage forms in pharmaceutical industries.
KEYWORDS: Saxagliptin, Dapagliflozin, UPLC, Validation, method.
INTRODUCTION
Diabetes mellitus is one of the most common medical conditions globally. The number of
people with diabetes is increasing due to population growth, aging, urbanization, increasing
prevalence of obesity and physical inactivity.
Some conventional therapies for type 2 diabetes mellitus (T2DM) fail to address the
progressive nature of the disease, Saxagliptin was approved by the US Food and Drug
Volume 6, Issue 12, 904-916. Research Article ISSN 2277– 7105
Article Received on 11 August 2017,
Revised on 31 August 2017, Accepted on 21 Sept. 2017
DOI: 10.20959/wjpr201712-9703
8533
*Corresponding Author
S. Madhavi
University College of
Pharmaceutical Sciences,
Acharya Nagarjuna
University, Nagarjuna
Nagar, Guntur, Andhra
www.wjpr.net Vol 6, Issue 12, 2017. 905
Administration in July 2009 and by the European Medicines Evaluation Agency in October
2009 for use as monotherapy or in combination regimens for the treatment of type 2 diabetes
mellitus.[1]
Saxagliptin monohydrate is a white to light yellow or light brown, non-hygroscopic,
crystalline powder. Saxagliptin is a competitive dipeptidyl peptidase‐4(DPP4) inhibitor that
slows the inactivation of the incretin hormones, thereby increasing their bloodstream
concentrations and reducing fasting and postprandial glucose concentrations in a
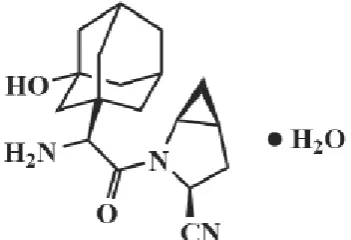
glucose-dependent manner in patients with type 2 diabetes mellitus. Chemical name is
(1S,3S,5S)-2-[(2S)-2-amino-2-(3-hydroxy-1-adamantyl)acetyl]-2-azabicyclo [3.1.0]
[image:2.595.210.386.311.431.2]hexane-3-carbonitrile.[2] The chemical structure of Saxagliptin was shown in Figure.1.
Fig 1: Chemical structure of Saxagliptin.
Dapagliflozin is a white to half white crystalline powder which is soluble in water, ethanol,
methanol and dimethyl formamide. It is a highly selective, orally active and reversible
inhibitor of the human Sodium-Glucose Co-Transporter 2 (SGLT2), the major transporter
responsible for the renal glucose reabsorption. It improves glyceamic control in patients with
Type 2 Diabetes Mellitus by inhibiting the Sodium-Glucose Co-Transporter 2, intern by
reducing glucose reabsorption. Dapagliflozin’s mechanism of action is complementary to and
different from the mechanisms of currently available antidiabetic drugs as it involves the
direct and insulin independent elimination of glucose by the kidney. Dapagliflozin selectively
block for SGLT2 over SGLT.[3] It is chemically known as (1s)-1,
5-anhydro-1-C-[4-chloro-3-[(4-ethoxyphenyl) methyl] phenyl]-D-glucitol. The chemical structure of Dapagliflozin was
www.wjpr.net Vol 6, Issue 12, 2017. 906 Fig. 2: Chemical structure of Dapagliflozin.
The literature survey reveals that several analytical methods are reported for quantitative
estimation of Saxagliptin alone and in combination with other anti-diabetic agents.[4-13]
Several analytical methods are also reported for quantitative estimation of Dapagliflozin.[14-20]
On 28 February 2017, US Food and Drug Administration (FDA) has approved once
-daily Qtern (10mg Dapagliflozin and 5mg Saxagliptin) for the treatment of type-2
diabetes. The new medicine is indicated as an adjunct to diet and exercise to improve
glycaemic (blood sugar level) control in adults with type-2 diabetes who have inadequate
control with Dapagliflozin (10mg) or who are already treated with Dapagliflozin and
Saxagliptin. So far to our present knowledge, no validated UPLC method is available for the
simultaneous estimation of Saxagliptin and Dapagliflozin in dosage form. This prompted the
present work. The aim of the present work is to develop a simple yet quick, accurate and
precise RP-UPLC method for estimation of Saxagliptin and Dapagliflozin in their marketed
formulation.
MATERIALS AND METHODS
Instruments and Apparatus
The chromatography was done on a WATERS UPLC 2695 SYSTEM equipped with
quaternary pumps, Photo Diode Array detector and Auto sampler integrated with Empower 2
Software. UV-VIS spectrophotometer PG Instruments T60 with special bandwidth of 2 mm
and 10mm and matched quartz cells integrated with UV win 6 Software was used for
measuring absorbencies of Saxagliptin and Dapagliflozin solutions.
Reagents and materials
Saxagliptin was collected as a gift sample from Aurobindo Pharmaceuticals Limited,
Hyderabad, India. Dapagliflozin was provided as a gift sample by SUN Pharmaceuticals
HPLC-www.wjpr.net Vol 6, Issue 12, 2017. 907
grade acetonitrile, methanol, ortho-phosphoric acid (OPA) purchased from Merck Ltd,
Mumbai, India were used in the study.
Preparation of solutions
Preparation of Standard stock solutions
Accurately weighed 5 mg of Saxagliptin and 10 mg of Dapagliflozin transferred to 10ml of
volumetric flasks separately. 8ml of diluent was added to both of these flasks and sonicated
for 10 minutes. Flasks were made up with diluents and labeled as Standard stock solution
1and 2 (500 µg/ml of Saxagliptin and 1000 µg/ml of Dapagliflozin).
Preparation of Standard working solution (100% solution)
1ml from each stock solution was piped out and taken into a 10ml volumetric flask and made
up with diluents (50µg/ml of Saxagliptin and 1000µg/ml of Dapagliflozin).
Preparation of marketing Sample stock solution
10 tablets were weighed and the average weight of each tablet was calculated, then the weight
equivalent to 1 tablet was transferred into a 10 ml volumetric flask, 8ml of diluent was added
and sonicated for 25 min, further the volume was made up with diluent and filtered by UPLC
filters (500µg/ml of Saxagliptin and 1000µg/ml of Dapagliflozin).
Preparation of Sample working solution (100% solution)
1ml of filtered sample stock solution was transferred to 10ml volumetric flask and made up
with diluent (50 µg/ml of Saxagliptin and 1000µg/ml of Dapagliflozin).
Buffer preparation (0.1%OPA)
1ml of ortho phosphoric acid solution taken in a 1000ml of volumetric flask, add about 100ml
of Milli-Q water and final volume makes up to 1000 ml with mill-Q water. Buffer pH
adjusted to 2.8 with triethylamine.
Diluent
Based upon the solubility of the drugs, diluent was selected, acetonitrile and water taken in
www.wjpr.net Vol 6, Issue 12, 2017. 908 Method Development
Chromatography
Chromatographic analysis was performed on Acquity uplc BEH C18 x 1.7 . The mobile
phase consists of 0.1%ortho phosphoric acid buffer: acetonitrile (40: 60 v/v) was used
throughout the analysis. The flow rate was 0.3 ml/min, the injection volume was 1.0 μl,
column temperature was 30ºC, run time 3min and detection was performed at 254 nm using a
PDA detector.
Determination of maximum wavelength for Saxagliptin and Dapagliflozin using a PDA
detector
The maximum wavelength for the Saxagliptin and Dapagliflozin were observed at 254 nm
using a UV detector in UPLC. At 254 nm both drugs were showing absorbance. Then for the
estimation of this combination we have selected 254 nm for Saxagliptin and Dapagliflozin
respectively.
Calibration curve of Saxagliptin
Aliquots of working standard solution (50μg/ml) of Saxagliptin (0.25, 0.5, 0.75, 1, 1.25 and
1.5 ml) were transferred into a series of 10 ml volumetric flasks and volume was adjusted to
the mark with diluent to get concentrations 12.5, 25, 37.5, 50, 62.5 and 75 μg/ml. Solutions
were injected into the system with stated chromatographic conditions. The graph of area of
peak obtained versus respective concentration was plotted. The mean area and its standard
deviation were calculated.
Calibration curve of Dapagliflozin
Aliquots of working standard solution (100μg/ml) of Dapagliflozin (0.25, 0.5, 0.75, 1, 1.25
and 1.5 ml) was transferred into a series of 10 ml volumetric flasks and volume was adjusted
to the mark with diluent to get concentrations 25, 50, 75, 100, 125 and 150 μg/ml. Solutions
were injected into the system with stated chromatographic conditions. The graph of area of
peak obtained versus respective concentration was plotted. The mean area and its standard
www.wjpr.net Vol 6, Issue 12, 2017. 909 Method validation
System suitability parameters
The system suitability parameters were determined by preparing standard solutions of
Saxagliptin (50 μg/ml) and Dapagliflozin (100 μg/ml) and the solutions were injected six
times and the parameters like peak tailing, resolution and USP plate count were determined.
Linearity
Linearity was demonstrated from 25% to 150% of standard concentration using minimum six
calibration levels (25%, 50%, 75%, 100%, 125% and 150%) for both the title drugs. The
method of linear regression was used for data evaluation.
Accuracy
The accuracy of an analytical method expresses the nearness between the reference value and
found value. The accuracy of the method was measured in triplicate at three concentration
levels, i.e. 50%, 100% and 150% of standard solutions of Saxagliptin and Dapagliflozin.
LOD and LOQ
Increasingly dilute solution of each drug was injected into the chromatograph and signal to
noise (S/N) ratio was calculated at each concentration. The limit of detection (LOD) & limit
of quantitation (LOQ) was calculated on the basis of signal to noise ratio of 3:1 and 10:1
respectively.
Robustness
Robustness of the method was determined to ensure its capacity to remain unaffected by
small deliberate variation in the method parameters such as a mobile phase ratio, temperature
of the column and flow rate of the mobile phase.
Forced degradation studies
A thorough verification of method selectivity was carried out by forcing degradation studies,
also known as stress testing. They are performed to determine possible degradation products,
and confirm the ability of the developed method to detect and separate impurities, which can
possibly arise during the lifetime of an API or drug product. Stress tests are conducted in
conditions exceeding those used in accelerated stability testing. Stress studies were performed
under conditions of dry heat (thermal studies), hydrolysis (in the presence of acidic, alkaline
www.wjpr.net Vol 6, Issue 12, 2017. 910
stress condition, the blank solution stored under normal conditions. 100% sample solution
subjected to stress treatment. Hydrolytic decomposition of Saxagliptin and Dapagliflozin was
conducted at 30ºC in 2N HCl, water, and 2N NaOH. For oxidative stress studies, sample was
dissolved in 20% H2O2 and kept for one day at room temperature. A photolytic study, drug
solution was exposed to UV light for one day.
RESULTS AND DISCUSSION
System suitability
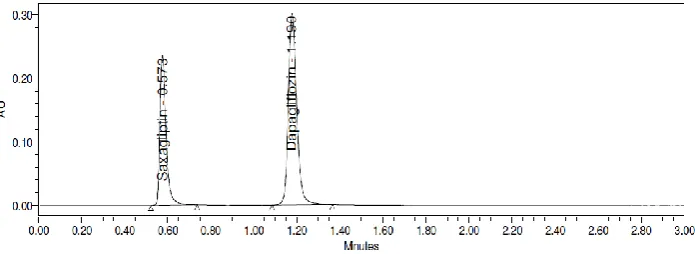
The column efficiency, resolution and peak symmetry were calculated for the standard
solutions. The peaks obtained for Saxagliptin and Dapagliflozin were sharp and have clear
baseline separation (Figure.3). It was observed from the results that the system suitability
parameters meet the requirement of method validation. System suitability and method
[image:7.595.125.473.349.476.2]validation results are summarized in Table 1.
Fig. 3: UPLC Chromatogram of standard.
Table 1: Results from system suitability studies and validation.
Parameter Saxagliptin Dapagliflozin
Theoretical plates 2173 5120
K prime (retention factor) 6.28 11.93
Tailing factor 1.52 1.25
Linearity (r2) 0.9987 0.9996
% RSD for Accuracy 0.54** 0.98**
% RSD for repeatability and intra day precision 0.69* and 0.4* 0.4* and 0.5*
LOD 0.13 µg/ml 0.53 µg/ml
LOQ 0.38 µg/ml 1.59 µg/ml
*Results are mean of six injections.
www.wjpr.net Vol 6, Issue 12, 2017. 911 Linearity
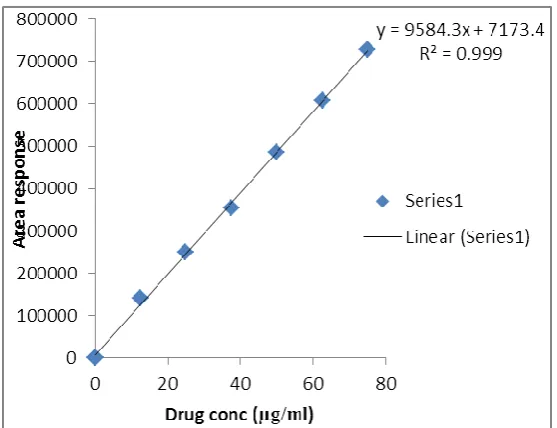
The calibration curves plotted for Saxagliptin and Dapagliflozin were linear over the
concentration range of 12.5-75 µg/ml for Saxagliptin, 25-150 µg/ml for Dapagliflozin (Figure
4 and 5). Peak areas were plotted against concentrations and linear regression analysis
performed for the resultant curve. The correlation coefficient values of Saxagliptin and
[image:8.595.159.438.207.421.2]Dapagliflozin are 0.998 and 0.9996. The results are summarized in Table.2.
Fig. 4: Linearity curve for Saxagliptin.
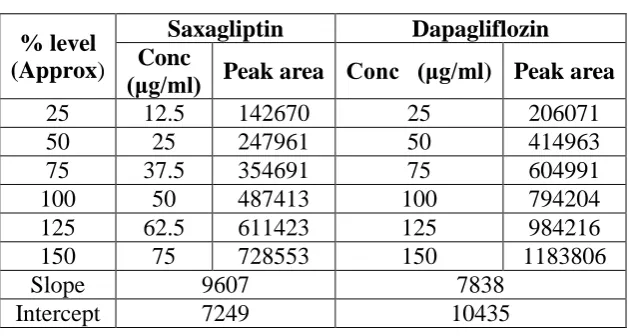
[image:8.595.154.442.459.652.2]www.wjpr.net Vol 6, Issue 12, 2017. 912 Table 2: Linearity table for Saxagliptin and Dapagliflozin.
% level (Approx)
Saxagliptin Dapagliflozin
Conc
(μg/ml) Peak area Conc (μg/ml) Peak area
25 12.5 142670 25 206071
50 25 247961 50 414963
75 37.5 354691 75 604991
100 50 487413 100 794204
125 62.5 611423 125 984216
150 75 728553 150 1183806
Slope 9607 7838
Intercept 7249 10435
Precision
The precision of an analytical method gives information on the random error. It expresses of
agreement between a series of measurements obtained from multiple sampling of the same
homogeneous sample under prescribed conditions. The percentage RSD values for the
precision study was 0.8%, 0.3% (inter-day precision) and 0.5%, 0.5% (intra-day precision)
for Saxagliptin and Dapagliflozin respectively. This is confirming good precision of the
method.
Accuracy
Accuracy of the proposed method was determined by analyzing Saxagliptin and
Dapagliflozin samples spiked at three different concentration levels in triplicate. To find out
the accuracy a known amount of standard drug was added to the fixed amount of
pre-analyzed sample solution at three different concentration levels in triplicate. Percent recovery
of the drugs was calculated by comparing the area before and after the addition of the
standard drug. Percent recovery of Saxagliptin ranged from 99.62% to 100.94% and for
Dapagliflozin 98.71% to 101.28% showing better accuracy of the method.
LOD and LOQ
www.wjpr.net Vol 6, Issue 12, 2017. 913 Fig. 6: UPLC chromatogram for Limit of detection of Saxagliptin and Dapagliflozin.
Fig. 7: UPLC chromatogram for Limit of quantitation of Saxagliptin and Dapagliflozin.
Robustness.
No significant effect was observed on system suitability parameters such as theoretical plates,
purity angle, and purity threshold, when small but deliberate changes were made for
chromatography conditions such as change in flow rate (± 5%) and organic content (± 2%).
The results are summarized in Table.3.
Table 3: Robustness Data For Saxagliptin And Dapagliflozin
Condition Saxagliptin Dapagliflozin
RT Peak Area %RSD RT Peak Area %RSD
Flow rate (-) 0.2ml/min 0.63 458503 1.1 1.29 702582 1.5
Flow rate (+) 0.4ml/min 0.52 319300 0.6 1.07 545350 0.5
Mobile phase (-) 40B:60A 0.57 610805 1.4 1.1 916459 1.5
Mobile phase (+) 50B:60A 0.58 619610 1.2 1.24 920030 1.1
Temp (-)250C 0.58 475897 0.9 1.21 796539 1.5
www.wjpr.net Vol 6, Issue 12, 2017. 914 Forced degradation studies
The specificity of the method was also evaluated by the forced degradation study. The peak
purity angle is smaller than that of peak threshold angle means there was no interface with the
analyte peak from degradation products. Major degradation occurred for Saxagliptin and
Dapagliflozin under acid hydrolysis condition up to 4.54 % and 3.54% respectively.
Table 4: Degradation data of Saxagliptin and Dapagliflozin.
Type of
degradation
Saxagliptin Dapagliflozin
Area %Recovered %Degraded Area %Recovered %Degraded
Acid 465326 95.46 4.54 760149 96.46 3.54
Base 469298 96.27 3.73 761241 96.59 3.41
Peroxide 480905 98.65 1.35 766548 97.27 2.73
Thermal 482115 98.90 1.10 781928 99.22 0.78
UV 485827 99.66 0.34 782067 99.24 0.76
Water 487062 99.66 0.34 783912 99.47 0.53
CONCLUSION
A rapid and robust method for the analysis of Saxagliptin and Dapagliflozin was developed
and its applicability as a method for analyzing stability was checked. The method was found
to be specific, accurate, precise and reproducible. Force degradation studies confirmed its
ability to determine stability because no interference from degradation products was
observed. Moreover, no influence from excipients was found, allowing it to be used in the
final drug product analysis. The method was also validated in accordance with ICH
requirements.
REFERENCES
1. Deanna S. Kania PharmD et al., Saxagliptin: A Clinical Review in the Treatment of Type
2 Diabetes Mellitus. Clinical Therapeutics, 2011; 33(8): 1005-1022.
2. Pravin Kumar, R., Vasudevan, M. and Deecaraman A Validated RP-HPLC Method for
Simultaneous Estimation of Metformin and Saxagliptin in Tablets. Rasayan Journal
Chemistry, 2012; 5: 137-141.
3. Sanagapati M, Dhanalakshmi K, Reddy NG, Kavitha B. Method Development and
Validation of Dapagliflozin API by UV Spectroscopy. Int J Pharm Sci Rev Res, 2014;
27(1): 270-2.
4. Laís Engroff Scheeren, Ana Isa Pedroso Marcolino et al, Stability indicating
RP-LC-PDA method for the quantitative analysis of saxagliptin in pharmaceutical dosage form.
www.wjpr.net Vol 6, Issue 12, 2017. 915
5. R. Kalaichelvi, E. Jayachandran. Validated spectroscopic method for estimation of
saxagliptin in pure and from tablet formulation. International Journal of Pharmacy and
Pharmaceutical Sciences, 2011; 3(3): 179-180.
6. R. Pravin Cumar, M.Vasudevan, Deecaraman. A validated RP – HPLC method for
simultaneous estimation of metformin and saxagliptin in tablets. RASAYAN J. Chem,
2012; 5(2): 197-141.
7. Nyola Narendra, Govindasamy Jeyabalan.simultaneous estimation of saxagliptin
hydrochloride and metformin hydrochloride in active pharmaceutical ingrident by
RP-HPLC. AJPRHC, 2012; 4(3): 70-77.
8. ACK. Prasanna, Kanuri Priyanka. Method development and validation of Simultaneous
determination of metformin and saxagliptin in pharmaceutical dosage form by RP-HPLC.
IJPCBS, 2015; 5(1): 381-387.
9. P. B. N. Prasad, K. Satyanaryana, G. Krishnamohan. Development and Validation of a
Method for Simultaneous Determination of Metformin and Saxagliptin in a Formulation
by RP-HPLC. American Journal of Analytical Chemistry, 2015; 6: 841-850.
10. Patil Prafulla Prakash,, Kalkotwar Ramesh.S. A new RP – HPLC method for
determination of metformin hcl and saxagliptin in tablet dosage form. IJPBS, 2012; 2(4):
161-167.
11. N.V.M.S. Bhagavanji, Prof. P.V.V. Satyanarayana, M. usein Reddy. Development and
validation of stability indicating liquid Chromatographic method for the simultaneous
estimation of metformin and saxagliptin in combined dosage form. Int. Res J Pharm.
App Sci., 2013; 3(5): 37-42.
12. Ramesh J, Dr. Senthil Kumar N. A Validated High Performance Liquid Chromatography
Method for the Determination of Saxagliptin and Metformin in Bulk and Pharmaceutical
Dosage Form, a Stability Indicating Study. IOSR-JPBS., 2016; 11(6): 92-100.
13. Mohammad Yunoos, D. Gowri Sankar. Stability indicating quantitative RP-HPLC
method development and validation for simultaneous determination of metformin
hydrochloride and saxagliptin in bulk and combined tablet dosage form. Journal of
Chemical and Pharmaceutical Research, 2015; 7(4): 346-355.
14. Gajanan Vithoba Mante, Krishna Radheshyam Gupta and Atul Tryambakrao Hemke.
Estimation of Dapagliflozin from its Tablet Formulation by UV-Spectrophotometry.
www.wjpr.net Vol 6, Issue 12, 2017. 916
15. Manasa. Sanagapati, Dhanalakshmi. K, Nagarjuna Reddy. G, Kavitha. B. Method
Development and Validation of Dapagliflozin API by UV Spectroscopy. Int. J. Pharm.
Sci. Rev. Res., 2014; 27(1): 270-272.
16. Manasa Sanagapati, Dhanalakshmi K, Nagarjuna Reddy G, Sreenivasa S. Development
and Validation of stability-Indicating RP-HPLC method for determination of
Dapagliflozin. J. Adv. Pharm. Edu. & Res., 2014; 4(3): 350-353.
17. Jitendra Debata, Sundeep Kumar, Sajal Kumar Jha. A New RP-HPLC Method
Development and Validation of Dapagliflozin in Bulk and Tablet Dosage Form. Int J
Drug Dev & Res, 2017; 9(2): 48-51.
18. Jani BR, Shah KV, Kapupara PP. Development and validation of uv spectroscopic
method for simultaneous estimation of dapagliflozin and metformin hydrochloride in
synthetic mixture. IJRDPL, 2015; 4(3): 1569-1576.
19. Jeyabaskaran. M, Prof. Rambabu. C, Dhanalakshmi. B. RP-HPLC Method Development
and Validation of Dapagliflozin in Bulk and Tablet formulation. IJPAR, 2013; 2(4):
221-226.
20. Karuna Priya Chitra, M. China Eswaraiah, M. V. Basaveswara Rao. Unique UV
spectrophotometric method for reckoning of dapagliflozin in bulk and pharmaceutical