The Economic and Social Review, Vol. 14, No. 2, January 1983, pp. 77-91
A Study of Replacement Ratios
A m o n g a Sample of Unemployed
Workersf
D O N A L P. O ' M A H O N Y *
University College, Dublin
Abstract: This study reports the findings of an examination of the actual benefits to earnings (replace
ment) ratio experience among a sample of unemployed workers. Previous Irish studies in this area have been at the macro-economic level and have estimated hypothetical replacement ratios for various categories of unemployed workers, based on an individual's dependency status and an assumed level of pre-unemployment earnings. This study points to a marked correlation between the actual replace ment ratios calculated for the sample and the hypothetical values in the earlier studies. Some of the policy implications of the findings are discussed.
here is a growing literature o n the w o r k incentive effects o f u n e m p l o y -X m e n t and similar insurance schemes. M u c h o f the empirical w o r k o n this t o p i c revolves around the impact o f the r a t i o o f u n e m p l o y m e n t benefits ( U B ) t o net income f r o m e m p l o y m e n t (usually referred t o as the replace ment r a t i o , R ) o n the d u r a t i o n o f u n e m p l o y m e n t . I n most studies R is n o t d i r e c t l y observed b u t rather calculated o n the basis o f i n f o r m a t i o n o f an individual's status and h y p o t h e t i c a l e n t i t l e m e n t t o benefits relative t o assumed levels o f earnings. T h e t w o published Irish studies are at the macro-economic level and utilise a time-series for R constructed as a weighted average o f the h y p o t h e t i c a l Rs for various categories o f u n e m p l o y e d workers (Walsh, 1 9 7 8 ;
* I would like to thank Mr. Seamus MacEoin and Ms Marian Hogan of the staff of the D u n Laoghaire Employment Exchange for their considerable assistance in the carrying out of the sample survey. I would also like to thank Professor Brendan Walsh of U C D for his comments and suggestions on the drafting of this paper. The comments of two anonymous referees were also helpful in redrafting the paper.
t T h e author was awarded the Lynch-Meenan medal for this study, which was carried out as part of a final year B . A . Course in Political Economy and National Economics at University College, Dublin.
Hughes, 1 9 8 1 ) . D o w l i n g ( 1 9 7 7 ) calculates effective tax rates defined as the r a t i o o f benefits plus income taxes t o gross income i n the same h y p o t h e t i c a l manner.
T h e calculations p e r f o r m e d o n I r i s h data using this m e t h o d o l o g y reveal high values o f R (or high effective tax rates) for most categories o f the un e m p l o y e d . T h e w o r k disincentive effects are t h e n explored using these h y p o thetical Rs i n regression analyses. These studies are open t o the o b j e c t i o n , however, t h a t actual U B paid may be considerably lower than the m a x i m a specified i n official publications o f the D e p a r t m e n t o f Social Welfare. A t k i n s o n and F l e m m i n g ( 1 9 7 8 ) have been p a r t i c u l a r l y critical o f U K studies t h a t rely heavily o n h y p o t h e t i c a l Rs t o support the claim that "a h y p o t h e t i c a l calculation o f the replacement ratio for a supposedly t y p i c a l case may provide l i t t l e guide t o the actual levels o f income o f the people actually u n e m p l o y e d " ( p . 8 ) . I f this claim is accepted, i t undermines m u c h o f the material that has been advanced as evidence o f insurance-induced u n e m p l o y m e n t .
This paper reports the results o f a survey o f a r a n d o m sample o f the registered u n e m p l o y e d i n one L a b o u r Exchange, designed t o collect data that facilitated the calculation o f actual Rs. I t w i l l be seen that the actual Rs calculated i n this manner tend t o c o n f i r m the h y p o t h e t i c a l replacement r a t i o calculations i n the manner t h a t has been used i n previous studies. These findings suggest t h a t A t k i n s o n and Flemming's criticism is n o t relevant t o the I r i s h data.
I n Section I I , h y p o t h e t i c a l replacement ratios for the Irish labour force are examined and the problems involved i n a t t e m p t i n g t o derive a single R as being representative o f the actual Rs facing the u n e m p l o y e d are discussed. I n Section I I I , measures o f the actual replacement ratios facing a sample o f u n e m p l o y e d workers are presented, and the average R derived is compared w i t h h y p o t h e t i c a l Rs used i n previous time-series studies. F i n a l l y , i n Section I V , there is a brief discussion o f the p o l i c y implications o f the study's findings.
I I H Y P O T H E T I C A L R E P L A C E M E N T R A T I O S
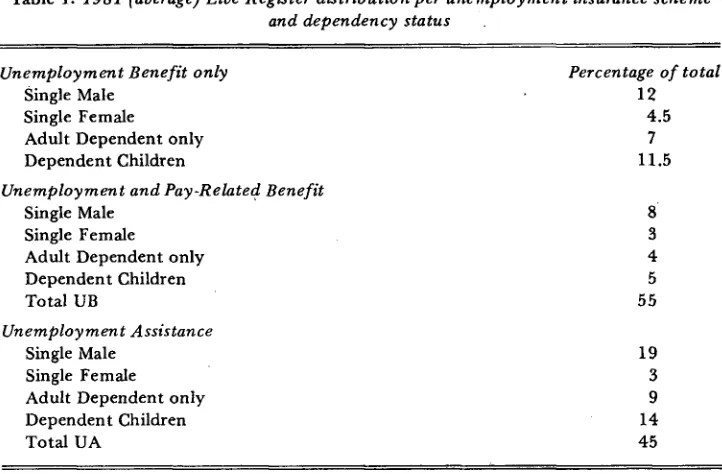
T a b l e 1: 1981 (average) Live Register distribution per unemployment insurance scheme
and dependency status
Unemployment Benefit only
Single Male Single F e m a l e
A d u l t D e p e n d e n t o n l y D e p e n d e n t C h i l d r e n
Unemployment and Pay-Related Benefit
Single Male Single F e m a l e
A d u l t D e p e n d e n t o n l y D e p e n d e n t C h i l d r e n T o t a l U B
Unemployment Assistance
Single Male Single F e m a l e
A d u l t D e p e n d e n t o n l y D e p e n d e n t C h i l d r e n T o t a l U A
Percentage of total
12 4.5 7 11.5
8 3 4 5 5 5 19 3 9 14 4 5
Source: C e n t r a l Statistics O f f i c e — M o n t h l y R e t u r n o f L i v e Register Statistics.
Table 2 calculates h y p o t h e t i c a l Rs for f o u r different categories o f claimant. I n calculating the various benefits t o earnings ratios, cognisance is taken o f the revised PRSI c o n t r i b u t i o n s together w i t h the 1 per cent Y o u t h E m p l o y m e n t L e v y announced b y the Minister for Social Welfare i n M a r c h , 1 9 8 2 , along w i t h the revised tax rates and personal allowances (including children's allowances) announced i n A p r i l 1 9 8 2 . Increases i n the levels o f u n e m p l o y m e n t benefit ( U B ) and u n e m p l o y m e n t assistance ( U A ) at that date are also taken i n t o account.
The table assumes t h a t the i n d i v i d u a l meets all requirements for the receipt o f the m a x i m u m benefits available i n each particular instance. The various w e e k l y durations o u t l i n e d i n the table reflect changing levels o f PRB w i t h the 6 7 t h week i n d i c a t i n g the individual's transfer t o U A . Where appropriate, payments o f PRB are reduced (or c u t o u t altogether) t o ensure the preser v a t i o n o f the s t a t u t o r y 85 per cent ceiling o n the benefits t o earnings r a t i o . However, i n n o case is the flat-rate benefit reduced because o f the a p p l i c a t i o n o f this r u l e .
[image:3.488.38.399.75.312.2]T a b l e 2: Hypothetical replacement ratios by earnings levels, family type and unemploy
ment duration: April, 1982
Family type Duration Weekly gross earnings while at work (£)
(weeks) 50 60 70 80 90 100 110 120 130 140
Per cent
3 - 2 7 85 v 85 85 85 85 85 85 85 85 85 2 8 - 4 0 85 85 82 79 77 75 74 73 72 72 41 - 5 3 85 81 77 75 73 70 68 67 66 65 5 4 - 66 85 77 71 70 67 6 4 62 61 60 59 67 5 8 51 4 5 41 38 35 32 30 29 27 3 - 27 1 1 3 9 4 85 85 85 85 85 85 85 85 2 8 - 4 0 1 1 3 9 4 85 85 85 85 85 85 85 83 41 - 53 1 1 3 9 4 85 85 85 85 83 81 79 77 5 4 - 66 1 1 3 9 4 85 85 85 81 78 76 73 71 67 9 8 81 70 62 57 53 50 47 4 4 4 2 3 - 2 7 129 107 92 85 85 85 85 85 85 85 28 - 4 0 129 107 9 2 85 85 85 85 85 85 83 41 - 53 129 107 92 85 85 85 85 85 85 77 5 4 - 66 1 2 9 107 9 2 85 85 85 8 4 83 80 72 67 112 9 3 80 71 65 60 5 6 53 50 42 3 - 2 7 177 148 127 111 101 9 3 88 85 85 85 28 - 4 0 177 148 127 111 101 93 88 84 85 85 41 - 53 177 148 127 111 101 9 3 88 85 85 85 5 4 - 66 177 148 127 111 101 9 3 88 85 85 85 67 1 5 3 128 109 9 6 87 81 76 71 67 64 Single
Person
C l a i m a n t w i t h D e p e n d e n t Wife
C o u p l e w i t h one C h i l d
C o u p l e w i t h f o u r C h i l d r e n
Note: F o r the purposes o f c a l c u l a t i o n , pay-related benefit was based o n i n c o m e in the tax
y e a r 1 9 8 0 / 8 1 (the relevant tax y e a r for persons c l a i m i n g u n e m p l o y m e n t benefit in 1 9 8 2 ) w i t h gross earnings for 1 9 8 2 r e d u c e d b y 15 per cent to arrive at a comparable figure for
1 9 8 1 , as r e q u i r e d .
PRE. F u r t h e r m o r e , although the average i n d u s t r i a l wage i n 1981 was about £ 1 1 5 , the table places equal l i k e l i h o o d o n the occurrence o f all possible wage levels between £ 5 0 - £ 1 4 0 . F i n a l l y , we have seen that as few as 16 per cent o f the u n e m p l o y e d p o p u l a t i o n d r a w i n g UB are i n the category o f " m a r r i e d m a n w i t h dependent c h i l d r e n " ( o f w h i c h only one-third receive PRB). A c c o r d i n g l y , the last t w o rows o f Table 2 should n o t be awarded greater significance than their weighting i n the d i s t r i b u t i o n o f the Live Register w o u l d m e r i t .
a t t e m p t at an evaluation o f m o r e realistic replacement ratios w o u l d be t o c o m b i n e , b r o a d l y speaking, the i n f o r m a t i o n supplied i n b o t h tables and, b y using weights based o n the given d i s t r i b u t i o n o f the Live Register, arrive at a single, average replacement ratio for the u n e m p l o y e d as a w h o l e . Such an a t t e m p t was made b y Walsh (1978) w h o evaluated a single R index for the p e r i o d 1954-75. T h e table has been u p d a t e d , using similar calculations, b y Hughes ( 1 9 8 1 ) .
These h y p o t h e t i c a l Rs have, as n o t e d , been criticised b y A t k i n s o n and F l e m m i n g as being possibly unrepresentative o f the actual Rs facing the u n e m p l o y e d . T h e y also suffer f r o m the defect o f t a k i n g n o account o f tax rebates or means-tested L o c a l A u t h o r i t y rents. Under our present system o f Pay-As-You-Earn ( P A Y E ) income t a x a t i o n , an i n d i v i d u a l w h o loses his j o b d u r i n g the tax year w i l l , i n all p r o b a b i l i t y , be e n t i t l e d t o a refund o f w i t h held t a x . Secondly, i n estimating the various replacement ratios, no account is taken o f the effect o f u n e m p l o y m e n t o n the rents payable b y tenants o f L o c a l A u t h o r i t y housing stock under the n a t i o n a l differential rents scheme. A b o u t one-third o f the u r b a n p o p u l a t i o n , and p r o b a b l y a m u c h higher p r o p o r t i o n o f the u n e m p l o y e d , live i n dwellings p r o v i d e d under this scheme. Given the o p e r a t i o n o f the scheme (the tenant's rent is calculated as a p r o p o r t i o n o f his assessable income f r o m all sources), the r e d u c t i o n i n i n c o m e i n going f r o m e m p l o y m e n t t o u n e m p l o y m e n t is accompanied b y a r e d u c t i o n i n the individual's l i a b i l i t y f o r differential r e n t .
A n o t h e r factor, h i t h e r t o ignored i n the calculation o f p o s t - u n e m p l o y m e n t i n c o m e , is the l u m p - s u m p a y m e n t available t o m a n y u n e m p l o y e d workers under the Redundancy Payments Scheme. The p r o p o r t i o n o f the u n e m p l o y e d w h o qualify for payments under this scheme has been g r o w i n g consistently since the i n c e p t i o n o f the scheme i n 1968. T h e e n t i t l e m e n t t o w e e k l y redun dancy payments ended i n 1979, b u t spreading the value o f the lump-sum p a y m e n t over a 52 week p e r i o d w o u l d serve to raise the benefits t o earnings ratio o f the i n d i v i d u a l . O f course, any calculation o f an individual's replace ment r a t i o ignores the possibility t h a t an u n e m p l o y e d person can supplement his U B or U A w i t h income f r o m o d d j o b s , " n i x e r s " , etc. Given t h a t t o a d m i t receiving a d d i t i o n a l i n c o m e f r o m such sources w o u l d a u t o m a t i c a l l y disqualify the i n d i v i d u a l f r o m receiving any further social welfare payments, any a t t e m p t t o allow for this variable i n a study o f Irish replacement ratios, no matter h o w comprehensive the approach, w o u l d be d o o m e d t o failure. T h e possibility o f this supplementary income for the u n e m p l o y e d should, h o w ever, be k e p t i n m i n d .1
F i n a l l y , a somewhat a r b i t r a r y adjustment c o u l d be made t o take account o f t h e individual's job-related expenses, p a r t i c u l a r l y w i t h regard t o t r a n s p o r t a t i o n costs t o and f r o m w o r k , w h i c h w o u l d , o f course, cease w i t h u n e m p l o y m e n t . I n a d d i t i o n , children's allowances c o u l d be i n c l u d e d i n b o t h the calculations o f p r e - u n e m p l o y m e n t and p o s t - u n e m p l o y m e n t " i n c o m e " . These allowances are p a i d t o those w i t h dependent children regardless o f their labour force status or i n c o m e .2 A n e x a m i n a t i o n o f the replacement ratios o f the I r i s h
u n e m p l o y e d , t a k i n g a l l o f these a d d i t i o n a l factors i n t o account, w o u l d surely give a m o r e realistic basis f o r any effort t o evaluate job-disincentives amongst the u n e m p l o y e d . There is, therefore, an obvious need t o explore actual Rs, defined t o take account o f the widest possible range o f relevant considerations, and t o compare these w i t h the h y p o t h e t i c a l Rs presented i n Table 2.
I l l A C T U A L R E P L A C E M E N T R A T I O S
A r a n d o m sample o f 224 individuals i n receipt o f either flat-rate u n e m p l o y m e n t benefit, flat-rate benefit plus pay-related, or u n e m p l o y m e n t assistance was taken f r o m the register o f u n e m p l o y e d persons i n the D u n Laoghaire E m p l o y m e n t Exchange for the week ending 1 0 t h A p r i l , 1982. The sample was stratified i n accordance w i t h the d i s t r i b u t i o n o f the Live Register i n 1981 t o ensure t h a t such a sample w o u l d be representative o f the national d i s t r i b u t i o n o f the u n e m p l o y e d . T h e E m p l o y m e n t Exchange itself was con sidered sufficiently representative, w i t h its o w n register o f a p p r o x i m a t e l y 3,000 u n e m p l o y e d i n c l u d i n g claimants f r o m such areas as Ballybrack, S h a n k i l l , Sallynoggin and D u n Laoghaire itself. I n a d d i t i o n , a r a n d o m sample o f 25 short-time workers o n the Exchange Register was also taken. O f course, i t is i m p o r t a n t t o emphasise t h a t any conclusions d r a w n f r o m a study o f this sample must have regard t o the necessarily restricted nature o f the sample. A p a r t f r o m its size, the sample related t o the Greater D u b l i n Area o n l y . Nevertheless, i t is considered that the sample is sufficiently stratified and representative t o give a g o o d general picture o f the situation and t o enable reasonable conclusions t o be d r a w n .
For each i n d i v i d u a l sampled, the disposable income before and after u n e m p l o y m e n t was calculated o n the basis set o u t i n A p p e n d i x A . T o arrive at net disposable income w h e n fully e m p l o y e d , the weekly value o f children's allowances (where payable) was added t o gross weekly earnings and the appropriate deductions made for social welfare c o n t r i b u t i o n s , income
t a x a t i o n , housing costs (rent/mortgage) and estimated j o b expenses. Net disposable income when u n e m p l o y e d was arrived at b y adding children's allowances (where payable) t o the individual's e n t i t l e m e n t t o U B and PRB ( i f applicable), or U A , as supplied b y the E m p l o y m e n t Exchange, together w i t h the weekly value o f tax-rebates or lump-sum redundancy payments
(again, i f applicable) and m a k i n g the appropriate deductions for housing and travel costs. Some o f the assumptions used i n arriving at the required replace m e n t ratios for the sample are set o u t , i n some d e t a i l , i n A p p e n d i x B . The m a i n results o f the analysis are summarised i n Table 3.
The evidence f r o m the sample suggests that, o n average, an u n e m p l o y e d person w i t h dependants suffers o n l y a slight drop i n disposable income during the first 15 m o n t h s o f u n e m p l o y m e n t compared w i t h his situation while at w o r k ; excluding short-time w o r k e r s , 14 (or 6 per cent) o f those sampled were f o u n d to be literally "better o f f o n the d o l e " . D u r i n g this period the i n d i v i d u a l m a y , o f course, have the o p p o r t u n i t y o f raising his disposable income above that o f his previous e m p l o y m e n t t h r o u g h o d d j o b s , " n i x e r s " etc. A f t e r his p e r i o d o f UB has been exhausted, the i n d i v i d u a l may then receive an inexhaustible supply o f U A at a level close t o t w o - t h i r d s o f his pre-unemployment income, w i t h , o f course, the same options for " m a l i n g e r i n g " remaining. The R value for the single person, while n o t so high i n the long r u n , is considerable i n the short t e r m , w i t h four-fifths o f pre-unemploy ment income available i n benefits t o the single female, and slightly less for
T a b l e 3: Analysis of sample survey
R (Weighted average)
Per cent
71
Fully unemployed person R Range of R Weight.
Per cent Per cent
U B Single Male 77.5 5 9 - 9 3 .20 U B Single F e m a l e 81 5 4 - 99 .075 U A Single Male 4 1 . 5 31 - 5 3 .19 U A Single F e m a l e 4 5 . 5 28 - 67 .03 U B M a r r i e d M a n 9 4 7 2 - 1 1 5 . 2 7 5 U A M a r r i e d M a n 6 2 4 9 - 9 2 .23
S h o r t - t i m e W o r k e r 121 98 - 135
Note: A l t h o u g h the sample was stratified in a c c o r d a n c e w i t h the k n o w n d i s t r i b u t i o n o f the
the single male. I n the l o n g r u n , however, U A amounts t o a l i t t l e over t w o -fifths o f the single person's pre-unemployment income.
Using weights i n accordance w i t h the data supplied i n Table 1 , the sample estimates an average replacement ratio for the Irish u n e m p l o y e d labour force o f 7 1 per cent. This actual average R can n o w be compared w i t h an average
hypothetical replacement ratio w h i c h can be estimated f r o m the i n f o r m a t i o n
given i n Table 2. Average weekly earnings i n 1981 were £ 1 1 3 . 6 9 ,3 so the
most appropriate comparison w i t h the h y p o t h e t i c a l ratios is for gross earnings o f £ 1 1 0 per week. Hence, using the weights given i n Table 3, and a p p l y i n g these t o the data i n Table 2 for a single person and a married person w i t h four c h i l d r e n , weighted average h y p o t h e t i c a l replacement ratios o f 72 per cent and 66 per cent are calculated for the periods 3-27 weeks' and 54-66 weeks' d u r a t i o n o n U B respectively. T h e h y p o t h e t i c a l figure for the d u r a t i o n category 3-27 weeks is almost i d e n t i c a l w i t h , and that o f the d u r a t i o n category 54-66 weeks is o n l y slightly less t h a n , the actual R for all durations. The empirical studies o f Walsh (1978) and Hughes ( 1 9 8 1 ) derived weighted Rs b y using the average industrial wage for males and females and assuming that u n e m p l o y m e n t had lasted f r o m 3-27 weeks. T h e i r approach, therefore, gives h y p o t h e t i c a l Rs that are highly correlated w i t h the actual Rs.
The size o f the replacement r a t i o estimated f r o m the sample for short-time workers points t o an obvious anomaly. A w o r k e r must be u n e m p l o y e d for at least three days o u t o f six in order t o be e n t i t l e d t o U B . A w o r k e r on a three-day short-time w o r k i n g week w o u l d accordingly qualify, although a w o r k e r on a four-day short-time week w o u l d n o t . Hence, the three-day short-time w o r k e r is i n receipt o f net pay for his three day w o r k i n g week plus the daily value o f u n e m p l o y m e n t and possibly pay-related benefit t o w h i c h his status entitles h i m . A benefit l i m i t is imposed b y the Department o f Social Welfare i n an effort t o stifle this financial bonanza for the short-time w o r k e r , the proviso being that the c o m b i n e d t o t a l o f gross wages, flat-rate benefit, and pay-related benefit may n o t exceed an individual's reckonable weekly earnings while in full e m p l o y m e n t . However, as before, i n no circumstances w i l l the flat-rate benefit be reduced because o f the application o f the benefit l i m i t . Hence the average replacement ratio o f 1 2 1 per cent for short-time workers in Table 3 .4
3. As given by Table 15 of the Economic Review and Outlook, Summer, 1982.
I n assessing the i m p l i c a t i o n s o f the average disposable income available d u r i n g u n e m p l o y m e n t compared w i t h disposable income w h i l e at w o r k , i t may be useful t o consider the c o m p o s i t i o n o f the p o s t - u n e m p l o y m e n t dis posable income for various categories o f claimants, as is set o u t i n Table 4 . T h e table shows that the inclusion o f b o t h the tax rebate and redundancy p a y m e n t (where applicable) i n the calculations has a small b u t none the less significant effect o n the level o f the individual's replacement r a t i o . I n the m a i n , however, the actual magnitude o f the social welfare p a y m e n t t o the recipient is, i n itself, the d e t e r m i n a n t o f the individual's R value f o l l o w i n g u n e m p l o y m e n t .
F i n a l l y , i n Table 5 we examine the c o m p o s i t i o n o f the average disposable i n c o m e o f short-time workers as a percentage o f t h e i r disposable income w h e n i n f u l l e m p l o y m e n t . I n 22 o u t o f 25 cases examined, PRB was n o t p a i d t o
T a b l e 4 : Components of sample replacement ratios
Value of Individual Components of R
Per cent UB Married Man
U n e m p l o y m e n t a n d P a y - R e l a t e d Benefit 9 7
C h i l d r e n ' s A l l o w a n c e s 4 T a x R e b a t e / R e d u n d a n c y P a y m e n t 4.5
H o u s i n g C o s t s - 1 0 . 5 O t h e r costs - 1
Total 9 4
UA Married Man
U n e m p l o y m e n t A s s i s t a n c e 6 4 C h i l d r e n ' s A l l o w a n c e s 6 H o u s i n g C o s t s - 7 O t h e r C o s t s - 1
Total 62 UB Single Man
U n e m p l o y m e n t a n d P a y - R e l a t e d B e n e f i t 75
C h i l d r e n ' s A l l o w a n c e s — T a x R e b a t e / R e d u n d a n c y P a y m e n t 8
H o u s i n g C o s t s - 4 . 5 O t h e r C o s t s - 1
Total 77.5
Note: T h e i n d i v i d u a l c o m p o n e n t s o f p o s t - e m p l o y m e n t i n c o m e are s h o w n as percentages
T H E E C O N O M I C A N D S O C I A L R E V I E W
T a b l e 5 : Composition of replacement ratio for short-time worker
Short-time worker Value of individual components of R
Per cent
G r o s s Wage
U n e m p l o y m e n t a n d P a y - r e l a t e d Benefit C h i l d r e n ' s A l l o w a n c e s
T a x R e b a t e
S o c i a l Welfare C o n t r i b u t i o n s I n c o m e T a x
H o u s i n g C o s t s O t h e r C o s t s
Total
9 3 62 4 1 - 7 - 9 - 1 7 - 6 121
the i n d i v i d u a l concerned i n accordance w i t h the benefit rule o u t l i n e d earlier. Y e t the value o f the flat-rate u n e m p l o y m e n t benefit was, o n average, almost 60 per cent o f the individual's previous disposable income (as derived f r o m A p p e n d i x A ) w h e n i n full-time e m p l o y m e n t . This figure and that o f the gross wage c o m p o n e n t o f R o f 93 per cent f o l l o w i n g the switch t o a three-day w o r k i n g week, are the m a i n reasons for the rather e x h o r b i t a n t (accord ing t o the sample) average replacement r a t i o o f 121 per cent facing the short-time w o r k e r i n I r e l a n d t o d a y .
H o w impressive one finds the arguments against the n o t i o n o f u n e m p l o y m e n t insurance ( U I ) either i n d u c i n g , or, at least, p r o l o n g i n g u n e m p l o y m e n t is p r o b a b l y h i g h l y correlated w i t h one's attitudes towards a w i d e range o f socio-economic p o l i c y issues. However, empirical evidence is far more i m p o r t a n t t h a n dogma, and, f r o m an e x a m i n a t i o n o f the available studies, the evidence w o u l d seem t o suggest that current u n e m p l o y m e n t insurance schemes t e n d t o increase b o t h the rate and d u r a t i o n o f u n e m p l o y m e n t . However, the exact order o f magnitude o f these induced u n e m p l o y m e n t effects are d i f f i c u l t t o establish w i t h any degree o f precision. F u r t h e r m o r e , even i f i t is felt t h a t the inducement effects o f a particular U I scheme are significant, the ensuing social costs must be weighted against such social benefits as income r e d i s t r i b u t i o n , etc., before any decision is taken t o alter the scheme.
Since any proposals t o reduce the induced u n e m p l o y m e n t effects c o u l d impose hardships o n some o f the u n e m p l o y e d , the t o t a l i m p a c t o f such
changes o n overall social welfare c o u l d be negative. Clearly, one w a y o f reducing j o b disincentives amongst the u n e m p l o y e d w i t h o u t p r o d u c i n g a h a r m f u l , overall negative effect, w o u l d be t o make u n e m p l o y m e n t benefits reckonable for tax purposes. This is a matter t h a t has been the focus o f m u c h p u b l i c debate i n Ireland i n recent years, w i t h the government's decision t o tax short-term social welfare benefits i n its ill-fated Budget o f February,
1982 being f o l l o w e d b y a statement b y the subsequent Minister for Finance, i n his Budget speech, t h a t "such a tax w o u l d impose an unfair b u r d e n o n many w h o are u n f o r t u n a t e enough t o be made r e d u n d a n t " .
I n Table 6, the effect o f imposing regular t a x a t i o n rates o n the range o f benefits received b y the sample p o p u l a t i o n is examined, having regard, o f course, t o the respective entitlements t o tax free allowances for the various classes o f claimants. As can be seen f r o m a comparison w i t h Table 3, the effect o f imposing n o r m a l t a x a t i o n o n the various social welfare payments had, for example, no effect whatsoever o n the R value o f those i n sole receipt o f U A , the levels o f assistance never exceeding the various tax-free allowances i n each particular case. Such a result w o u l d be socially favourable, given the general characteristics and social standing o f those i n receipt o f U A . T h e effect o n the various u n e m p l o y m e n t benefit categories, although t o all appearances negligible, was quite considerable i n some cases sampled, par t i c u l a r l y in the " m a r r i e d and o n U B " category, w i t h some reductions i n R o f up to 12 per cent; b u t , o n the w h o l e , o n l y served t o reflect the relatively l o w levels o f income (irrespective o f their e m p l o y m e n t incomes) being received b y the u n e m p l o y e d .5 A significant r e d u c t i o n i n R for short-time
T a b l e 6: Effect of tax imposition on sample replacement ratio
Fully Employed Person R Weights R as Weighted Average
Per cent Per cent
U B Single Male 75.5 .20 U B Single F e m a l e 76 . 0 7 5 U A Single Male 4 1 . 5 .19
U A Single F e m a l e 4 5 . 5 . 0 3 69 U B M a r r i e d M a n 8 9 . 2 7 5
U A M a r r i e d M a n 6 2 .23
S h o r t - t i m e W o r k e r s 1 0 3
w o r k e r s , however, ( f r o m 121 per cent t o 103 per cent) was recorded, suggest ing, perhaps, t h a t a p p l y i n g a system o f t a x a t i o n o n short-term social welfare payments w o u l d , far f r o m " i m p o s i n g an unfair b u r d e n " o n recipients, rather serve as an insurance device for the scheme against the incidence o f obviously anomalous cases arising, thereby reducing the possibility o f j o b disincentive effects occurring w i t h i n the system. I n c l u d i n g u n e m p l o y m e n t benefits in taxable income w o u l d reduce these adverse incentives and direct a large share o f the t o t a l net benefits t o families w i t h lower incomes. The yield to the Exchequer o f such an arrangement (the February, 1982 Budget estimated a y i e l d o f £10.5 m i l l i o n for the 1982 tax year) could be used very p r o f i t a b l y , and w i t h f u l l support, t o raise the levels o f assistance payments t o the longer-t e r m u n e m p l o y e d .
Such a progressive o p e r a t i o n , no matter h o w restricted its effect, w o u l d be far m o r e acceptable as a proposal towards reducing j o b disincentives in this c o u n t r y t h a n a direct attack o n the i m p l i e d subsidy t o n o n - e m p l o y m e n t for the u n e m p l o y e d person t h r o u g h either indiscriminately reducing the average benefit p a y m e n t or reducing the d u r a t i o n o f benefit entitlement. Cuts in social welfare payments t o the u n e m p l o y e d w o u l d necessarily involve hard ship for some groups, chiefly the long-term u n e m p l o y e d . The p r o b l e m w i t h u n e m p l o y m e n t insurance i n I r e l a n d , p a r t i c u l a r l y w i t h the advent o f pay-related benefit i n 1974, is that the system is regressive in nature w i t h perhaps n o t a sufficient level o f payments available for those w h o really need i t , and t o o m u c h for those w h o p r o b a b l y do n o t .
V C O N C L U S I O N
REFERENCES
A T K I N S O N , A . B . , a n d J . S . F L E M M I N G , 1 9 7 8 . " U n e m p l o y m e n t , S o c i a l S e c u r i t y a n d I n c e n t i v e s " , Midland Bank Review, ( A u t u m n ) , p p . 6-16.
D O W L I N G , B R E N D A N , 1 9 7 7 . Integrated Approaches to Personal Income Taxes and
Transfers, D u b l i n : N a t i o n a l E c o n o m i c a n d S o c i a l C o u n c i l , R e p o r t N o . 3 7 .
H M S O , 1 9 7 3 . Report of the Committee on Abuse of Social Security Benefits, C m n d . 5 2 2 8 .
H U G H E S , G E R A R D , 1 9 8 1 . Social Insurance and Absence from Work in Ire land, D u b l i n : T h e E c o n o m i c and S o c i a l R e s e a r c h I n s t i t u t e , Paper N o . 1 0 8 .
T I P P I N G , B R I A N , 1 9 8 2 . " S c r o u n g i n g i n N o r t h e r n I r e l a n d : the Beginnings of an Inves tigation", The Economic and Social Review, V o l . 1 3 , N o . 3 , p p . 2 1 7 - 2 3 2 .
W A L S H , B R E N D A N M . , 1 9 7 8 . " U n e m p l o y m e n t C o m p e n s a t i o n and the R a t e of U n e m p l o y m e n t : T h e I r i s h E x p e r i e n c e " , i n H e r b e r t G r u b e l and M i c h a e l W a l k e r (eds.)
Unemployment Insurance: Global Evidence of its Effects on Unemployment, V a n
A P P E N D I X A
I L L U S T R A T I O N O F T H E M E T H O D O F C A L C U L A T I O N O F S A M P L E R E P L A C E M E N T R A T I O S
Name Address —
Revenue and Social Insurance No. (R.S.I. No.) —
Sex Male Age 33 Marital status Married
Number of children 4 Employer —
Occupation F o r k l i f t driver
Fully employed £ Normal weekly wages (gross) 132.30
+ Children's allowances 8.25 + Other additions ( i f any) —
— PRSI 6.28 — Income tax 18.16
— Housing costs 13.50 (rent of local a u t h o r i t y or mortgage
of private house)
— Other deductions ( i f any) 4.50 N e t w e e k l y disposable income — A 9 8 . 1 1
Unemployed
Unemployment/Disability benefit 80.80*
+ Gross wage (short t i m e ) — + Pay-related benefit 9.80 + Weekly redundancy pay — + Children's allowance 8.25
+ Tax rebate 4.65 + Other additions ( i f any) —
Unemployment Assistance —
— Housing costs 11.15 — Social welfare c o n t r i b u t i o n s (short t i m e ) —
— I n c o m e tax (short t i m e ) — — Other deductions ( i f any) .75 Net w e e k l y disposable income — B 91.6
A P P E N D I X B
S O U R C E D E T A I L S O F C O M P O N E N T S O F S A M P L E R E P L A C E M E N T R A T I O S ( I N C L U D I N G U N D E R L Y I N G A S S U M P T I O N S )
Each case was analysed o n the lines o f the example i n A p p e n d i x A . T h e n o r m a l w e e k l y wages for all cases were derived f r o m Revenue records. These records also p r o v i d e d details o f i n c o m e tax paid and tax rebates received. Details o f lump-sum redundancy payments, where applicable, were supplied b y the D e p a r t m e n t o f L a b o u r . Social Welfare c o n t r i b u t i o n s and children's allowances e n t i t l e m e n t were calculated o n the basis o f A u t u m n , 1981 s t a t u t o r y rates.
For the purposes o f the calculations, those i n receipt o f u n e m p l o y m e n t assistance had their p r e - u n e m p l o y m e n t i n c o m e (earned i n 1980) updated i n value b y 15 per cent so as t o relate the resultant R values t o current wage rates.
The relevant amounts o f u n e m p l o y m e n t benefit, pay-related benefit, and u n e m p l o y m e n t assistance being received i n the cases sampled were supplied b y the e m p l o y m e n t exchange ( A p r i l , 1982 rates).
As far as housing expenses were concerned, the cases sampled were classified as living i n L o c a l A u t h o r i t y or private housing o n the basis o f their addresses and w i t h the help o f the D e p a r t m e n t o f the E n v i r o n m e n t . A p p r o x i m a t e l y 70 per cent o f those sampled were tenants, p r i n c i p a l or subsidiary, o f L o c a l A u t h o r i t y housing. For such cases the rents payable were calculated i n accordance w i t h the terms o f the Department; s 1981/82 D i f f e r e n t i a l Rents Scheme. For m a r r i e d persons i n private housing, i t was assumed that there w o u l d be a £ 2 0 a week l i a b i l i t y for rent/mortgage whether or n o t the person concerned was at w o r k . I t was assumed that single persons w o u l d be living at h o m e and w o u l d be paying one-sixth o f their i n c o m e i n r e n t , whether i n e m p l o y m e n t or n o t . Travel costs were c o m p u t e d on the basis o f the cost o f a m o n t h l y c o m m u t e r t i c k e t i n December, 1 9 8 1 , giving w e e k l y travel costs as follows:
f u l l y e m p l o y e d : £ 4 . 5 0
p a r t l y e m p l o y e d : £3.00 (3 days t o w o r k and 1 day t o the exchange) f u l l y u n e m p l o y e d : £ 0 . 7 5 (travel t o the exchange)