NBER WORKING PAPER SERIES
GLOBAL CAPITAL FLOWS AND FINANCING CONSTRAINTS
Ann E. Harrison Inessa Love Margaret S. McMillan
Working Paper 8887
http://www.nber.org/papers/w8887
NATIONAL BUREAU OF ECONOMIC RESEARCH 1050 Massachusetts Avenue
Cambridge, MA 02138 April 2002
Inessa Love acknowledges support from Social Science Research Council Program in Applied Economics with funds provided by the John D. and Catherine T. MacArthur Foundation. The views expressed herein are those of the authors and not necessarily those of the National Bureau of Economic Research.
© 2002 by Ann E. Harrison, Inessa Love and Margaret S. McMillan. All rights reserved. Short sections of text, not to exceed two paragraphs, may be quoted without explicit permission provided that full credit, including © notice, is given to the source.
Global Capital Flows and Financing Constraints
Ann E. Harrison, Inessa Love and Margaret S. McMillan NBER Working Paper No. 8887
April 2002 JEL No. F2
ABSTRACT
Firms often cite financing constraints as one of their primary obstacles to investment. Global capital flows, by bringing in scarce capital, may ease host-country firms' financing constraints. However, if incoming foreign investors borrow heavily from domestic basnks, direct foreign investment (DFI) may exacerbate financing constraints by crowding host country firms out of domestic capital markets. Combining a unique cross-country firm-level panel with time-series data on restrictions on international transactions and capital flows, we find that different measures of global flows are associated with a reduction in firm-level financing constraints. First, we show that one type of capital inflow--DFI--is associated with a reduction in financing constraints. Second, we test whether restrictions on international transactions affect firms' financing constraints. Our results suggest that only one type of restriction--those on capital account transactions--negatively affect firms' financing constraints. We also show that multinational firms are not financially constrained and do not appear to be sensitive to the level of DFI. This implies that DFI eases financing constraints for non-multinational firms. Finally, we show that DFI only eases financing constraints in the non-G7 countries.
Ann E. Harrison Inessa Love Margaret S. McMillan
University of California The World Bank Tufts University
329 Giannini Hall 1818 H St. NW Department of Economics
Berkeley, CA 94720 MC3-300 Medford, MA
and NBER Washington, DC 20433 617-627-3137
510-643-9676 202-458-0590 [email protected]
"Not all direct foreign investment around the world represents net capital flows. Often such
investments are financed in local markets."
Martin Feldstein (2000)
“There is now broad agreement about the value of direct foreign investment, which brings not just capital but also technology and training.”
Joseph Stiglitz (1998)
1. Introduction
Firms in developing countries typically cite financing constraints as one of their primary
obstacles to investment. Some argue that countries should eliminate restrictions on international
transactions and encourage incoming capital flows, especially direct foreign investment (DFI). DFI
may ease these firms' financing constraints by bringing in scarce capital. This is one reason why
policy makers in developing countries have eased restrictions on inward DFI and in many instances
provide special incentives for DFI. Yet if foreign firms borrow heavily from local banks, they may
exacerbate domestic firms' financing constraints by crowding them out of domestic capital markets.
Foreign investors may borrow on domestic capital markets for a variety of reasons, including as a
hedging device against exchange rate fluctuations or in response to artificially low domestic interest
rates. 1 Yet most observers assume that DFI is accompanied by significant capital inflows.2 There
1
Sometimes they borrow domestically as a hedging device against foreign currency debt; other times, they borrow domestically if local interest rates are low. In many developing countries, interest rates have historically been set at artificially low levels, leading to credit rationing in cases where the interest rate is set below the market clearing level.
has been almost no previous research examining the impact of DFI on host-country firms' financing
constraints.
One reason for the limited empirical evidence is the difficulty in obtaining detailed firm-level
data across countries. In this paper, we combine a firm-level panel data from Worldscope with
cross-country time-series data on restrictions on international transactions and capital flows to test whether
different measures of global flows are associated with a reduction in firm-level financing constraints.
First, we show that one type of capital inflow—DFI--is associated with a reduction in financing
constraints. Second, we test whether restrictions on capital movement affect firms' financing
constraints. Our results suggest that one type of capital control—restrictions on capital account
transactions—negatively affects firms' financing constraints. The results are robust to the inclusion of
other factors that could affect the firm’s financing constraints--such as availability of domestic credit,
business cycle effects, the country’s level of GNP per capita, and the level of financial development.
Our results suggest that one type of capital inflow—DFI--plays a beneficial role and improves on
capital allocation by diminishing the firm’s financing constraints.3
Our work is related to the large body of literature on capital market imperfections and firm
investment; an excellent survey of this literature is in Hubbard (1998). A number of papers have used
2
For example, Stiglitz in an address to the Chicago Council on Foreign Relations (1998) argues that there is broad agreement about the fact that direct foreign investment brings additional capital. Feldstein (2000) argues that this is not necessarily the case. Helleiner (1989) in a survey for the Handbook of Development Economics suggests that it is unlikely that much new equity capital will result from expanded DFI flows.
3
Our results are in contrast to Harrison and McMillan (2001) who find that financing constraints of firms in Cote d’Ivoire were exacerbated by the entrance of foreign firms, which borrowed heavily on domestic credit market and crowded out the local firms. However, this paper only includes two low-income countries, India and Pakistan, and it does not include any countries from Sub-Saharan Africa. This may be important because we would expect the domestic firms in the very
the Euler equation methodology to estimate the effect of financing constraints on investment, with
most studies concentrating on firms in developed countries.4 Surveys suggest that financing
constraints are an even more important deterrent to investment in developing countries. 5
Theoretically, capital market imperfections are likely to be more severe in these countries, which will
result in stronger financing constraints due to unavailability of external financing.6
Most empirical evidence of financing constraints in developing countries comes from studies
on individual countries, which are difficult to generalize.7 Research that links the level of financial
development to financing constraints across countries includes; Demirguc-Kunt and Maksimovic
(1998), Rajan and Zingales (1998), and Love (2001). Dimirguc-Kunt (1998) finds that firms grow
faster than they could have using only internally generated funds in more financially developed
countries. Rajan and Zingales (1998) demonstrate that industries that require more external finance
grow faster in more developed capital markets; and Love (2001) shows that firm’s investment is less
sensitive to the availability of internal funds in more financially developed countries. Recent evidence
also links financial market liberalization to investment and financing constraints across countries. For
example, Laeven (2002), finds that financial liberalization reduces firms financing constraints,
especially for small firms. Galindo, Schiantarelli and Weiss (2001) find that financial reform has led
poorest countries to be the most credit-constrained and at the same time it is likely that governments in the poorest countries implement policies to help ease these constraints such as interest rate controls.
4
See for example, Whited (1992), Hubbard and Kashyap (1992), Hubbard, Kashyap and Whited (1995), and Calomiris and Hubbard (1995) for work on US firms, Bond and Meghir (1994) for the UK firms, and Bond et al. (1996) for comparison of four developed countries: Belgium, France, Germany and the UK.
5
For example, in a recent survey of executives in 20 African countries, financing constraints were cited as a major obstacle to business expansion, see Africa Competitiveness Report (1998). However, these surveys could overestimate the degree of constraints because they are typically administered by institutions in a position to make loans, such as the World Bank.
6
to an increase in the efficiency with which investment funds are allocated. Bekaert and Harvey (2001)
and Henry (2000) find that the cost of equity capital decreases significantly after financial
liberalizations. In addition, Bekaert, Harvey and Lundblad (2001) find that equity market
liberalizations increase real economic growth by approximately 1% per year. Yet none of these
studies examines the impact of restrictions on international transactions or capital flows on firm-level
financing constraints. Since domestic financing is highly constrained in many developing countries,
this is an extremely important and overlooked issue. This paper seeks to fill this gap.
To test whether capital inflows affect firm-level financing constraints we use augmented
investment Euler equations. We modify the investment model by introducing a constraint on external
financing, which generates a shadow cost of external funds. This provides a theoretical justification
for our measure of financing constraints. In the absence of financing constraints, investment should
respond only to investment growth opportunities, which we control for with a measure of the
marginal product of capital. Therefore, the availability of internal funds should not affect current
investment. We interpret the sensitivity of investment to the availability of internal funds (measured
by the stock of liquid assets) as a proxy for the degree of financing constraints. We find that firms in
countries with greater DFI inflows have less investment-cash sensitivity, after controlling for other
factors.8
7
See for example Jaramilo et al. (1996) for Ecuador; Harris, Schiantarelli, and Siregar (1994) for Indonesia; Gelos and Werner (1999) for Mexico; Patillo (2000) for Ghana; Harrison and McMillan (2001) for Cote d’Ivoire; and Bigsten et al (2000) for several African countries.
8
Since we are not able to identify the firms that are getting the DFI, our results suggest that the average constraints are decreasing in the country-year with high DFI. We partially address this problem in section 5 with the sample splits on domestic vs. multinational firms.
We also test for the impact of restrictions on international transactions on firm-level financing
constraints. Lewis (1997) explores the relationship between income and consumption growth, using
aggregate data in a cross-country framework. Using an Euler equation for consumption, she argues
that the relationship between domestic income and consumption should be weak if individuals are not
credit constrained. In particular, she shows that individuals are more credit constrained in countries
with restrictions on international transactions. Our framework tests for the impact of restrictions on
international transactions on firms (as opposed to individuals). Our results for firms support her
results for individuals. Firms are more financially constrained in countries that impose controls on
capital account transactions. Unlike Lewis (1997), however, we find that other types of
controls--such as import surcharges or surrender requirements for exporters--have no impact on individual
firm’s financing constraints.
We also focus on which types of firms are most likely to benefit from capital inflows.
Although we are unable to directly identify which firms receive DFI, we address this question by
splitting the sample into firms with foreign assets abroad (multinationals) and domestic enterprises
with no foreign assets. We find that multinational firms, which are more likely to have access to
international capital markets, are not financially constrained and are not affected by the level of DFI.
We also examine whether our results vary across different countries. We show that DFI only eases
firm-level financing constraints in non-G7 countries. This is not surprising. We would expect DFI to
have the largest effects in countries where credit market imperfections are most important, which are
The remainder of this paper is organized as follows. Section 2 outlines the general approach used for
testing for financing constraints and the impact of DFI. Section 3 describes the data. Section 4
presents results of the estimation of the basic model, focusing on DFI inflows, and does robustness
checks. Section 5 examines the impact of restrictions on international transactions on credit
constraints and Section 6 presents extensions and Section 7 concludes.
2. Testing for Financing constraints and the Impact of Global Flows: The Framework
Numerous studies have used the Q-theory of investment to study financing constraints (see,
for example, Hubbard, Fazzari and Peterson (1998)). Although the Q-theory and Euler model of
investment come from the same optimization problem (the two models are just different ways to
rearrange the first order conditions), the assumptions required to estimate the Q-model are stronger
then those required to estimate the Euler equation model. The main difficulty with implementing the
Q-theory is finding a proxy for the unobservable marginal q. Average q is equal to marginal q under
perfect competition and linear homogeneity in technology (see Hayashi (1982)). However, even if
these conditions are met, imperfections in capital markets will cause the divergence between stock
market valuations and the true manager’s valuation of the marginal return on capital. The assumption
of perfect capital markets is the most problematic in our cross-country study as our countries are
significantly different in their levels of financial development (and therefore the degree of market
imperfections). In addition, numerous recent papers highlight additional problems with the
Q-methodology such as severe measurement error and identification problems ( see Kaplan and
Zingales (2000), Erikson and Whited(2000), Bond and Cummins (2001) and Gomes (2001)).
2.1 The Optimization Problem
A dynamic model of firm value optimization is reproduced in this section. This model is
similar to models estimated in previous studies (see references in footnote 4) and follows closely the
specification in Gilchrist and Himmelberg (1998).9 In this model shareholders (or managers)
maximize the present value of the firm, which is equal to the expected discounted value of dividends
subject to the capital accumulation and external financing constraints. The firm value is given by:
{ }
(1.d)
0
(1.c)
)
1
(
(1.b)
)
,
(
)
,
(
:
)
a
.
1
(
max
)
,
(
1 1 1 0≥
+
−
=
−
−
Π
=
+
=
+ ∞ = + − +∑
∞ = + t t t t t t t t t t s s t s t t t I t t tD
I
K
K
I
K
I
C
K
D
where
D
E
D
K
V
s s tδ
ξ
β
ξ
Here Dt is the dividend paid to shareholders and is given by the "sources equal uses" constraint (1.b);
ßt+s-1 is a discount factor from the period t+s to period t. In the capital accumulation constraint (1.c),
Kt is the beginning of the period capital stock; It is the investment expenditure and δ is the
9
The resulting Euler equation for investment (given in (2) below) is identical to the Euler equation for investment in Gilchrist and Himmelberg (1998). However, we estimate this Euler equation directly instead of implementing the VAR methodology of Gilchrist and Himmelberg. Our model does not include the possibility of debt financing. Formally including debt into the problem results in a separate Euler equation for debt. However, the Euler equation for investment, which is the focus of our paper, is not affected by adding debt into the model, and so we ignore debt financing for the sake of simplicity.
depreciation rate.10 The restricted profit function (i.e. it is already maximized with respect to variable
costs) is denoted by Π(Kt, ξt), where ξt is a productivity shock. The adjustment cost of investment is
given by the function C(It, Kt), and is assumed to result in a loss of a portion of investment. The
financial frictions are introduced via a non-negativity constraint on dividends (1.d), and the multiplier
on this constraint is denoted λt in the discussion below. This multiplier is interpreted as a shadow cost
associated with raising new equity, which implies that external (equity) financing is costly and this
extra cost is due to information or contracting costs.11 This shadow cost is used in defining financing
constraints, which are discussed below.
2.2 The Euler Equation
The first-order conditions to the above maximization problem are rearranged to obtain the
following Euler equation:
t t t t t t t t t where E λ λ δ β + + = Θ ∂ ∂ + − + ∂ Π ∂ Θ = ∂ ∂ + + + + 1 1 (2) I C 1 ) 1 ( K I C 1 1 1 1
Here, (∂C/∂I) is the marginal adjustment cost of investment, (∂Π/∂K) is the marginal profit of capital,
i.e. the contribution of an extra unit of capital to the firm's profits, further referred as MPK. Ignoring
Θt, the intuition behind this Euler equation is that the marginal cost of investing today on the left hand
10
We ignore the price of investment, which is replaced by fixed and time effects in the estimation. We also ignore tax considerations due to data constraints.
11
Several influential papers addressed the sources of information- or contracting-related frictions in detail (for example, Jensen and Meckling (1976), Myers and Majluf (1984), Hart (1995) and others). Here, these frictions are exogenous to the firm and are represented by the shadow value of external finance. Another possible way to introduce financial frictions is
side (given by the adjustment cost and the price of investment goods, normalized to one) is equal to
the discounted marginal cost of postponing investment until tomorrow, on the right hand side. The
latter is equal to the sum of the foregone marginal benefit of an extra unit in capital, given by MPK,
plus the adjustment cost and price of investment tomorrow (again normalized to one).
To arrive at the empirical model, one must identify empirical measures for financing
constraints and MPK, specify a functional form for adjustment costs, linearize the Euler equation and
eliminate the expectation operator. These issues are addressed in the subsections below.
2.3 Financing Constraints
At the heart of the financing constraints theory is the factor Θt, which is the relative shadow
cost of external finance in periods t and t+1. If the shadow cost of external funds is higher in period t
than it is expected to be in period t+1 (i.e. λt>λt+1), then Θt <1 and it acts as an additional discount
factor which makes current period funds more expensive to use than the next period funds and
therefore induces the firm to postpone or reduce its investment. In this case we say that the firm is
"financially constrained," and Θt is the (degree of) financing constraints.12 With perfect capital
markets λt=λt+1=0 for all t and hence Θt =1 and the firm is never constrained. With capital-market
imperfections, λt depends on a vector of state variables, including the productivity shock ξt.
Therefore, λt is time-varying and could be identified with some observable firm characteristics.
by exogenously limiting the amount of debt that the firm can raise at any point in time, as in Whited (1992). This will create a shadow value of debt, which has the same effect in the investment equation as the shadow value of equity.
Several observable characteristics of the firm's financial health have been used as proxies for
financing constraints. The most commonly used variable is cash flow. The problem with cash flow is
that it is closely related to operating profits and therefore also to MPK and will measure investment
opportunities rather than, or in addition to, measuring the availability of internal funds.13
As an alternative measure of internal funds, we use the stock of liquid assets, specifically the
stock of cash and marketable securities scaled by total assets (hereafter referred to as cash stock).14
The cash stock has an intuitive interpretation as "cash on hand" that firms can use for investment if
the opportunity presents itself. One theoretical justification for the cash stock measure appears in the
Myers and Majluf (1984) model, where the amount of cash holdings, which the authors call "financial
slack," has a direct effect on investment in the presence of asymmetric information. This slack allows
firms to undertake positive NPV projects, which they would pass up if they did not have any internal
funds. This implies that if external financing is costly, there will be a positive relationship between
investment and cash stock. This is the relationship explored in this paper.
Unlike the cash flow measure, the cash stock proxies for future growth opportunities only in
the presence of financing constraints. Since holding cash is costly to firms (because it diverts
resources from productive use and offers zero return), firms will accumulate cash stock only if they
12
If, on the other side, Θt >1, the firm expects to be more constrained tomorrow (time t+1) than it is today and at time t its
investment will be unconstrained. In this case the firm is more likely to invest at time t, since the discount factor β is increased by the amount Θt (i.e. the interest rate is lowered).
13
See for example Gilchrist and Himmelberg (1998) and Hubbard (1998) for a discussion.
14
Similar measures of financing constraints have been used before: Calomiris, Himmelberg and Wachtel (1995) used financial working capital and Gilchrist and Himmelberg (1998) used cash equivalents. Alternatively, Whited (1992) used debt to assets and interest coverage as proxies for financing constraints.
expect to be financially constrained in the future. Evidence consistent with this hypothesis is
presented in Opler et al. (1999), among others.15
We measure financing constraints by the sensitivity of investment to cash stock. We argue
that the larger this sensitivity, the more constrained the firm is because it has to rely on its internal
funds to finance its investment. The primary goal of this paper is to determine whether capital
inflows (in particular, DFI) or restrictions on international transactions have an impact on firm-level
financing constraints. This will be reflected in the effect of capital inflows or controls on the
investment-cash sensitivity. For example, to test the hypothesis that financial constraints are affected
by DFI, we allow the investment-cash sensitivity to depend on the country-year inflows of DFI, and
hence our proxy for financing constraints is given by:
Θit =a0i+(a1+a2DFIct)Cashit-1 = a0i+a1Cashit-1 +a2DFIctCashit-1 (3)
Here a0i is a firm-specific level of financing constraints (which enters into the fixed effects) and
Cashit-1 is the cash stock scaled by the total assets.16 The focus of our paper is on the interaction of
DFI and Cash, i.e. coefficient a2. A negative sign suggests that direct foreign investment reduces the
sensitivity of investment to the availability of internal funds (i.e. financing constraints) and a positive
sign would be an indication of "crowding out".
15
Kim et al. (1998) and Calomiris, Himmelberg and Wachtel (1995) also find that firms with lower costs of external finance maintain lower levels of financial working capital. Despite the growing empirical evidence on the "precautionary savings" by financially constrained firms, this hypothesis still remains controversial, see for example Kaplan and Zingales (1997); their view is disputed in Fazzari, Hubbard and Petersen (2000).
16
We assume that the firm makes its decision for period t investment at the beginning of that year (or, equivalently, the end of previous year). Therefore the appropriate timing of the cash stock is t-1, because the investment decision depends on how much cash a firm has before starting the investment.
2.4 Measuring MPK, Adjustment cost and Linearization
To formulate the empirical model we define the proxies for the MPK and adjustment costs. We
use a measure of MPK that is derived from profit maximization under the assumption of the
Cobb-Douglas production function, given by
K
S
MPK
kµ
α
=
(4)where (S/K) is a sales to capital ratio, αk is the capital share in the production function and μ is a
markup. We prefer to use the sales-based measure because it is less correlated with cash flow than
the alternative operating profits measure.17
We assume a quadratic adjustment cost function, which results in a linear marginal adjustment
cost of investment:
)
(
1 i it it itK
I
g
K
I
I
C
ν
α
−
−
=
∂
∂
− (5)This adjustment cost function is slightly more general than the one used in the traditional models
because it includes the lagged investment to capital ratio with an additional parameter g which is
added to capture strong persistence in investment to capital ratios present in the data.18
17
See Gilchrist and Himmelberg (1998) for derivation of the sales-based MPK measure and the arguments against using the operating profits measure of MPK. Unfortunately we do not have direct measures for αk and μ on the firm level,
however we rely on the fixed effects to capture these important firm-dependent characteristics.
18
This extended functional form allows for the more common form with g=0, which could be tested empirically. The intuition for this added term is that it may be easier for the firm to continue investment at some fraction g of the previous period ratio, since, for example, it has hired workers or made some other arrangements which would be costly to cancel. Parameter νi could be interpreted as some firm-specific level of investment at which adjustment costs are minimized.
To simplify the estimation and interpretation of the coefficients, we linearize the product of βt,
Θt and the marginal benefit of investment (expression in curly brackets in (2), here denoted as {.}t)
using a first-order Taylor approximation around the means given by (ignoring constant terms):
βt Θt {.}t = bγΘt + b{.}t + γβt (6)
where γ is the unconditional mean of the expression in curly brackets, and b is the average discount
factor. 19
Finally, we assume rational expectations, which allows us to replace expectations with realized
values plus an expectation error eit, which is orthogonal to any information available at the time when
the investment decision is made.
2.5 Empirical Model and Estimation
We substitute (3), (4) and (5) into Euler equation (2) use linearization in (6) and replace the
expectation with the realization plus an error term to obtain the empirical model:
it i ct ct it it it it it it e f DFI DFI Cash Cash K S K I K I K I + + + + + + + = − − − +1 2 1 3 4 1 5 1 6 1 β β β β β β (7)
Here, fi denotes fixed effects, which capture firm-specific parameters for adjustment cost νi , MPK,
and for financing constraints a0i.20 We focus on the coefficient β5, the interaction of the level of cash
19
Since Θt could be above or below one we assume that its mean is equal to one. 20
In addition, fixed effects capture the omitted terms that contain prices of investment goods and the conditional
covariance of financing constraints and marginal benefit of investment are replaced by the combination of time and fixed effects. Third, the fixed effects capture a sample selection bias if the firms included in the sample have different
stock (a firm-level variable) with the level of DFI inflows, other inflows or restrictions on
international transactions (all are country-level variables). If DFI reduces firms’ financing constraints,
this coefficient should be negative, which implies that the total sensitivity of investment to cash stock
(given by the sum of β4 +β5DFI ) is reduced with DFI inflows. The coefficient β4 measures the
sensitivity of investment to cash stock in an average country-year. With zero DFI inflows, it is
expected to be positive.
We use the same framework to test for the effect of restrictions on international transactions
by replacing the DFI measure in (7) with measures of restrictions on international transactions. We
also add additional interactions of the cash stock with the control variables of interest (such as
financial development, GDP growth, GNP per capita, and M2) to the model in (7) to test if the DFI
effect (on the cash coefficient) is robust to controlling for other potential effects on financing
constraints.
The first issue in estimating this model concerns the presence of fixed effects. The fixed
effects are correlated with the regressors because the model contains lags and leads of the dependent
variable, therefore they need to be removed before the estimation. Because the regressors are not
strictly exogenous (as discussed above), the commonly used mean-differencing procedure will result
in biased estimates. To remove fixed effects we use a forward mean-differencing transformation,
which removes only the forward mean, i.e. the mean of all the future observations available for each
firm-year. This transformation is otherwise known as orthogonal deviations or the Helmert
transformation and is described in Arellano and Bover (1995) and Bond and Meghir (1994). Unlike
investment policy than the rest. In some robustness checks we also experimented with including country-time dummies (and dropping FDI in levels) and obtained similar results.
the first-differencing, the forward mean-differencing preserves the error structure and therefore does
not require any correction for the serial correlation in the error terms. We use heteroskedasticity
robust estimates of the standard errors, which are “clustered” by the firm (i.e. do not require an
assumption of the independence of errors within the firm).
As discussed above, the expectation error eit is orthogonal to the information available at the
time when the investment decision is made. We assume that the investment decision for year t is
made at the beginning of that year (which is equivalent to end of year t-1). Therefore, the information
available at the time of decision is dated t-1 since year t information does not arrive until the end of
year t. Then, the orthogonality conditions for this model are given by E[eit|xit-s]=0 for s≥1, which is
equivalent to the assumption that the regressors are predetermined, rather then strictly exogenous.21
After the forward mean-differencing, the transformed errors are still orthogonal to the
untransformed original variables dated t-s, where s≥1. Therefore, we use the GMM procedure,
implemented as IV (instrumental variables), with t-1 and t-2 lags of instruments.22 The instruments
are all the variables in the regression, plus cash flow, cost of goods sold, and the interactions of cash,
sales and investment with DFI and other variables of interest (see Table A2 for variable definitions).
Our instruments include lagged DFI, and we also allow for the endogeneity of current DFI. This is
important if current flows and current investment are simultaneously determined.
3. Data
21
This means that the future values of the regressors are allowed to be correlated with the current realization of the error term, (for example sales to capital is clearly related to the current realization of investment error term), while the past realization are strictly orthogonal to the current error term.
All firm level data come from the Worldscope database, which contains data on large publicly
traded firms in which there is an investor interest. The firm data are available for 40 countries and
cover over 7000 firms for the years 1988-1998 (however, the years before 1991 and the year 1998
have fewer observations). Details are given in Appendix 1. The coverage within countries varies
widely from as little as 1% of all listed domestic firms included (for India) to as many as 82% (for
Sweden), as calculated by La Porta, Lopez-de-Silanes, Shleifer, and Vishny (1997). Table A.1 gives
the list of countries in the sample with the number of firms and observations per country.
The number of firms in each country varies widely across the countries, and the less
developed countries are under-represented. This creates a problem with pooled cross-country
estimation as over-represented countries may influence the coefficients in a non-systematic way. To
correct for this problem we rerun all main results including only the150 largest firms in each
country.23 In addition we also employ a weighting procedure with each observation assigned a weight
inversely proportional to the number of observations available for that country. This weighting is
used as an alternative way to balance the sample and it produces similar results.
22
Using GMM with efficient weighting matrix instead of identity weighting matrix (which is equivalent to an IV procedure) produces similar results. However, the advantage of IV procedure is in allowing the “cluster” option for calculation of the standard errors, which controls for the free-form heteroskedasticity on the firm level.
23
We rank companies by their relative size of PPENT (fixed capital) in each year for each country (using total assets in US dollars produces similar results). This procedure creates firm ranks that are different for each year. We use these ranks and in addition we use the ranks that are averaged across all years for each firm, which creates an average firm rank that does not change from year to year. Both ranks produce similar results. We also experimented with different cutoff points, such as 50, 100, 200 or 300 firms and all the sub-samples produced results equivalent to the ones reported.
The main firm-level variables are investment and sales, scaled by the beginning of the period
capital,24 and cash stock, which is the stock of cash plus marketable securities scaled by total assets.
Variable definitions are given in Table A2. We supplement the firm-level data with country-level
data on capital inflows, including portfolio investment, private capital flows, and direct foreign
investment. The capital flow data are taken from the IFS publication Balance of Payments Statistics.
Our main capital flow variable is inflows of DFI, which we scale by aggregate gross domestic
investment (GDI) and alternatively by GDP. In addition we look at net DFI, defined as inflows minus
outflows; portfolio investment (both inflows and net flows); and “other” flows. Other flows consist
mainly of commercial bank loans but also include any other private flows which are neither portfolio
investment or DFI. Our data on restrictions on international transactions are described in section 5.
For robustness checks we add the growth rate in real GDP, real GNP per capita, the stock of liquid
liabilities scaled by GDP (M2) and credit to private sector by deposit money banks and non-financial
institutions; all supplementary data come from IFS. As an additional robustness check we add a
country-level measure of financial development, constructed using indicators developed by
Demirguc-Kunt and Levine (1996). This measure combines five indicators of financial development:
market capitalization over GDP (i.e. the size of the stock market), total value traded over GDP, total
value traded over market capitalization, the ratio of liquid liabilities to GDP and the credit going to
the private sector over GDP. Each indicator is standardized to have mean zero and variance one, after
which the indicators are averaged to produce a standardized index with mean zero and variance one.
24
The model requires one to use the beginning of the period capital stock as a scaling factor for calculating adjustment costs and MPK. One alternative is to use lagged capital stock (i.e. period t-1 used as the beginning of the period t capital stock). However, this would not be appropriate if there are mergers, acquisitions, divestitures or other capital-changing events, which are hard to identify. We use the approximate value given by the ending period capital, minus investment and depreciation in that year, which is more robust to the capital-changing events, as discussed in Love (1999).
Table A.3 reports means of the key variables over the sample period 1988-1998. The first
three columns are capital flow variables scaled by gross domestic investment. All three variables are
taken from the International Monetary Fund's publication International Financial Statistics. Direct
foreign investment occurs when foreign ownership exceeds ten percent of the total equity of the firm.
Investments of less than ten percent are considered portfolio investment. Inflows other than DFI and
portfolio include primarily bank loans (public and private). GNP per capita is in U. S. dollars in 1994
from the World Development Report, 1996. The remaining three variables are also from the IFS and
are defined as follows:M2 is the stock of liquid liabilities of the financial system scaled by GDP,
domestic credit is the ratio of credit allocated to the private sector by depository institutions scaled by
GDP and GDP growth is the annual real growth rate of GDP.
The means in Table A.3 indicate that the countries with the highest amount of DFI in our
sample are Singapore, New Zealand, Chile, and Belgium. Countries with the lowest amount of DFI
are Japan and South Korea. These countries have traditionally been closed to direct investment.
More recent data would show an increase in direct investment in South Korea, but these data end in
1998. As a share of gross domestic investment, countries with the highest shares of portfolio
investment are Belgium, the United Kingdom, and Venezuela. Table A.3 also reports other summary
measures for the sample, including GNP per capita and the Financial Development (FD) indicator
developed by Levine. According to this measure, Japan, Germany, the US and the UK have the
highest level of financial development; Pakistan and Indonesia have the lowest.
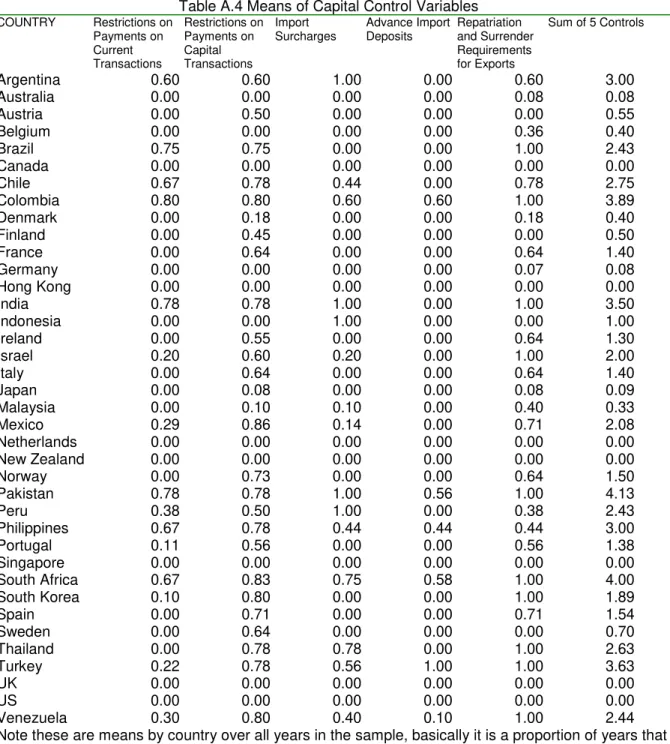
Table A.4 reports means of the components of the capital control index and the mean of the
Monetary Fund’s annual report, Trade and Exchange Restrictions. The IMF assigns a value of 1 if
the country has a control, and zero otherwise. Historically, the IMF has collected information on five
types of controls: (1) restrictions on capital account transactions (2) restrictions on current account
transactions (3) surcharges on imports (4) requirements for advanced import deposits and (5) export
taxes, in the form of repatriation and/or surrender requirements for export revenues. The first control
includes any kind of restriction on the capital account, while the second restriction includes
restrictions on trade in goods and services. Interestingly, use of restrictions on international
transactions is not confined to the poorest countries. Conversely, all of the countries that did not
implement restrictions on international transactions (Canada, Hong Kong, the U.K., the U.S.,
Singapore, the Netherlands and New Zealand) are high-income countries. This suggests that the
correlation between income and use of restrictions on international transactions is positive but not
perfect. In aggregate, 31 out of 38 countries used some type of capital control during our sample
period. The most common types of restrictions on international transactions are restrictions on capital
transactions and repatriation and surrender requirements for exports.
Summing across all types of restrictions on international transactions, the evidence in Table
A.4 suggests that the most open countries are Canada, Hong Kong, the Netherlands, New Zealand,
Singapore, the US, and the UK. The most closed economies are Pakistan and South Africa, followed
by Columbia and India. These rankings correspond with anecdotal evidence concerning the openness
of the current and capital account across our sample countries.
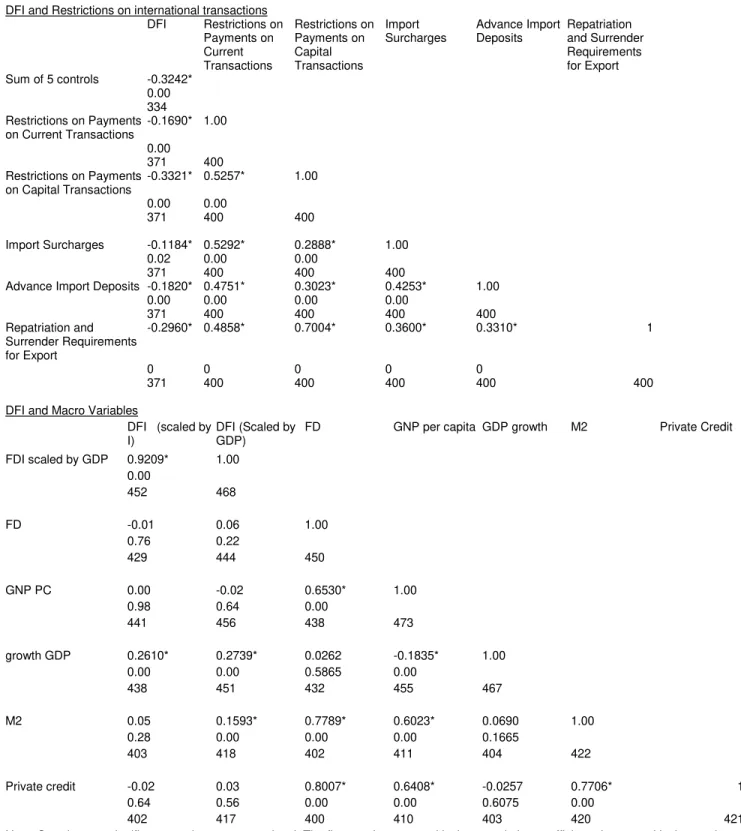
Table A.5 reports correlation coefficients, p-values and number of observations for the
DFI and our macroeconomic indicators. As expected, the correlation between DFI and restrictions on
international transactions is strongly negative and significant (-0.32). The two controls most
correlated with DFI are restrictions on capital transactions and repatriation and surrender
requirements for exports. The latter is not surprising as much of DFI goes to the export sector. The
former directly affects DFI and so we would expect this measure to be negatively correlated with
DFI, since a restriction on capital transactions could be a direct restriction on incoming or outgoing
DFI. One must be cautious in assigning causality. Although restrictions on international transactions
do affect DFI inflows, it is equally plausible that restrictions on international transactions are
(negatively) correlated with income level and that income levels determine (among other things) DFI
flows. However, in the lower panel of Table A.5, we see that DFI and our macroeconomic variables
are not very strongly correlated. Although DFI is not correlated with GNP per capita or M2, it is
strongly correlated with GDP growth. In addition, DFI is not significantly correlated with either a
country's level of financial development (proxied by FD) or the magnitude of private credit.
4. Investment Equation Estimates
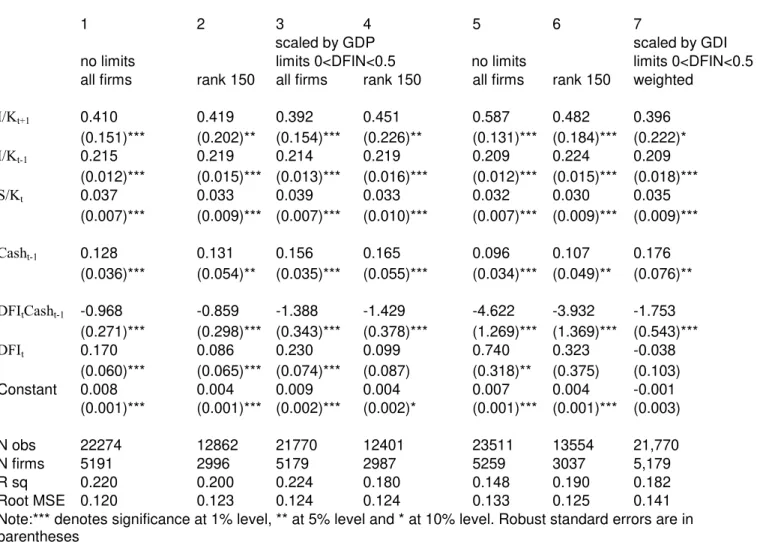
Table 1 reports the GMM results for equation 7. The basic specification is reported in column
(1). Direct foreign investment (DFI) is scaled by gross domestic investment (GDI). This
specification imposes no cut-offs on DFI and includes all firms with non-missing observations. The
results indicate that on average, firms in the sample are credit-constrained. The coefficient on lagged
cash stock is positive and statistically significant. As expected, the coefficients on lagged and future
investment and the sales to capital ratio are also positive and significant. The coefficient on DFI
alone is positive and significant, indicating a positive correlation between country-level DFI and
The focus of this section is the coefficient on DFI*Cash. The coefficient is negative and
statistically significant. This indicates that high levels of foreign investment are associated with a
reduction in the financing constraints faced by firms. The coefficient on cash stock is equal to 0.13,
which we interpret as investment-cash sensitivity in an average country in a year with zero DFI
inflow. The distribution of DFI across country-years has mean of 0.09 and standard deviation of 0.08,
therefore a one standard deviation increase in DFI inflows implies a 0.08 decrease in the cash
sensitivity, that is a change from 0.13 to 0.05, almost a 60% decline in cash sensitivity. These
numbers imply that DFI inflows have a large and economically significant influence on the
investment-cash sensitivity, which we interpret as a reduction in the firm’s financing constraints.
The remainder of this section is devoted to showing that this result is robust to a variety of
alternative specifications. In column (2), we restrict the sample to the largest 150 firms in each
country. Since most of the firms in the sample are from the largest countries, such as the United
States, this restriction is introduced to see if data for the United States is driving the results.
Restricting the sample to the largest 150 firms in each country has very little impact on the results.
The interaction between DFI and cash stock remains large and statistically significant. The only
difference is that DFI no longer has an independent, statistically significant impact on investment.
Column (3) restricts the sample to all observations where country-level inward DFI is greater
than zero and less than fifty percent of gross domestic investment (GDI). This allows us to exclude
extreme country observations where DFI may account for the major share of domestic investment.
to even larger effects of DFI on financing constraints. Further restricting the sample to the largest
150 firms in each country has no significant impact (column (4)) on the results.
In columns (5) and (6), we scale DFI by gross domestic product (GDP) instead of gross
domestic investment. Although the point estimates change due to the different scaling factor, the
results are unaffected: firms in countries with high levels of DFI are less credit constrained. Column
(7) further restricts the sample to observations where DFI values are not extreme, and also weights
the observations. The weighted regression approach assigns a country-specific weight, which is equal
to the inverse of the number of observations in each country. Countries with a lot of observations get
a smaller weight and countries with fewer observations get a larger weight, so that the number of
observations is equalized across all countries. We also experimented with country-year specific
weights (ie each year in each country is assigned a weight proportional to the number of o bservations
in that year and country) and obtained similar results. Introducing weights does not affect the results.
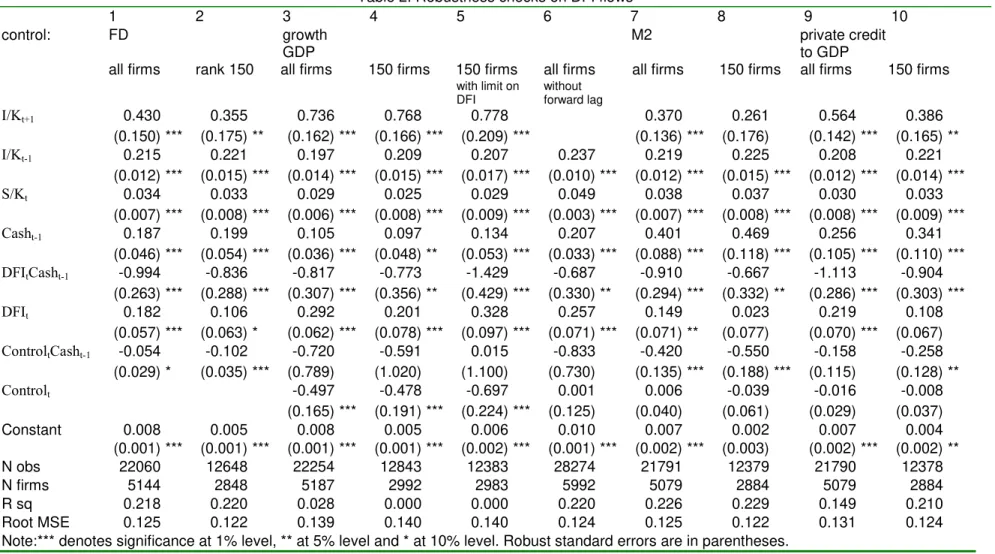
Table 2 redoes the specification reported in Table 1, but includes a number of robustness
checks. Direct foreign investment is likely to be correlated with a number of country-level measures
of economic well-being, including GDP growth and the general level of financial development.
Another possibility is that foreign investment responds to domestic policies which expand the
availability of domestic credit. In this case, the results could simply arise from omitted variable bias,
where DFI proxies for the expansion of domestic credit.
The results in Table 2 indicate that this is not the case. If we add a variety of additional
of cash stock and financial development (FD). The FD index is equal to the sum of the (standardized)
indices of the stock market development, STKMKT, and financial intermediaries development,
FININT, which come from Demirguc-Kunt and Levine (1996) (they refer to these indices as Index1
and Findex1 respectively). The STKMKT is the sum of three standardized measures: market
capitalization over GDP (i.e. the size of the stock market), total value traded over GDP, and total
value traded over market capitalization (two measures of liquidity of the market). The FININT is the
sum of two standardized measures: the ratio of liquid liabilities (M3) to GDP (i.e. the overall size of
the credit market) and the credit going to the private sector over GDP (the amount of credit th at is
relevant to the firm's financing)25. Thus, the measure is a country-level measure, with no time
variation. We add FD*cash to check whether DFI is essentially a proxy for financial development.
However, the inclusion of FD, which varies across countries but not over time, does not affect the
coefficient on DFI*cash. As expected, in countries with more financially developed markets, firms
appear to be less credit constrained.
In columns (3) through (6), we add the interaction of cash stock and GDP growth. Since
foreign investment is attracted to fast-growing countries, DFI may simply be capturing the fact that
fast-growing countries experience a reduction in financing constraints. The results in Table 2 indicate
that GDP growth has no impact on financing constraints. Inclusion of GDP growth interacted with
cash stock has no impact on the DFI*cash coefficient. However, one puzzling result is that GDP
growth by itself is negatively associated with investment. In column (6), we show that the negative
coefficient on GDP growth is driven by the presence of I(t+1). If we remove forward investment,
then the coefficient on GDP growth becomes positive.
25The original indicators were standardized to have mean of zero and standard deviation of one. Since
In columns (7) through (10) we test whether DFI proxies for changes in the
availability of domestic credit. Domestic credit is defined alternatively as M2 relative to GDP and
the ratio of private credit to GDP. Although we find that an expansion in M2 eases the financing
constraints of firms, as expected, inclusion of this variable does not affect the magnitude or
significance of the coefficient on DFI*cash. The results in Table 2 suggest that the impact of foreign
investment on domestic financing constraints is remarkably robust.
5. Testing for the Impact of Restrictions on International Transactions
If direct foreign investment inflows affect firm financing constraints in host countries, then
restrictions on international transactions (including capital controls which inhibit inflows of DFI) are
likely to exacerbate financing constraints. Table 3 presents the results of testing for the impact of
restrictions on international transactions on firm-level financing constraints. The measures of
restrictions are taken from the International Monetary Fund’s annual report, Trade and Exchange
Restrictions. The IMF assigns a value of 1 if the country has a control, and zero otherwise.
Historically, the IMF has collected information on five types of controls: (1) restrictions on capital
account transactions (2) restrictions on current account transactions (3) surcharges on imports (4)
requirements for advanced import deposits and (5) export taxes, in the form of repatriation and/or
surrender requirements for export revenues. The first control includes any kind of restriction on the
capital account, while the second restriction includes restrictions on trade in goods and services.
Restrictions on incoming DFI are most likely to be associated with the first type of control, which
covers direct restrictions on inflows or outflows of foreign investment. Other controls, however,
could also have an indirect effect, by reducing the overall profitability of investment and thus
discouraging foreign investment inflows.
Table 3 reports the impact of each type of control on financing constraints separately. We
focus on the coefficient on the interaction of each different type of restriction and cash stock,
Restriction*Cash. As indicated in the table, the only type of restriction which has a significant
impact on financing constraints is the restriction on payments for capital transactions. The coefficient
is highly significant and positive, indicating that countries with restrictions on payments for capital
transactions have more credit-constrained firms.
The second through sixth columns of Table 3 test for the impact of other types of foreign
exchange or trade restrictions on financing constraints. None of the other types of restrictions affect
firm financing constraints. However, there is a negative and statistically significant relationship
between import surcharges and firm-level investment. Countries with higher import surcharges have
lower investment, after controlling for other determinants of investment. This result confirms the
findings of Levine and Renelt (1992), who argue that trade restrictions operate through their impact
on investment, rather than directly on technological change and growth. It is interesting to note that
the only type of restriction which directly and negatively affects investment is import surcharges.
This suggests that openness to trade could be a critical factor in encouraging domestic investment.
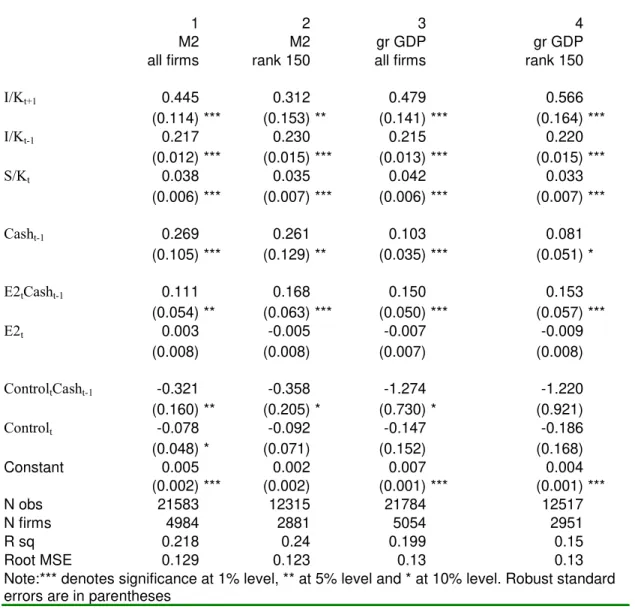
Table 4 reports robustness tests for the impact of capital account restrictions on financing
constraints. Including either M2 or GDP growth has no impact on the result that countries with
our results on capital account restrictions are not driven by a negative correlation between capital
account restrictions and M2 or GDP growth.
6. Extensions
6.1 Impact of DFI on financing constraints by country type
We would expect that the impact of foreign investment on host country financing constraints
would vary with the level of development. In particular, we would expect that the impact of foreign
investment would be smaller in countries where credit markets are well-developed and constraints on
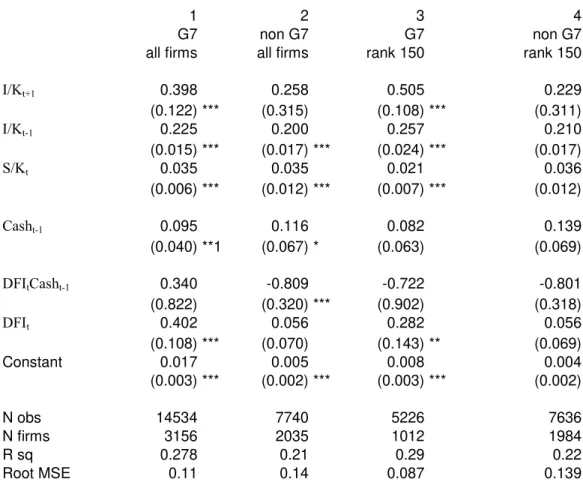
credit are less pervasive. Table 5 splits the sample into the G7 countries and other countries in the
sample. The G7 countries include the United States, Britain, France, Italy, Germany, Japan, and
Canada.
The results show that the impact of foreign investment on firm financing constraints is driven
by the non-G7 countries. DFI has a significant impact on financing constraints only in the non-G7
countries. Only in those countries is greater DFI associated with an easing of financing constraints.
This is not surprising, since half the specifications for the G7 countries indicate that firms on average
are not significantly credit constrained.
6.2 Which Firms benefit Most from the DFI inflows?
We would also like to be able to identify the mechanism through which foreign inflows affect
domestic financing constraints. For example, are financing constraints eased because firms that were
foreign inflows provide a signal to foreign banks operating in the country, triggering them to lend
more to domestic enterprises? Although this is the subject of future research, we can answer a
simpler question. In particular, we can separately estimate the impact of DFI inflows on firms with or
without foreign assets. The Worldscope database allows us to identify which firms are
multinationals, as defined as firms with at least 5 percent total assets owned abroad.
In Table 6, we redo the basic specification, but we separate firms with foreign assets from
other firms. In columns (1) and (2) we separate firms with foreign assets by defining multinationals
as firms with at least 5 percent of total assets as foreign. In columns (3) and (4), we change the
definition of a multinational to 10 percent foreign assets. The results are two-fold. First, the results
indicate that firms with foreign assets are less likely to be credit-constrained. The point estimate on
cash stock is small in magnitude and statistically insignificant for firms with foreign assets, but large
in magnitude and significant for other firms. Only firms without foreign assets appear to be credit
constrained in our sample.
Second, the results clearly show that the beneficial effects of DFI inflows are concentrated in
non-multinational firms. The coefficient on DFI*cash is only significantly negative and significant
for firms without foreign assets. The evidence suggests that the level of DFI in a particular economy
does not affect firms with foreign assets, which are more likely to have access to international capital
markets.
These results do not shed light on whether firms with FDI are more or less likely to receive
the bulk of the benefits—in terms of relaxing financing constraints—from incoming FDI. This is
because we cannot identify which firms have FDI: we can only identify which firms are
joint ventures receive all the benefits as far as relaxation of credit is concerned, and domestic firms
which are not partially foreign owned are actually crowded out of domestic credit markets. However,
the Ivory Coast is an unusual case. The results in Table 6 appear to indicate that domestic firms
overall (whether joint ventures or otherwise) benefit from incoming FDI through a relaxation of
financing constraints.
6.3 Responding to Kaplan and Zingales.(1997)
Kaplan and Zingales (1997) argue that using investment-cash flow correlations to identify
financing constraints is fundamentally flawed. One major part of their argument is based on an
analysis of 49 low-dividend firms, identified by Fazzari, Hubbard, and Petersen (1988) as financially
constrained. Kaplan and Zingales (1997) argue that these supposedly constrained firms, which
exhibit high investment-cash flow correlations, are in fact not constrained at all. To measure
constraints, they rely on a detailed analysis of individual firm balance sheets and a number of
indicators of financial health, including cash flow, interest coverage, debt ratios and sales growth.
They argue that based on these accounting measures of financial health, the subset of firms identified
by FHP as exhibiting high cash-flow investment correlations is not financially constrained.
In response to the Kaplan-Zingales critique, we calculate the same financial ratios that they
use in their paper and regress these measures of (current period) financial health on lagged DFI,
lagged growth in GDP per capita, lagged M2, lagged private credit, and a set of year dummies. The
measures of financial health include two measures of investment, two measures of cash flow, debt,
two measures of interest coverage, and sales growth. All variables were transformed into deviations
Euler equation specification: firm-level measures of financial health improve with an influx in foreign
investment. These results are unaffected by the inclusion of other variables that could be correlated
with DFI, including GDP growth and measures of liquidity. In every case, the within regressions
show that an increase in DFI results in improved financial health for the firm. The coefficient on
lagged DFI is the correct sign and statistically significant. Using an entirely different approach, and
relying on financial ratios as an indicator of financial health, the results in Table 7 provide support for
the Euler equation approach.
7. Conclusion
This paper measures whether different measures of globalization affect host country financing
constraints. Direct foreign investment, by bringing in scarce capital, may ease firm financing
constraints. Alternatively, if foreign firms borrow heavily from domestic banks, they may exacerbate
domestic firms’ financing constraints by crowding them out of domestic capital markets. Combining
a unique cross-country firm panel with country-level data on DFI flows, we test whether foreign
investment affects firm-level financing constraints. The results suggest that DFI inflows are
associated with a reduction in firm-level financing constraints. Our results are robust to a number of
controls, including measures of GDP growth, other measures of credit changes, and a proxy for
financial development.
We also test whether restrictions on international transactions affect domestic firm financing
constraints. Our results suggest that only one type of restriction—those on capital account
transactions—negatively affect firm financing constraints. The results on capital account restrictions
constraints on firms. These results are robust to the inclusion of other variables which may be
correlated with restrictions on international transactions. However, other types of exchange
controls—such as repatriation requirements for exporters or import surcharges—have no impact on
firm financing constraints.
We also explore whether the impact of DFI varies across the level of economic development.
Our results show that direct foreign investment only eases domestic financing constraints in the
non-G7 countries. In other words, incoming foreign investment only eases financing constraints in the
less wealthy countries in our sample. Finally, we show that DFI eases financing constraints only for
References
Aghion, Phillipe, Eve Caroli and Cecilia Garcia-Penalosa, Inequality and Economic Growth:The
Perspective of the New Growth Theories, Journal of Economic Literature v37 n4, December 1999
Arrellano, M. and O. Bover, Another Look at the Instrumental Variable Estimation of Error
Component Models, Journal of Econometrics 68, pp. 29-51, 1995
Banerjee, Abhijit V. and Andrew F. Newman, Poverty, Incentives and Development, American Economic Review v84 n2, May 1994
Bekaert G., and C. Harvey, ``Foreign Speculators and Emerging Equity Markets,'' Journal of Finance, v.55(2), pp. 565-613, 2000
Bekaert G., C. Harvey, and C. Lundblad, ``Does Financial Liberalization Spur Growth,'' NBER working paper W8245, 2001
Bigsten, Arne, Paul Collier, Stefan Dercon, Marcel Fafchamps, Bernard Gauthier, Jan Willem Gunning, Mans Soderbom, Abena Oduro, Remco Oostendorp, Cathy Patillo, Francis Teal, and Albert Zeufack, Financing constraints in Manufacturing Enterprises in Africa, Centre for the Study of African Economies Working Paper Series 2000.24, September 2000
Bond and Cummins, Noisy Share Prices and the Q model of Investement, Oxford University Manuscript, Oxford University 2001
Bond, Stephen, Julie Elston, Jacques Mairesse, and Benoît Mulkay, Financial Factors and
Investment in Belgium, France, Germany, and the UK: A Comparison using Company Panel Data, NBER Working Paper Series 5900, National Bureau of Economic Research, Cambridge, Massachusetts, January 1997
Bond, Stephen and C. Meghir, Dynamic Investment Models and the firms financial policy, Review of Economic Studies, 61, 197-222, 1994
Calomiris, Charles, Charles P. Himmelberg, and Paul Wachtel, Commercial Paper, Corporate
Finance, and the Business Cycle: a Microeconomic Perspective, Carnegie-Rochester Conference Series on Public Policy 42, pp. 203-50, 1995
Demirguc-Kunt A. and R. Levine, Stock Market Development and Financial Intermediaries:
Stylized Facts, World Bank Economic Review 10, pp. 291-321, 1996
Demirguc-Kunt, A. and V. Maksimovic, Law, Finance and Firm growth, Journal of Finance, 53(6) pp. 2107-31, 1998
Journal of Political Economy, 108 1027-57, 2000
Fazzari, Steven M., R. Glenn Hubbard, and Bruce C. Petersen, Financing Constraints and
Corporate Investment, Brookings Papers on Economic Activity, v1, 141-195, 1988
---, Investment-Cash Flow Sensitivities are Useful: A Comment on Kaplan and
Zingales, Quarterly Journal of Economics 115(2), 695-706, May 2000
Feldstein, Martin, Aspects of Global Economic Integration:Outlook for the Future, NBER Working Paper 7899, September 2000
Galindo, A., F. Schiantarelli and A. Weiss, ``Does Financial Liberalization Improve the Allocation
of Investment? Micro Evidence from Developing Countries,'' Mimeo, Boston College , 2001
Gelos, Gaston R. and Alejandro M. Werner, Financial Liberalization, Financing constraints, and
Collateral:Investment in the Mexican Manufacturing Sector, IMF Working Paper, WP/99/25, 1999
Gilchrist, Simon and Charlie Himmelberg, Evidence on the Role of Cash Flow for Investment, Journal of Monetary Economics, 36, 541-572, 1995
Gilchrist, Simon and Charles P. Himmelberg, Investment, Fundamentals and Finance, NBER Macro Annual 1998, Ben S. Bernanke and Julio J. Rotemberg eds., the MIT Press, Cambridge, 223-274, 1998
Gomes, Joao F., Financing Investment, American Economic Review, vol. 91, no. 5, pp. 1263-85, December 2001
Harris, John R., Fabio Schiantarelli, and Miranda Siregar, The Effect of Financial Liberalization
on the Capital Structure and Investment Decisions of Indonesian Manufacturing Establishments, The World Bank Economic Review, January, 1994
Harrison, Ann E., and Margaret S. McMillan, Does direct foreign investment affect domestic firms
credit constraints?, Tufts University Working Paper, 2001
Hart, Oliver, 1995, Firms, Contracts, and Financial Structure. London, Oxford University Press, 1995.
Harvard Institute for International Development and World Economic Forum, The Africa Competitiveness Report 1998, World Economic Forum, Geneva Switzerland, 1998
Hayashi, Fumio, Tobin's Marginal q and Average q: A Neoclassical Interpretation, Econometrica, vol. 50, no. 1, pp. 213-24, January 1982
Henry, P. B., ``Stock Market Liberalization, Economic Reform and Emerging Market Equity Prices,'' Journal of Finance, v.55(2), pp.529-64, 2000
Hubbard, R. Glenn, Capital-Market Imperfections and Investment, Journal of Economic Literature, vol. XXXVI, pp. 193-225, March 1998
Hubbard, R.G. and A. Kashyap, Internal Net Worth and the Investment Process: An
Application to U.S. Agriculture , Journal of Political Economy, v. 100 (3), 1992
Hubbard, R.G., A. Kashyap and T. Whited, Internal Finance and Firm Investment, Journal of Money Credit and Banking, 27 (4) pp. 683-701, 1995
Jaramillo, Fidel, Fabio Schiantarelli and Andrew Weiss, Capital market imperfections before and
after financial liberalization: An Euler equation approach to panel data for Ecuadorian firms, Journal of Development Economics, Vol. 51, Issue 2, December 1996
Jensen, Michael and William Meckling, Theory of the Firm: Managerial Behaviour, Agency Costs,
and Ownership Structure, Journal of Financial Economics, 3(4), pp. 305-60, 1976
Kaplan, Steven N. and Luigi Zingales, Do Investment-Cash Flow Sensitivities Provde Useful
Measures of Financing Constraints? Quarterly Journal of Economics, 169-215, 1997
---, Investment-Cash Flow Sensitivities are Not Valid Measures
of Financing Constraints, Quarterly Journal of Economics, vol. 115, no. 2, pp. 707-12, May 2000
Kim, Chang-Soo, David Mauer, and Ann E. Sherman, The Determinants of Corporate Liquidity:
Theory and Evidence, Journal of Financial and Quantitative Analysis, v.33(3), 1998
Laeven, Luc, ``Does Financial Liberalization Reduce Financing Constraints,'' Mimeo, World Bank, 2002
La Porta, R., F. Lopez-de-Silanes, A. Shleifer, and R. Vishny, Legal Determinants of External
Finance, Journal of Finance, pp. 1131-50, 1997
Levine, Ross, and David Renelt, A Sensitivity Analysis of Cross-Country Growth Regressions, American Economic Review, 942-963, September 1992
Love, Inessa, The Capital Accumulation Identity-How Well does it Hold in the Data:Evidence
from Compustat and Worldscope Databases, Mimeograph, Columbia University, 1999
Love, Inessa, Financial Development and Financing Constraints: International Evidence from
Myers, Stewart and Nicholas Majluf, Corporate Financing and Investment Decisions When Firms
Have Information That Investors Do Not Have, Journal of Financial Economics, 13(2), pp. 187-221, 1984
Opler, Tim, Lee Pickowitz, Rene Stultz, and Rohan Williamson, The Determinants and Implications
of Corporate Cash Holdings, Journal of Financial Economics, 52(1), pp. 3-46, 1999
Patillo, Catherine, Risk, Financial Constraints and Equipment Investment in Ghana:A Firm-level
Analysis Ch. 4 of Investment and Risk in Africa edited by Paul Collier and Catherine Patillo, St. Martin's Press, New York, New York, 2000
Rajan, R. and L. Zingales, Financial Dependence and Growth, American Economic Review, 88(3), pp. 559-86, 1998
Ross, Stephen A., Randolph W. Westerfield, and Jeffrey Jaffe, Corporate Finance, 4th edition,The Irwin Series in Finance, Chicago, IL, 1996
Tybout, James R., Credit Rationing and Investment Behavior in a Developing Country, Review of Economics and Statistics, Vol. 65, Issue 4, 598-607, November 1983
Schiantarelli, Fabio, Financial Constraints and Investments: Methodological Issues and
International Evidence, Oxford Review of Economic Policy 12, 70-89, 1996
Stiglitz, Joseph, The Role of International Financial Institutions in the Current Global Economy, Address to the Chicago Council on Foreign Relations, Chicago, February 27, 1998
Whited, T., Debt, Liquidity Constraints, and Corporate Investment: Evidence from Panel Data, Journal of Finance, 47 (4), pp. 1425-60, 1992
Table 1. Main Results on DFI flows
1 2 3 4 5 6 7
scaled by GDP scaled by GDI
no limits limits 0<DFIN<0.5 no limits limits 0<DFIN<0.5 all firms rank 150 all firms rank 150 all firms rank 150 weighted
I/Kt+1 0.410 0.419 0.392 0.451 0.587 0.482 0.396 (0.151)*** (0.202)** (0.154)*** (0.226)** (0.131)*** (0.184)*** (0.222)* I/Kt-1 0.215 0.219 0.214 0.219 0.209 0.224 0.209 (0.012)*** (0.015)*** (0.013)*** (0.016)*** (0.012)*** (0.015)*** (0.018)*** S/Kt 0.037 0.033 0.039 0.033 0.032 0.030 0.035 (0.007)*** (0.009)*** (0.007)*** (0.010)*** (0.007)*** (0.009)*** (0.009)*** Casht-1 0.128 0.131 0.156 0.165 0.096 0.107 0.176 (0.036)*** (0.054)** (0.035)*** (0.055)*** (0.034)*** (0.049)** (0.076)** DFItCasht-1 -0.968 -0.859 -1.388 -1.429 -4.622 -3.932 -1.753 (0.271)***