ESTIMATION OF TAPENTADOL IN BULK AND PHARMACEUTICAL
FORMULATION BY REVERSE PHASE HIGH PERFORMANCE
LIQUID CHROMATOGRAPHY (RP-HPLC) AND
UV-SPECTROPHOTOMETRY
Usharani G*1, Chandra Shekar B2, Devanna Nayakanti3
1
Research scholar, JNT University, Anantapur, A.P, INDIA.
2
Principal & Professor, MLR Institute of Pharmacy, Dundigal, Hyderabad, A.P, INDIA.
3
Professor & Director of OTRI, OTRI, JNT University, Anantapur, A.P, INDIA.
ABSTRACT
Tapentadol is an analgesic drug. A RP-HPLC and an UV spectrophotometric assay method were developed and validated for quantitative determination of Tapentadol in pharmaceutical solid dosage form. The chromatography was carried out on a C-18 (250 mm x 4.6 mm, 5 μm) column with Dipotassiumphosphate buffer and
acetonitrile (50:50 v/v) as mobile phase at 241 nm detector wave length. The UV method was performed at 241 nm using water as solvent. The linearity was established in the range of 200 to 600μg/ml and 2.5 to 15μg/ml for HPLC and UV methods respectively. The
HPLC method was accurate and precise for all the dosage forms studied with a recovery of 98 to 102%. The UV method correlated well with HPLC for the analysis of Tapentadole in tablet dosage form. The proposed method was successfully applied for the reliable quantification of active pharmaceuticals present in the commercial formulations. A good agreement was observed between HPLC and UV methods. The validated HPLC and UV methods can be used for the drug analysis in routine quality control for bulk and dosage forms.
KEYWORDS: Tapentadol, HPLC, Spectrophotometry, analysis.
Volume 3, Issue 4, 2084-2095. Research Article ISSN 2277 – 7105
Article Received on 30 April 2014, Revised on 26 May 2014,
Accepted on 20 Jun 2014
*Correspondence for
Author
Usharani G
Research scholar, JNT
University, Anantapur, A.P,
INTRODUCTION
Tapentadol, 3-[(1R,2R)-3-(dimethylamino)-1-ethyl-2-methyl-propyl]phenolhydrochloride (TAP), differs distinctly from previously characterized centrally acting analgesics in that it has a peculiar dual mechanism of action. For this reason, a new pharmacological class has been proposed, namely mu opioid receptor agonist and noradrenaline reuptake inhibitor (MOR-NRI)1,2 (Fig. 1).
Figure-1:Tapentadol
Both these mechanisms of action, MOR and NRI, contribute in a complementary way to TAP’s efficacy in nociceptive and neuropathic pain conditions3
. This combination of effects not only provides effective analgesia in a broad range of acute and chronic pain conditions, but it provides an ‘opioid-sparing’ effect, i.e. to lower the dose of TAP required to produce a
MATERIALS AND METHODS HPLC
Chemicals Reagents:
Working standards of pharmaceutical grade Tapentadol was obtained as generous gift from Dr.Reddy’s laboratories (Hyderabad, AP, India) used as such without further purification.
The pharmaceutical dosage form used in the study was Tydol Acetonitrile (HPLC grade), KH2PO4 (AR grade) purchased from Merck specialities Pvt.ltd (Mumbai, India) and double
distilled water used for analysis.
Instrumentation and chromatographic condition
Chromatography was carried out on C8 waters symmetry column with mobile phase comprising of K2HPO4 buffer and ACN in the ratio of 50:50. The flow rate was adjusted to
1.2 ml / min with PDA detection at 241 nm.
Figure-2: Chromatogram of Tapentadol
Preparation of standard solution
Standard stock solution of pure drug was prepared by dissolving 100 mg of Tapentadol in 100ml water. to get concentration of 400µg/ml of Tapentadol. From stock solution 5 ml was taken and diluted to 25 ml with water to get concentrations 0.4 mg/ml.
Preparation of sample solution
RESULTS Validation
The developed method was validated with different analytical parameters such as accuracy, precision, linearity, limit of detection, limit of quantification and robustness according to the international conference on harmonization (ICH) Q2B guidelines
.
Precision
Precision of these methods was checked by analyzing the samples at three different time intervals of the same day (intraday precision (table-1)). Robustness for HPLC method was performed by deliberately changing the chromatographic conditions. The flow rate of the mobile phase was changed from 1.2 mL/min to 1.0 mL/min and 1.4 mL/min while ratio of the mobile phase was changed by ± 1%. Results of the Robustness were shown in table-2. Table-1: Validation parameters
Validation Parameter HPLC method System precision 0.1%
Tailing factor 1.1 Theoretical plate count 6985
Linearity 200-600µg/ml Regression equation y = 21349x – 32996 Regression coefficient 0.999
Detection limit (μg/mL) 12.87µg/ml Quantitation limit (μg/mL) 42.92(μg/mL) Accuracy (% recovery) 100% Precision
Assay value 100% %RSD 1.04
Recovery studies
To check the accuracy of the developed methods and to study the interference of formulation additives, analytical recovery experiments were carried out by standard addition method at 50, 100, 150% levels (table-3). From the total amount of drug found percentage recovery was calculated.
Table-2: Accuracy results
%Concentration Area Amount Added(mg) Amount Found(mg) % Recovery Mean Recovery
50% 4371532 199.99 199.50 100%
Linearity LOD and LOQ
Limit of Detection (LOD) and Limit of quantification (LOQ) were calculated by using the values of slopes and intercepts of the calibration curves for both the drugs. LOD and LOQ values were found to be 12.87 µg/ml and 42.92 µg/ml.
Figure-3: Linearity of Tapentadol
Robustness
Method robustness was determined by the small changes in chromatographic conditions like as 0.2ml flow rate and ±5ºc temperature and inject the sample observe the result there were no marked changes compare to other analysis.
Table-3: Robustness
Parameters Changes Retention Time Flow rate (ml/min) 1.0 2.477
1.4 2.476 Temperature 40ᵒC 2.477 50ᵒC 2.479
UV Method Instrumentation
Reagents and chemicals
Working standards of pharmaceutical grade Tapentadol was obtained as generous gift from Dr.Reddy’s laboratories (Hyderabad, AP, India) used as such without further purification.
The pharmaceutical dosage form used in the study was Tydol.
Experimental condition
According to the solubility characteristics of the drug, water was selected as the solvent for analysis. From scanning of drug by UV spectra, wavelength was selected for the estimation of Tapentadol at 241 nm.
Preparation of standard stock solution Analysis of tablet formulation
Twenty tablets were accurately weighed average and crushed to fine powder. An accurately weighed powder sample equivalent to 100 mg of Tapentadol was transferred into a 100ml volumetric flask. Add 50 ml of distilled water and sonicated for 20 minutes. The resultant solution was filtered through 0.45 μ membrane filter and finally diluted the volume with
distilled water. The solution was suitably diluted with diluents to obtain sample solution containing 10 μg/ml as in the tablet formulation.
Wavelength selection
The standard solution of Tapentadol was scanned at different concentration in the range of 200-400 nm and the λ max was determined. The spectrum was also run (figure 4).
Method Validation
Accuracy was determined by recovery study. Recovery experiment was carried out by spiking the already analyzed sample of the tablets with the different known concentration of standard Tapentadol. Precision for assay was determined by repeatability, inter day, intraday precision ( in three replicate). The UV analysis results were indicated in table 1.
Table-4: Result of UV analysis
Parameters Tapentadol Detection wavelength 241 nm Beers law limit 2-22µg/ml Regression equation y=mx+c Slope 0.0393 Intercept 0.1084 Correlation Coefficient 0.999
Accuracy
Accuracy of the procedure was determined by comparing the analytical amount determined Vs known amount spiked at 50%, 100% and 150% level of LOQ concentration with measurements for each concentration level achieved.
Limit of Detection and Quantitation
The LOD and LOQ of Tapentadol were estimated from the standard deviation of the response and the slope of the calibration curve by using following formula.
LOD= 3.3 x σ / S LOQ= 10 x σ / S
Where σ = the standard deviation of the response
S = the slope of the calibration curve
LOD and LOQ were found to be 0.09 μg / ml and 0.31 μg / ml. Results are indicated in Table 2.
Precision
Precision of the method reported as % RSD, was estimated by repeatability, reproducibility and intermediate precision by measuring absorbance of six replicates of 10 μg / ml of
Table-5: Result of validation parameters
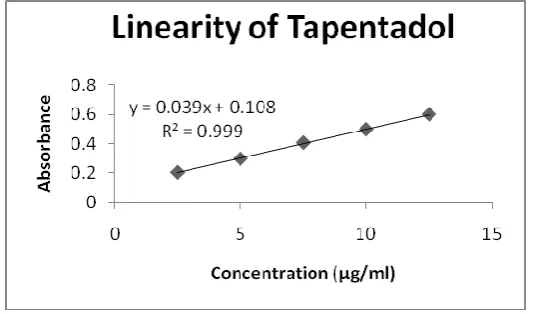
[image:8.595.165.432.348.505.2]Linearity: Tapentadol exhibited linearity with absorbencies in the range of 2.5 to 15mcg ml-1 at its selected wavelength i.e., 24ml-1 nm. The calibration graph of Tapentadol was shown in Figure 5.
Figure-5: Linearity of Tapentadol
RESULTS AND DISCUSSION HPLC Method
Retention time of Tapentadol was found to be 2.47 (as shown in Fig. 3). The detector response was linear in the range of 200-600 µg/ml. In the linearity study the regression equation and coefficient of correlation was found to be y = 21349x – 32996, R² = 0.9999. Commercial formulations containing Tapentadol was analyzed by the proposed method. A typical chromatogram of marketed formulation is shown in fig. no.3. Six replicate analysis of formulation were carried out and the mean assay values were found close to 100 %. The tailing factors were <2.0 for both the peaks. The chromatogram was recorded at 292nm. System suitability was established by injecting standard solution and results are shown in
table no.1.The accuracy of the proposed method was determined by recovery studies. It was confirmed from results that the method is highly accurate (table no.3 and 4). Precision (table no.2) was calculated as interday and intraday variations for both the drugs. Percent relative standard deviations for intraday was 1.04 % which is well within the acceptable limit of 2 %. For robustness studies in all deliberately varied conditions, the RSD of contents of Tapentadol were found to be well within the acceptable limit of 2%.
UV Method
The proposed new method for determination of Tapentadol (Figure 1) showed molar absorptivity. Linear regression of absorbance on concentration gave the equation y = 0.0393x + 0.1084. R² = 0.9993 with a correlation coefficient (r2) 0.999 (Figure ). Result of UV analysis has been shown in Table 1. The standard deviation and %RSD calculated for the method is low, indicating high degree of precision. The %RSD is also less than 2% as required by ICH guidelines. The % recovery was between 99 - 102% indicating high degree of accuracy and specificity of the proposed method. The developed spectro-photometric method was validated for the estimation of Tapentadol using linearity, range, accuracy and precision and the results were interpreted in Table 2. The %RSD for all parameters was found to be less than two, which indicates the validity of method and assay results obtained by this method are in fair agreement.
Table -6: Regression analysis and system suitability parameters for the quantification of Tapentadol by HPLC and UV
Validation Parameter HPLC method UV method
System precision 0.1% - Tailing factor 1.1 - Theoretical plate count 6985 - Linearity 200-600µg/ml 2.5-15µg/ml
Regression equation y = 21349x – 32996 y = 0.0393x + 0.1084
Regression coefficient 0.999 0.999
Detection limit (μg/mL) 12.87µg/ml 0.09µg/ml
Quantitation limit (μg/mL) 42.92(μg/mL) 0.31(μg/mL)
CONCLUSION
Both the proposed methods were validated as per ICH guidelines. The standard deviation and % RSD calculated for the proposed methods are low, indicating high degree of precision of the methods. The results of the recovery studies performed show the high degree of accuracy of the proposed methods. Hence, it can be concluded that the developed spectrophotometric & HPLC method is accurate, precise and selective and can be employed successfully for the estimation of Tapentadol in marketed formulation.
ACKNOWLEDGEMENTS
Authors are thank full to Rainbow Pharma training lab, Kukatpally, Hyderabad and JNTUniversity, Anantapur, A.P, India, for providing instruments and analytical support.
REFERENCES
1. H.G. Kress, Tapentadol and its two mechanisms of action: is there a new phar-macological class of centrally-acting analgesics on the horizon? Eur. J. Pain 14 (2010) 781–783.
2. T.M. Tzschentke, U. Jahnel, B. Kogel, T. Christoph, W. Englberger, J. De Vry, K. Schiene, A. Okamoto, D. Upmalis, H. Weber, C. Lange, J.U. Stegmann, R. Kleinert, Tapentadol hydrochloride: a next-generation, centrally acting analgesic with two mechanisms of action in a single molecule, Drugs Today (Barc) 45 (2009) 483–496. 3. C.T. Hartrick, R.J. Rozek, Tapentadol in pain management: a (opioid receptor agonist and
noradrenaline reuptake inhibitor, CNS Drugs 25 (2011) 359–370.
4. R. Buynak, D.Y. Shapiro, A. Okamoto, I. Van Hove, C. Rauschkolb, A. Steup, B. Lange, C. Lange, M. Etropolski, Efficacy and safety of tapentadol extended release for the management of chronic low back pain: results of a prospec-tive, randomized, double-blind, placebo- and active-controlled Phase III study, Expert Opin. Pharmacother. 11 (2010) 1787–1804.
5. J.E. Wild, S. Grond, B. Kuperwasser, J. Gilbert, B. McCann, B. Lange, A. Steup, T. Häufel, M.S. Etropolski, C. Rauschkolb, R. Lange, Long-term safety and tolera-bility of tapentadol extended release for the management of chronic low back pain or osteoarthritis pain, Pain Pract. 10 (2010) 416–427.
severe chronic pain related to osteoarthritis of the knee: a randomized, double-blind, placebo- and active-controlled phase III study, Clin. Drug Invest. 30 (2010) 489–505. 7. J.U. Stegmann, H. Weber, A. Steup, A. Okamoto, D. Upmalis, S. Daniels, The efficacy
and tolerability of multiple-dose tapentadol immediate release for the relief of acute pain following orthopedic (bunionectomy) surgery, Curr. Med. Res. Opin. 24 (2008) 3185– 3196.
8. S. Daniels, E. Casson, J.U. Stegmann, C. Oh, A. Okamoto, C. Rauschkolb, D. Upmalis, A randomized, double-blind, placebo-controlled phase 3 study of therelative efficacy and tolerability of tapentadol IR and oxycodone IR for acute pain, Curr. Med. Res. Opin. 25 (2009) 1551–1561.
9. S.E. Daniels, D. Upmalis, A. Okamoto, C. Lange, J. Häeussler, A randomized, double-blind, phase III study comparing multiple doses of tapentadol IR, oxy-codone IR, and placebo for postoperative (bunionectomy) pain, Curr. Med. Res. Opin. 25 (2009) 765– 776.
10.C. Hartrick, I. Van Hove, J.U. Stegmann, C. Oh, D. Upmalis, Efficacy and tolera-bility of tapentadol immediate release and oxycodone HCl immediate release in patients awaiting primary joint replacement surgery for end-stage joint disease: a 10-day, phase III, randomized, double-blind, active- and placebo-controlled study, Clin. Ther. 31 (2009) 260–271.
11.R. Kleinert, C. Lange, A. Steup, P. Black, J. Goldberg, P. Desjardins, Single dose analgesic efficacy of tapentadol in postsurgical dental pain: the results of a randomized, double-blind, placebo-controlled study, Anesth. Analg. 107 (2008) 2048–2055.
12.M. Giorgi, G. Soldani, C. Manera, P. Ferrarini, M. Sgorbini, G. Saccomanni, Pharmacokinetics of tramadol and its metabolites m1, m2 and m5 in horses fol-lowing intravenous immediate release (fasted/fed) and sustained release single dose administration, J. Equine Vet. Sci. 27 (2007) 481–488.
13.M. Giorgi, S. Del Carlo, G. Saccomanni, B. Łebkowska-Wieruszewska, V. Turini, C. Kowalski, Biopharmaceutical profile of tramadol in the dog, Vet. Res. Commun. 33S1 (2009) 189–192.
15.J.K. Dhanjal, D.V. Wilson, E. Robinson, T.T. Tobin, L. Dirokulu, Intravenous tra-madol: effects: nociceptive properties, and pharmacokinetics in horses, Vet. Anaesth. Analg. 36 (2009) 581–590.
16.M.J. Souza, S.K. Cox, Tramadol use in zoologic medicine, Vet. Clin. North Am. Exot. Anim. Pract. 14 (2011) 117–130.