DEVELOPMENT AND VALIDATION OF RP-HPLC METHOD FOR
DETERMINATION OF SOFOSBUVIR BY PURE AND TABLET
DOSAGE FORM”
Jayesh A. Patil*, S. T. Patil, B. R. Rane and S. P. Pawar
Department of Quality Assurance P.S.G.V.P. Mandal’s Cop Shahada Dist. Nandurbar,-425409 Maharashtra.
ABSTRACT
A simple, precise, rapid and reproducible RP-HPLC method was developed and validated for the determination of Sofosbuvir in Pharmaceutical dosage form. Separation was achieved under optimized chromatographic condition on a C18 (PRIMESIL) column (250 X 4.6 mm i.d., particle size 5µm.). The mobile phase consisted of Acetonitrile:Water (pH 2.4 adjusted with 0.05% orthophosphoric acid) in ratio 80:20 (v/v) an gradient elution at a flow rate of 0.7 ml/min at ambient temperature. The detection was carried out at 260nm using UV-Visible detector. The retention time of Sofosbuvir is found to be 4.3 min and the calibration curve was linear in the concentration range of 20-100 µg/ ml (r2═ 0.997). The limit of detection and the limit of quantification were found to be 0.5355 and 1.6228 µg/ml respectively. The amount of sofosbuvir present in the formulation was found to be 99%. The method was validated statistically using the SD, %RSD and values are found to be within the limits and the recovery studies were performed and the percentage recoveries was found to be 98% (±1%) to 102%(±1%). So, the proposed method was found to be simple, specific & linear. Hence it can be applied for routine analysis of sofosbuvir in the pharmaceutical formulations.
KEYWORDS: RP-HPLC, Sofosbuvir, UV detection, Acetonitrile:water.
INTRODUCTION
IUPAC name of sofosbuvir is Isopropyl (2S)-2-[[[(2R,3R,4R,5R )-5-(2,4-dioxopyrimidin-1-
yl)-4-fluoro-3-hydroxy-4-methyl-tetrahydrofuran-2-yl]methoxy-phenoxy-phosphoryl]amino]propanoate. with empirical formula of C22H29FN3O9P and molecular
Volume 6, Issue 5, 891-905. Research Article ISSN 2277– 7105
*Corresponding Author
Jayesh A. Patil
Department of Quality
Assurance P.S.G.V.P.
Mandal’s Cop Shahada Dist.
Nandurbar,-425409
Maharashtra. Article Received on 01 March 2017,
Revised on 20 March 2017, Accepted on 10 April 2017
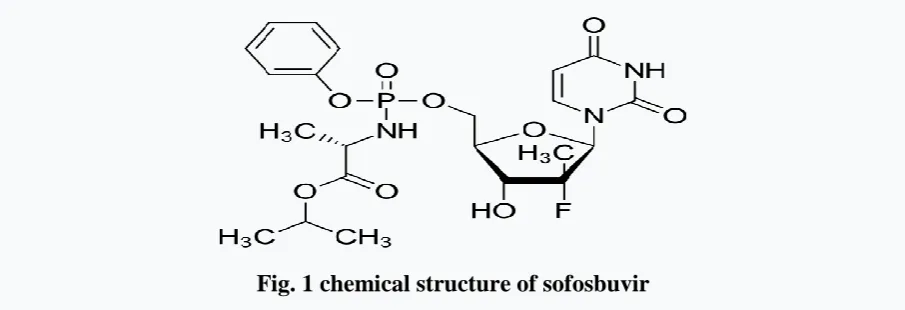
weight 529.4525 g/mol. It is a White to Off-white non- hygroscopic Crystalline solid. slightly soluble in water (pH 1.2-7.7), freely soluble in ethanol and acetone, soluble in 2-propanol and insoluble in Heptane. The chemical structure of SOF was shown in Fig.1.[1,2,3]
Fig. 1 chemical structure of sofosbuvir
FDA has received the New Drug Application for sofosbuvir was submitted on 8 April 2013, granted priority review status and was approved by FDA for the treatment of chronic hepatitis C on 6th December 2013. The FDA approved sofosbuvir in combination with the other drug. Hepatitis caused by HCV has become a major emerging infectious disease, affecting the liver , caused by hepatitis C virus (HCV). The hepatitis c virus (HCV) is spread by blood-to-blood contact and major cause of chronic liver disease with 170 million infected worldwide.(ref. seeff LB. natural history of chronic hepatitis C. hepatology 2002;36(suppl 1):S35-46). approximately 18 million people infected with hepatitis C virus (HCV).[4]
Sofosbuvir is a pro-drug using the Pro-tide biotechnology strategy. It is metabolized to the active anti-viral agent, 2’-deoxy-2’- α -fluoro-β-methyluridine-5’-phosphate. The tri-phosphate serves as a defective substrate for the NS5B protein, which is the viral RNA polymerase, thus acts as an inhibitor of viral RNA synthesis.[5]
EXPERIMENTAL
REAGENTS AND MATERIALS
Chemical: Pure standard of Sofosbuvir was obtained as gift sample from reliable’s shree industrial training centre jalgoan.
Reagents: Acetonitrile (HPLC grade), Water (HPLC grade), Potassium dihydrogen
phosphate (GR grade), Orthophosphoric acid (GR grade).
SOFOVIR Tablets (Hetero Drugs Limited) containing Sofosbuvir Marketed formulation was purchased from local market, High precision weighing balance (wensar instruments, hyderabad), micro pipette (in labs,10100 µl) were employed in the study. All the glassware employed in the work cleaned with hot water followed acetic anhydride then acetone and dried in hot air oven whenever required. Working environment was maintained in 25ºC. However, the Chemical structure and purity of the sample obtained were confirmed by melting point study.
HPLC APPARATUS AND CHROMATOGRAPHIC CONDITIONS
Chromatographic separation was achieved using a C-18 column (250mm × 4.6mm id.,5µm particle size) of Younglin (S.K) Gradient system that is equipped with UV Detector. Sonicator (Labindia Instruments).
Table no:1 Chromatographic Condition
Sr.no. Parameter Description
1 Stationary Phase C18 column with 250 mm × 4.6 mm id and 5µm particle size
2 Mobile Phase Acetonitrile:Water(80:20) pH2.4 adjusted with 0.05%OPA
3 Flow Rate 0.7 ml/min
4 Detection wavelength 260nm
5 Detector UV detector
6 Injector Rheodyne Injector
7 Injection volume 20µl
8 Column Temperature Ambient
Preparation of standard stock solution
10mg accurately weighed drug (sofosbuvir) was put into 10ml volumetric flask containing 10 ml of methanol and sonicated for 10 mins. That makes 1000µgm/ml standard stock solution.
Preparation of sample solutions
= 20 µgm/ml SOFOSBUVIR
2) Take 0.4 ml from stock I and make vol. 10 ML with mobile phase = 40 µgm/ml SOFOSBUVIR
3) Take 0.6 ml from stock I and make vol. 10 ML with mobile phase =60 µgm/ml SOFOSBUVIR
4) Take 0.8 ml from stock I and make vol. 10 ML with mobile phase = 80µgm/ml SOFOSBUVIR
5) Take 1 ml from stock I and make vol. 10 ML with mobile phase = 100 µgm/ml SOFOSBUVIR
RESULT AND DISCUSSION
[image:4.595.166.434.500.726.2]The development of the HPLC method for determination of drugs has received considerable attention in recent years because of its importance in routine quality control analysis. A HPLC method was proposed as a suitable method for the estimation of sofosbuvir in pure and tablet dosage form. A good separation was achieved using a C-18 (250 x 4.6 mm, 5 µm). The Chromatographic condition was adjusted in order to provide a good performance of assay. The method involved a mobile phase consisting of Acetonitrile and Water (pH 2.4 adjusted with 0.05% orthophosphoric acid) in ratio of 80:20 (v / v) accomplished at 260 nm. The retention time 4.35 at flow rate of 0.7 ml/min. and the injection volume was 20µl the total run time for an assay was approximately 4.5 min.
HPLC Method development and optimization: the finally chromatographic
[image:5.595.148.454.123.295.2]condition are,
Fig. no. 3: Optimized chromatogram of sofosbuvir
Parameters of Validation
1. Linearity and Range
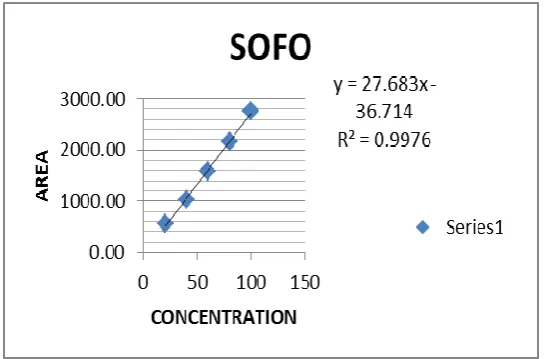
The linearity of an analytical method is its ability to elicit test results which are directly proportional to analyte concentration in samples within a given range. The range of an analytical method is the interval between upper and lower analyte concentration in sample including these concentrations for which it has been established that the analytical method has a suitable level of linearity, accuracy and precision. To establish the linearity and range of proposed methods, various aliquots of standard solution of drug were prepared from stock solution and analyzed. Sample solutions of drug with different conc. from 20 to 100 µg/ml were analyzed by HPLC at 260 nm respectively. Their area measured.
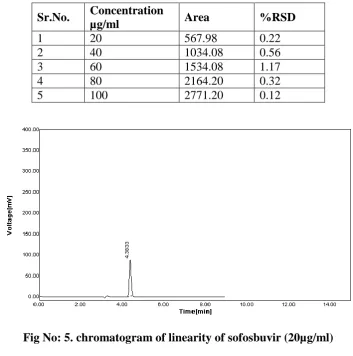
[image:5.595.169.442.561.740.2]Table No: 2. linearity of sofosbuvir
Sr.No. Concentration
µg/ml Area %RSD
[image:6.595.119.473.90.447.2]1 20 567.98 0.22 2 40 1034.08 0.56 3 60 1534.08 1.17 4 80 2164.20 0.32 5 100 2771.20 0.12
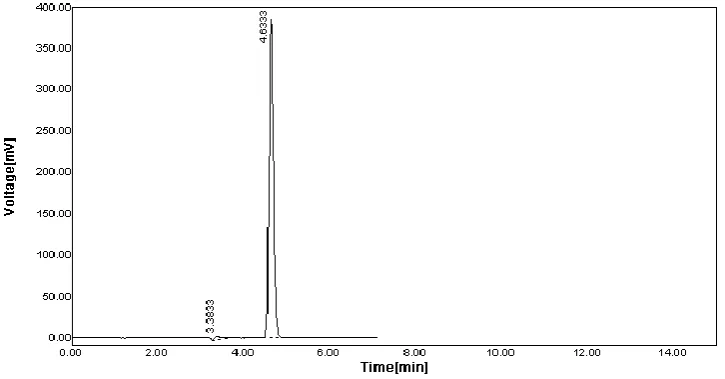
[image:6.595.126.471.463.636.2]Fig No: 5. chromatogram of linearity of sofosbuvir (20µg/ml)
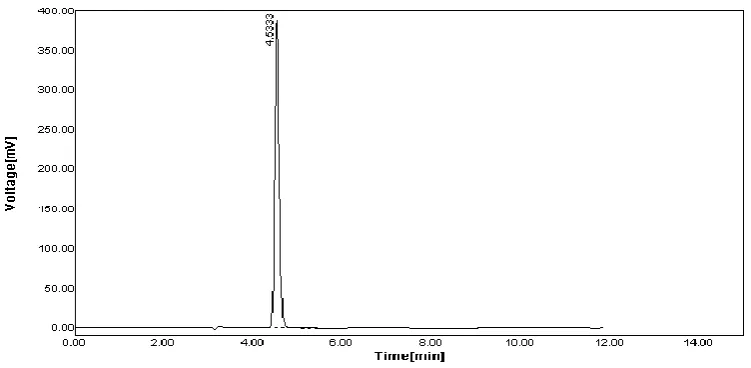
Fig No: 7. Chromatogram of linearity for sofosbuvir (60µg/ml)
Fig No: 8. Chromatogram of linearity for sofosbuvir (80µg/ml)
[image:7.595.118.481.532.721.2]Table No: 3. Linearity results of sofosbuvir
Conc. µg/ml 20 40 60 80 100 Peak Area 567.08 1038.14 1570.72 2159.37 2769.52
Correlation 0.997
Table no: 4. Calibration parameter of sofosbuvir
Parameter Result
Slop 27.68
Intercept 36.71 Correlation co-efficient 0.997
2) PRECISION
The precision of the analytical method was studied by analysis of multiple sampling of homogeneous sample. The precision expressed as standard deviation or relative standard deviation. A system precision was evaluated by measuring the peak response of the drug for three replicate injection of the standard solution prepared as per the proposed method. The chromatogram was shown in Fig. no. 10 & 11 % RSD for peak area obtained in three replicate injections are given in table no. 5 & 6.
Fig No: 11. Chromatogram of intraday Precision for sofosbuvir
Precision results for sofosbuvir
Table no: 5. Interday precision study of sofosbuvir
Conc. (µg/ml)
Peak area
Mean area S.D %RSD
Trial 1 Trial 2
40 1050.04 1070.65 1060.35 14.57 1.37 60 1624.72 1652.5 1638.61 19.64 1.20 80 2156.3 2126.29 2141.30 21.22 0.99
Table no: 6. Intraday precision studies of sofosbuvir
Conc. (µg/ml)
Peak area
Mean area S.D %RSD
Trial 1 Trial 2
40 539.37 548.69 544.03 6.59 1.21 60 1535.21 15555.39 1545.36 14.27 0.92 80 2553.11 2560.32 2556.72 5.10 0.20
3) Repeatability
It was determined by preparing three replicates of same concentration (40 µg/ml HPLC method) of sample and their area measured.
Table No: 7. Repeatability study of sofosbuvir
Sr. no. Conc. Peak area Amt found % amt found
1 40 1010.35 9.45 97.68 2 40 1032.13 6.65 24.13 3 40 1033.12 9.66 99.32
4) Accuracy
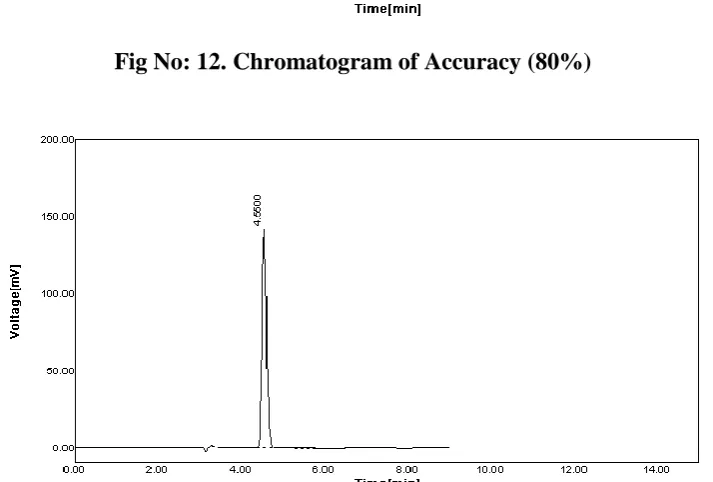
[image:10.595.116.477.231.585.2]Accuracy of a method is the degree to which observed results correspond to true value of analyte in the sample. The determination was done at three different levels (80%, 100%, and 120% of sample concentration). Three samples of each level were prepared and total 6 determinations done as per ICH conditions. The samples were analyzed and their area measured and results indicated as % RSD.
[image:10.595.121.478.411.652.2]Fig No: 12. Chromatogram of Accuracy (80%)
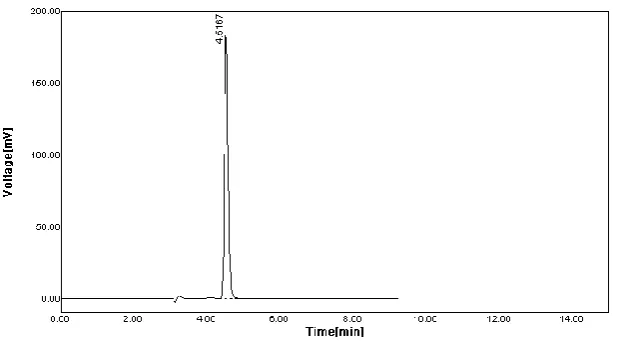
Fig No: 14. Chromatogram of Accuracy (120%)
Table No: 8. Accuracy study of sofosbuvir
Conc. Amt added(µg/ml)
Amt found (µg/ml)
%recovery Mean recovery
Mean added (µg/ml)
Mean
found %RSD
80% 16 36.21 101.32 15.99 16 36.99 1.90 16 37.78 98.63
100% 20 39.74 98.74 19.64 20 74.28 0.72 20 39.54 97.74
120% 24 43.96 99.59 24.17 24 44.20 1.55 24 44.42 101.80
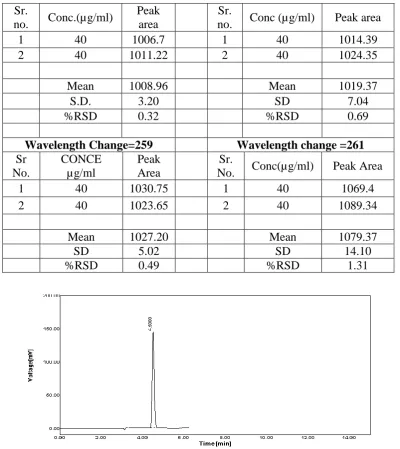
5) Robustness
Robustness of an analytical procedure are measure of its ability to remain unaffected by small changes in method parameters and provide an indication of its reliability.Analysis was carried out at three different wavelengths, flow rates and mobile phase respective area measured (HPLC method). The results were indicated as % RSD.
Table No: 9. Robustness study of sofosbuvir
A: flow rate=0.6 B: flow rate=0.8 Sr.
no. Conc (µg/ml) Peak area
Sr.
no. Conc (µg/ml) Peak area 1 40 1038.71 1 40 1011.11 2 40 1040.1 2 40 1027.01
Mean 1039.41 Mean 1019.06 S.D. 0.98 S.D. 11.24 %RSD 0.09 %RSD 1.10
Fig No: 15. Chromatogram of Robustness (Flow Rate 0.6 ml/min)
Fig No: 16. Chromatogram of Robustness (Flow Rate 0.8 ml/min)
Sr.
no. Conc.(µg/ml)
Peak area
Sr.
no. Conc (µg/ml) Peak area 1 40 1006.7 1 40 1014.39 2 40 1011.22 2 40 1024.35
Mean 1008.96 Mean 1019.37
S.D. 3.20 SD 7.04
%RSD 0.32 %RSD 0.69
Wavelength Change=259 Wavelength change =261
Sr No.
CONCE µg/ml
Peak Area
Sr.
No. Conc(µg/ml) Peak Area 1 40 1030.75 1 40 1069.4 2 40 1023.65 2 40 1089.34
Mean 1027.20 Mean 1079.37
SD 5.02 SD 14.10
[image:12.595.125.472.572.727.2]Fig No: 17. Chromatogram of Robustness (Mobile Phase Composition-79:21)
Fig No: 18. Chromatogram of Robustness (Mobile Phase Composition-81:19)
[image:13.595.116.481.526.692.2]Fig No: 20. Chromatogram of Robustness (Wavelength 261)
6) LOQ AND LOD
Limit of detection (LOD) is the minimum quantity of analyte in sample that can be detected. LOD is calculated from the formula = 3.3 σ/S
σ= Standard deviation of the response, S= slope of the calibration curve, Sofosbuvir = 0.53 Limit of Quantitation (LOQ) It is the lowest amount of analyte in a sample which can be quantitatively determine with suitable precision and accuracy.
LOQ is calculated from the formula = 10 σ/S
σ= Standard deviation of the response, S= slope of the calibration curve, Sofosbuvir = 1.62
TABLET ASSAY
[image:14.595.150.452.587.739.2]Table No: 10. Analysis of marketed formulation
Sr No. Concentration µg/ml Amt. found % Label claim
1 60 59.49 99.15
2 60 60.01 100.02
Mean 24.85 99.58
SD 0.37 0.2
%RSD 1.48 0.2
CONCLUSION
The proposed method was found to be simple, precise, accurate, rapid and specific for determination of Sofosbuvir from pure and its tablet dosage forms. The mobile phase is simple to prepare and economical. The developed method is accurate, precise and reliable for the analysis of Sofosbuvir in Pharmaceutical formulations. This method was validated for linearity, accuracy,precison, Repeatability, robustness, LOD and LOQ, of sofosbuvir drug. The RSD values for all parameters were found to be <2, which indicates the validity of method and results obtained by this method is with fair agreement. Hence, this method can be easily and conveniently adopted for routine analysis of Sofosbuvir in pure and tablet dosage form and also can be used for dissolution or similar studies.
REFERENCE
1. Moyer VA. Screening for hepatitis C virus infection in adults: US Preventive Services Task Force recommendation statement. Annals Int med. 2013; 159(5): 349-357.
2. Armstrong GL, Wasley A, Simard EP, McQuillan GM, Kuhnert WL, Alter MJ. The prevalence of hepatitis C virus infection in the United States, 1999 through 2002. Ann Intern Med. 2006; 144(10): 705-714.
3. Chak E, Talal AH, Sherman KE, Schiff ER, Saab S. Hepatitis C virus infection in USA: an estimate of true prevalence. Liver Int 2011; 31(8): 1090-1101.
4. WHO. 1997. Hepatitis C: global prevalence. Wkly. epidemiol. Rec. 72: 341-344.
5. Sofosbuvir Full Prescribing Information. Www.Gilead.com. Retrieved 28 October 2014. 6. British Pharmacopoeia, the Stationary Office, and London, 2006; I: 149.