DEVELOPMENT AND VALIDATION OF RP-HPLC METHOD FOR
THE SIMULTANEOUS ESTIMATION OF EZETIMIBE AND
SIMVASTATIN IN BULK AND COMBINED TABLET DOSAGE FORM.
Sonali M. Patil*, S. R. Bavaskar and S. D. Barhate
Department of Quality Assurance, Shree Sureshdada Jain Institute of Pharmaceutical
Eduction and Research, Jamner-424206.
ABSTRACT
A new Simple, Precise, Fast and Accurate RP-HPLC Method has been
developed and validated for simultaneous estimation of Ezetimibe and
Simvastatin in bulk and combined dosage form. The method was
carried out on the chromatographic separation was achieved by
isocratic elution technique on (reverse phase) Primesil C18 column
(250 mm x 4.6 mm ID, Particle size 5µm), using mobile phase
composition of Methanol: Water (0.05%OPA) in the ratio of 90:10 v/v
with a flow rate 1.0ml/min. The separation was observed at 239 nm.
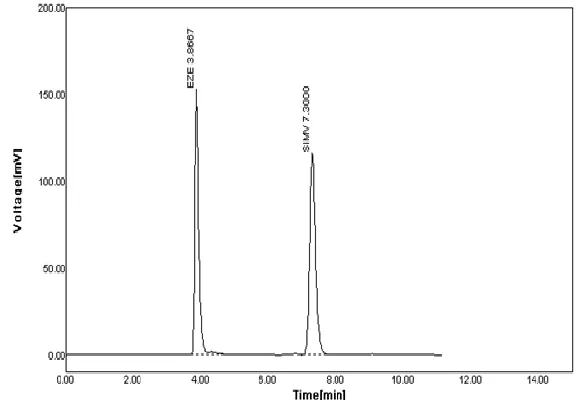
The retention time of Ezetimibe and Simvastatin were found to be 3.98
min and 7.91 min respectively. The Ezetimibe and Simvastatin
followed linearity in the concentration range of 25μg/ml and
5-25μg/ml respectively with r²=0.999 for both Ezetimibe and
Simvastatin. The amount of both drugs estimated by the proposed method was found to be in
good agreement with labelled claim. The developed method was validated for precision,
accuracy, sensitivity, robustness and ruggedness. The developed method can be used for
routine analysis of titled drugs in combined dosage form.
KEYWORDS: Ezetimibe and Simvastatin, RP-HPLC, Validation.
Volume 5, Issue 9, 705-714. Research Article ISSN 2277– 7105
*Corresponding Author
Sonali M. Patil
Department of Quality
Assurance, Shree
Sureshdada Jain Institute of
Pharmaceutical Eduction
and Research,
Jamner-424206.
Article Received on 23 June 2016,
Revised on 13 July 2016, Accepted on 02 August 2016
INTRODUCTION EZETIMIBE
Fig No. 1: Chemical Structure Of Ezetimibe.
Ezetimibe[Fig no1] is an anti hyperlipidemic medication which is used to lower cholesterol
levels. Chemically, Ezetimibe is (3R,4S) –1–(4 flurophenyl)–3-[(3S)-3- (4– flurophenyl)– 3 –
hydroxypropyl] -4 –(4 hydroxyphenyl)azetidin – 2- one.[4] It localizes and appears to act at
the blush border of the small intestine and inhibits the absorption of cholesterol, leading to
decrease in the delivery of intestinal cholesterol to the liver.[4-5]
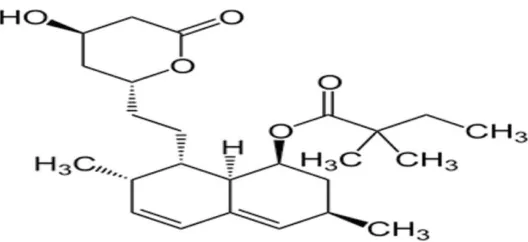
SIMVASTATIN
Fig No.2: Chemical Structure of Simvastatin.
Simvastatin[Fig no2] is a derivative of lovastatin and potent competitive inhibitor of
3-hydroxy-3-methyl glutaryl coenzyme. Simvastatin is [(1S,3R,7S,8S,8Ar) –8–[2–[(2R,4R)–4 – hydroxyl– 6–oxooxan -2 –yl] ethyl] – 3,7– dimethyl –1,2,3,7,8,8a– hexahydronaphthalene–
1– yl] 2,2–dimethyl butanoate.[4] In Simvastatin, the six membered lactone ring of
simvastatin is hydrolysed in vivo to generate mevilonic acid and active metabolite structurally
similar to HMG CoA (Hydroxymethylglutaryl CoA).Once hydrolysed, simvastatin competes
with HMG – CoA for HMG – CoA reductase, a hepatic microsomal enzyme. Interference
with the activity of this enzyme reduces the quality of mevalonic acid precursor of
[image:2.596.167.431.390.511.2]MATERIALS AND METHODS Materials
Ezetimibe and Simvastatin was purchased from Swapnroop drug and pharmaceuticals.
Commercial Tablet of Ezetimibe and Simvastatin named Simvotin EZ was purchased from
local market. All other chemicals and reagents used are HPLC grade manufactured by Merck
Ltd. India.
Instrument and chromatographic conditions
High performance liquid chromatography YounglineAcme9000 having autochro-3000
software containing primesilC18 column (250mm X 4.6mm, 5µm) was used for the study.
UV-Spectrophotometer is used as a detector. The mobile phase used was Methanol: Water
(0.05% Orthophosphoric acid) in the ratio of 90:10% v/v maintained at pH 3 with a flow rate
1.0 ml/min. Mobile phase and sample solutions were filtered through a 0.45 μm membrane
filter and degassed in Sonicator. The effluent was detected at 239 nm. The Column temperature was maintained at ambient and the volume of injection is 20 μl.
Preparation of mobile phase
The mobile phase was prepared by Mixing Methanol (90ml) and Water (10ml) and adjusted
to the pH 3 with Ortho Phosphoric Acid. The prepared mobile phase was degassed by
ultrasonication for 20 min so as to avoid the disturbances caused by dissolved gases. This
degassed mobile phase was filtered through 0.45 g membrane nylon filter to remove smaller
particles that may be present in mobile phase.
Preparation of solutions Standard stock solution
Standard stock solution prepared of accurate weight of 10mg of Ezetimibe and 10 mg of
Simvastatin transfer into clean dry 10 ml volumetric flask add about the 9 ml Methanol
Diluent and sonicate to dissolve in it completely and make volume up to the mark with the
same solvent. (Stock were prepared) Then from that stock solution pipette out 0.1ml solution
& dilute to 10 ml in volumetric flask. add about the mobile phase methanol: Water(90:10 v/v)
Working standard solution
1mL of standard stock solution was pipetted into 10mL volumetric flask and diluted up to the
mark with diluent and filtered through 0.45μ Millipore Nylon filter to obtain concentration of
10 μg/ml.
EXPERIMENTAL
Study of spectra and selection of wavelength
UV Detector was selected and solution 10 µg/mL of Ezetimibe and Simvastatin was scanned
in the range of 400 – 200nm. A fix concentration of analyte were analysed at different
wavelengths. As per response of analyte, 239nm wavelength was selected. The UV Spectra of
[image:4.596.149.443.305.501.2]Ezetimibe and Simvastatin is as shown in Fig. 3.
[image:4.596.158.439.553.733.2]Analysis of marketed formulation Procedure
For analysis of the tablet dosage form, 20 tablets were weighed individually and their average
weight was determined after that they were crushed to fine powders and power equivalent to
weight 173 mg of was weighed and transferred to 10 ml volumetric flask &. were dissolved
in HPLC grade methanol. the solutions were shaken vigorously for 10 min and filtered
through 0.45 µg nylon membrane filters. Then volume was made up to mark with methanol.
From the above solutions 0.20 ml from Stock was taken and diluted to 10 ml with mobile
phase to get a solution containing 20 µg/ml and 20 µg/ml respectively, so that the the solution
contains Ezetimibe and Simvastatin in the proportions of 10:10 The amounts of Ezetimibe
and Simvastatin per tablet were calculated by extrapolating the value of area from the
calibration curve. Analysis procedure was repeated five times with tablet formulation. Result
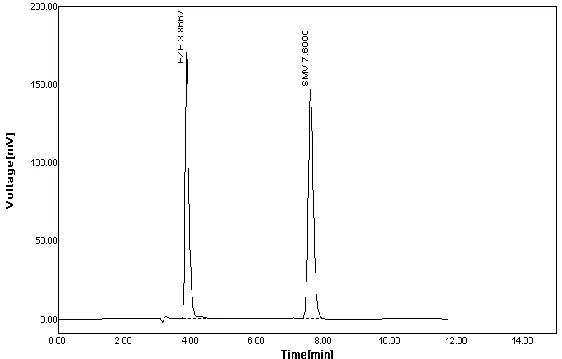
[image:5.596.149.440.362.562.2]is shown in (Table No. 1).
Fig. No. 5 Chromatogram of Ezetimibe and Simvastatin in tablet formulation.
TABLE 1. Analysis of marketed formulation.
Sr.no Amount present in mcg Amount found in mg % Label claim Ezetimibe Simvastatin Ezetimibe Simvastatin Ezetimibe Simvastatinn
1 20 20 19.35 19.92 96.78 99.60
2 20 20 19.64 19.96 98.24 99.80
Mean _ _ 24.85 20.73 97.51 99.70
SD _ _ 0.21 0.03 0.35 0.64
Analytical Validation Method
The method was validated in terms of the following parameters; linearity, accuracy,
precision, repeatability, robustness, LOD, LOQ and system suitability parameters as per the
ICH Guidelines.
1) Linearity
From Ezetimibe and Simvastatin standard stock solution, different working standard solution
(5, 10, 15, 20, 25μg/ml) were prepared in mobile phase. Chromatogram was recorded. The
plot of linearity plotted graphically as a function of analyte concentration is as shown in fig.6
and 7.
Table. 2. Linearity of Ezetimibe. Table. 3. Linearity of Simvastatin. Sr.
No.
Concentration μg/ml
Area
Ezetimibe Sr. No.
Concentration μg/ml
Area Simvastatin
1 5 250.42 1 5 293.39
2 10 558.99 2 10 631.07
3 15 904.09 3 15 996.16
4 20 1186.35 4 20 1377.55
5 25 1538.38 5 25 1709.80
[image:6.596.78.516.285.768.2]2) Accuracy
The accuracy study was performed at three different levels (80%, 100% and 120% of the test
concentration). The mean % recoveries were found to be between 98–102% as required by
ICH guidelines. The results of the recovery studies and its statistical validation data are given
in Table No.4 and 5.
TABLE 4. Recovery studies of Ezetimibe and Simvastatin. Level of
Recovery (%)
80 100 120
EZE SIM EZE SIM EZE SIM
Amount present (mg) 10 10 10 10 10 10 10 10 10 10 10 10 Amount of Std.
Added (mg)
8 8 8 8 10 10 10 10 12 12 12 12 Amount Recovered (mcg) 8.09 7.87 7.67 9.75 9.52 9.67 10.15 10.30 12.18 12.01 11.75 11.91
% Recovery 101.15
99.31 98.19 98.65 95.21 96.72 101.56 103.09 101.55 100.96 97.96 99.26 *mean of each 3 reading.
TABLE 5. Statistical Validation of Recovery Studies. Level of
Recovery (%) Drug
Mean % Recovery*
Standard
Deviation* %RSD*
80 EZE 100.23 99.77 100.00
SIM 98.42 0.33 0.33
100 EZE 95.97 1.07 1.11
SIM 102.33 1.08 1.06
120 EZE 101.26 0.42 0.41
SIM 98.61 0.92 0.93
*mean of each 3 reading. 3) Precision
Precision of the analytical method is expressed as the series of the measurement. It was
ascertained by replicate estimation of the drug by the proposed method as shown in (Table
No.6).
Table No. 6: Result of Intra day and Inter day Precision for Ezetimibe & Simvasatatin.
Drug Conc
n
(µg/ml)
Intraday Precision Interday Precision
Mean SD %Amt
Found Mean SD
% Amt Found Ezetimibe
10 556.99 9.33 98.39% 558.28 4.36 98.59%
15 902.68 4.29 101.57% 905.82 4.65 101.89%
Simvastatin 10 629.58 11.68 98.10% 635.58 6.02 98.94%
15 976.96 6.60 97.74% 995.46 4.48 99.46%
20 1369.80 0.94 100.73% 1366.44 2.79 100.50%
*Mean of each 3 reading
4) System suitability parameters
System suitability tests are an intergral part of method development and are used to ensure
adequate performance of the chromatographic system. Retention time, number of theoretical
plates, tailing factor and peak area were evaluated replicate five injections of the Ezetimibe &
Simvastatin at a concentration of 5-25 µg/ml.) The result shown in below (Table No.7).
TABLE 7. Result of System Suitability Parameters. System Suitability Parameters
*Mean of Five Determination System Suitability Parameters
EZE SIM
Retention Time(min) 3.92 min 7.69 min
Area 975.5652 1072.14
Theoretical Plate Number 7869.18 1231.92
Tailing Factor 1.3721 1.2105
Resolution 0.0000 16.49
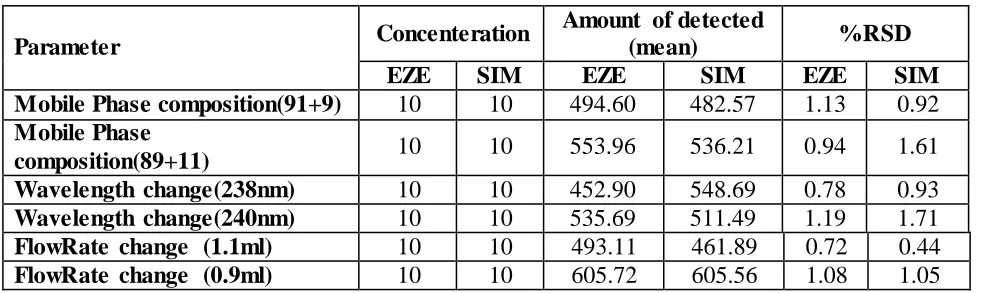
*Mean of each 5 reading. 5) Robustness
The Robustness of a method is its ability to remain unaffected by small deliberate changes in
parameters. To evaluate the robustness of the proposed method, small but deliberate
variations in the optimized method parameters were done. The effect of changes in mobile
phase composition and flow rate on retention time and wave length of drug peak was studied.
The results of robustness studies are shown in (Table No.8).
TABLE 8. Result of Robustness Studies.
Parameter Concenteration
Amount of detected
(mean) %RSD
EZE SIM EZE SIM EZE SIM
Mobile Phase composition(91+9) 10 10 494.60 482.57 1.13 0.92 Mobile Phase
composition(89+11) 10 10 553.96 536.21 0.94 1.61
Wavelength change(238nm) 10 10 452.90 548.69 0.78 0.93
Wavelength change(240nm) 10 10 535.69 511.49 1.19 1.71
FlowRate change (1.1ml) 10 10 493.11 461.89 0.72 0.44
[image:8.596.55.546.594.741.2]6) Detection Limit (LOD)
The LOD is the lowest limit that can be detected. based on the S.D. deviation of the response
and the slope, the detection limit was found to be Ezetimibe 0.21 µg/ml and Simvastatin 0.33
µg/ml.
TABLE 9. Result of Detection Limit.
7) Quantification Limit (LOQ)
TABLE 10. Result of Quantification Limit.
The LOQ is the lowest concentration that can be quantitatively measured. Based on the S.D.
deviation of the response and the slope, the quantification limit was found to be Ezetimibe
0.65 µg/ml and Simvastatin 1.02 µg/ml.
RESULTS AND DISCUSSION
In this method Linearity was studied as 5-25 μg/ml. The accuracy of method was determined
by calculating mean percentage recovery. It was determined at 80,100 and 120% level. In this
method precision was studied as repeatability and inter and intra-day variations for both
drugs and both were found in limit. System suitability parameters were satisfactory and the
theoretical plates were obtained above 2000 The % recovery, robustness, LOD, LOQ,
parameter data were presented in (Table 1-10).
CONCLUSION
The developed was found to be simple, precise, economic, fast. Further, the developed
method is simple and can usually be used for estimation of both these drugs in their combined
dosage form. This method is used for routine analysis of drugs in bulk and Combined dosage
form.
ACKNOWLEDGEMENTS
The authors are thankful to S.S.J.I.P.R’S College of Pharmacy, Jamaner, 424206
Maharashtra, India, for providing the necessary facilities and help in carrying out my
Drug Name LOD
Ezetimibe 0.21
Simvastatin 0.33
Drug Name LOQ
Ezetimibe 0.65
REFERENCES
1. Merck index, Maryadele J.O. Neil Edu. In: 13th ed. Published by Merck Research Lab.,
NJ, USA. 2001; 868.
2. Merck index, Maryadele J.O. Neil Edu. In: 13th ed. Published by Merck Research lab., NJ
and USA. 2001; 148.
3. BECKETT, A.H. And STENIAKE J.B (Eds) practical pharmaceutical chemistry, 4th Ed.
2parts, New Delhi: CBS Publishers And Distributors.
4. Nalini Kanta Sahoo, et al, “Quantification and validation of simvastatin and ezetimibe in
bulk drugs and combined dosage forms by RP-HPLC’’. Pharma Methods, 2010; 6(2):
115-9.
5. Madhu Latha, etal, “Validation stability indicating HPLC method for simultaneous
determination of simvastatin and ezetimibe in bulk drug and pharmaceutical
formulation’’. IJRPC, 2014; 4(2): 406-414.
6. Stephen Rathinaraj, et al, “Quantitative analysis of simvastatin and ezetimibe of drug in combined dosage forms by HPLC’’. IJPBS, 2010; (2).
7. Ravi Varma, “Estimation of simvastatin and ezetimibe in combined tablet formulaion by
stability indicating high performances liquid chromatography’’. Scholars research library,
2015; 7(8): 204-212.
8. Nagi Reddy, “Stability indicating method development and validation for the
determination of simvastatin and ezetimibe in tablet dosage form by RP-HPLC”.
IJPRBA, 2012; (1): 32-41.
9. Nilesh Jain et al, “RP-HPLC method for simultaneous estimation of simvastatin and