1
Experimental and modeling study of high performance direct carbon solid oxide fuel cell with in situ catalytic steam-carbon gasification reaction
Haoran Xu1,2, Bin Chen1, Houcheng Zhang1,3, Peng Tan1, Guangming Yang4,
John T.S. Irvine2*, Meng Ni1,5*
1 Building Energy Research Group, Department of Building and Real Estate
The Hong Kong Polytechnic University, Hung Hom, Kowloon, Hong Kong, China
2 School of Chemistry, University of St Andrews, St Andrews, Fife, KY16 9ST, UK 3 Department of Microelectronic Science and Engineering, Ningbo University, Ningbo
315211, China
4 Jiangsu National Synergetic Innovation Center for Advanced Materials (SICAM), College
of Chemical Engineering, Nanjing Tech University, No.5 Xin Mofan Road, Nanjing 210009, P.R. China
5 Environmental Energy Research Group, Research Institute for Sustainable Urban
Development (RISUD), The Hong Kong Polytechnic University, Hung Hom, Kowloon, Hong Kong, China
Abstract:
In this paper, 2D models for direct carbon solid oxide fuel cells (DC-SOFCs) with in situ catalytic steam-carbon gasification reaction are developed. The simulation results are found to be in good agreement with experimental data. The performance of DC-SOFCs with and without catalyst are compared at different operating potential, anode inlet gas flow rate and operating temperature. It is found that adding suitable catalyst can significantly speed up the
in situ steam-carbon gasification reaction and improve the performance of DC-SOFC with H2O
as gasification agent. The potential of syngas and electricity co-generation from the fuel cell is also evaluated, where the composition of H2 and CO in syngas can be adjusted by controlling
2
catalytic carbon gasification by steam. The results of this study form a solid foundation to understand the important effect of catalyst and related operating conditions on H2O-assisted
DC-SOFCs.
Keywords: Fuel cell; carbon gasification; syngas generation
* Corresponding authors:
Email: bsmengni@polyu.edu.hk; Tel: 852-27664152; Fax: 852-27645131 (NI M).
3 1. Introduction
With the increasing global attention on energy crisis and related environmental problems such as global warming and air pollution, clean utilization of energy and high efficiency energy conversion devices have received great interest from all over the world. Apart from developing renewable energy technologies, the clean and efficient utilization of fossil fuels remains to be an important topic as fossil fuels will continue to be the dominating energy source in the coming decades.
Solid oxide fuel cell (SOFC) is one of the most attractive clean and high efficient energy conversion devices for electricity power generation [1-5]. SOFCs are all solid-state devices with sandwiched structure working at high temperature (e.g. 800 oC). Its sandwiched structure
includes two porous electrodes for electrochemical reactions with a dense electrolyte between them for gas separation and O2- ions transportation. The electrochemical reaction between fuels
(e.g. H2) and oxidants in electrodes ensures the high energy conversion efficiency. The
post-process of emission gases is also relatively easy as they are separated by the dense electrolyte. To achieve a lower operational cost and higher volumetric energy density, the direct utilization of solid carbon in SOFCs (called as direct carbon solid oxide fuel cells, DC-SOFCs) has received rising interest [6-9]. In DC-SOFCs, solid carbon is placed in the anode chamber and chemically oxidized by an agent gas (e.g. CO2) to form gaseous fuel (e.g. CO). The produced
4
process to take place continuously as long as there is enough solid carbon for gasification. The gasification reaction between solid carbon and CO2 is called reversible Boudouard reaction,
which is a key reaction affecting the performance of DC-SOFC. As reported by Wu et al.[10], adopting FemOn-alkaline metal oxide catalyst greatly enhanced CO formation rate in graphite
(e.g. 19 times improvement at 800 oC) and activated carbon (e.g. 6 to 155 times improvement
at 800 oC depending on the surface area). Benefited from the largely enhanced Boudouard
reaction, they successfully obtained a peak power density of 286 mW cm-2 at 1123 K even
without external CO2 feeding. Similarly, Tang et al. [11] significantly improved the
performance of DC-SOFC (10 times higher output power density at 1073K) by loading Fe-based catalyst on the carbon fuel. Considering the importance of catalyst for Boudouard reaction in DC-SOFCs, Li et al.[12] compared Ni, K and Ca additives in carbon black and found that the catalytic effects were: K>Ni>Ca. Borja et al. [13] further studied the synergistic effect of the carbonate catalysts and Li-K carbonate system displayed the highest power densities compared with Li-Na, Li-Na-K, Li-Ba and Na-K carbonate mixtures. Apart from the use of catalysts, the carbon structure also affect the Boudouard reaction rate. Jiao et al. [14] treated coal char with alkali for structure modification to enlarge its specific surface. The output power density of DC-SOFCs was increased significantly from 62 mW cm-2 to 220 mW
cm-2 at 1123K. In addition, some researchers recently proposed using H
2O instead of CO2 as
agent for carbon gasification. Ong and Ghoniem [15] developed a 1D model to compare H2O
5
fuel cell with external carbon gasification was improved by 3-5 times with H2O recycling from
anode to the gasifier instead of CO2 between 700 ºC and 800 ºC. In the indirect carbon SOFC,
the carbon gasifier needs significant amount of heat input while the heat generated from SOFC is not well utilized. For comparison, the generated heat in the SOFC can be easily used by the carbon gasification reaction in a DC-SOFC, which could improve the overall energy efficiency of the energy efficiency of the carbon-based SOFC system. More recently, experimental and modeling works on DC-SOFC with internal carbon gasification by CO2 and H2O were
conducted by Xu et al. [16]. Benefited from a much faster carbon gasification rate with H2O as
agent, a significant improvement of peak power density was found from 158 mW cm-2 (with
CO2 as agent) to 385 mW cm-2 (with H2O as agent) at 1123K. Besides, using H2O as a
gasification agent offers DC-SOFC the potential for syngas and electrical power co-generation. As the syngas (CO and H2 mixture) is an important raw material for fuel and chemical
industries, sometimes both electricity and syngas are needed simultaneously. Thus, users can control the operating condition of a single device to obtain their preferred product. Although the benefits brought by using H2O as DC-SOFC agent have been demonstrated, no study about
in situ catalytic steam-carbon gasification in DC-SOFCs has been reported yet. According to Kopyscinski et al. [17], suitable catalysts like K2CO3 could hopefully increase the
6
concentration at the anode outlet can be obtained for wider applications such as fuel and electricity co-generation. Therefore, there is a need to systematically investigate the improvement brought by in situ catalytic steam-carbon gasification in DC-SOFCs.
In order to fill the research gap mentioned-above, both experimental and numerical studies are conducted for DC-SOFCs with in situ catalytic steam-carbon gasification reaction. Experimental I-V curves and detailed numerical simulations are carried out in this paper to evaluate the catalyst effect and the potential of the DC-SOFC for electricity and fuel co-generation. The models are validated by comparing the simulation results with experimental data and good agreement is observed.
2. Model description
The chemical/electrochemical reaction, ion/electron conduction and mass/momentum transportation are fully coupled in the 2D mathematical DC-SOFC models. The schematics of DC-SOFC using H2O as agent is shown in Fig.1. Solid carbon is placed in the anode chamber
(near the porous anode) and H2O is supplied from the anode inlet for steam-carbon gasification.
The button cell has a surface area of 0.45 cm2 with the thickness of its anode, electrolyte and
7 2.1 Model assumption
(1) Both H2 and CO participate in the electrochemical reactions and the TPB sites they shared
is proportional to their local concentration percentage.
(2) TPB sites are distributed uniformly in the whole porous electrode. Both ionic- and electronic- conducting phases in the porous electrodes are homogeneous and continuous. (3) Gases in the model (CO, H2O, H2, O2, N2) are ideal gases.
(4) Temperature distribution in the cell is uniform due to its small size.
(5) The volume of carbon fuel in the anode chamber does not change with time. 2.2 Chemical reactions
In anode chamber, the key chemical reaction (Eq. (1)) in the DC-SOFC is steam-carbon gasification, which converts solid carbon into gas fuels (H2 and CO). Its reaction rate can be
calculated by Eq. (2)[23]. Different tuning parameters (listed in Table 2) are used when catalyst is adopted for the reaction.
𝐶 + 𝐻2𝑂 ↔ 𝐶𝑂 + 𝐻2 (1)
𝑅𝐶_𝐻2𝑂 = 𝐾1𝑝𝐻2𝑂
1+𝐾2𝑝𝐻2+𝐾3𝑝𝐻2𝑂 (2)
As CO2 is formed in the electrochemical oxidation of CO, the Boudouard reaction (Eq. (3)) is
also considered. Its reaction rate can be calculated by Eq. (4)[23]. 𝐶 + 𝐶𝑂2 ↔ 2𝐶𝑂 (3)
𝑅𝐶_𝐶𝑂2 =1+𝐾 𝐾4𝑝𝐶𝑂2
5𝑝𝐶𝑂+𝐾6𝑝𝐶𝑂2 (4)
8
in porous electrode is also considered as shown in Eq. (5). Its reaction rate can be calculated by Eqs. (6-9).[24]
𝐶𝑂 + 𝐻2𝑂 ↔ 𝐶𝑂2+ 𝐻2 (5) 𝑅𝑊𝐺𝑆𝑅 = 𝑘𝑠𝑓(𝑝𝐻2𝑂𝑝𝐶𝑂−
𝑝𝐻2𝑝𝐶𝑂2
𝐾𝑝𝑠 ) (6)
𝑘𝑠𝑓 = 0.0171exp(−103191𝑅𝑇 ) (mol m-3 Pa-2 s-1) (7)
𝐾𝑝𝑠 = exp(−0.2935𝑍3+ 0.6351𝑍2 + 4.1788𝑍 + 0.3169) (8)
𝑍 = 1000𝑇 − 1 (9)
2.3 Electrochemical reaction
Both H2 and CO produced in the chamber will transport to anode TPB sites where they
electrochemically react with O2- and release electrons as shown in Eq. (10) and Eq. (11). The
O2- ions transport through the electrolyte from the cathode, where the O
2 molecules are reduced
as shown in Eq. (12).
𝐻2+ 𝑂2− → 𝐻2𝑂 + 2𝑒− (10)
𝐶𝑂 + 𝑂2− → 𝐶𝑂
2+ 2𝑒− (11)
𝑂2+ 4𝑒− → 2𝑂2− (12)
Based on the above equations, respective equilibrium potentials (𝐸𝑒𝑞) for H2 and CO as fuel
can be calculated as Eq. (13) and Eq. (14) 𝐸𝐶𝑂 = 𝐸𝐶𝑂0 +𝑅𝑇
2𝐹ln [
𝑃𝐶𝑂𝐿 (𝑃𝑂2𝐿 )1⁄2
𝑃𝐶𝑂2𝐿 ] (13)
𝐸𝐻2 = 𝐸𝐻02 +𝑅𝑇
2𝐹ln [
𝑃𝐻2𝐿 (𝑃𝑂2𝐿 )1⁄2
𝑃𝐻2𝑂𝐿 ] (14)
9
the operating temperature (K), F is the Faraday constant (96485 C mol-1). 𝑃𝐿 is the local gas
partial pressure (Pa). The values of 𝐸𝐶𝑂0 and 𝐸
𝐻02 can be calculated by Eq. (15) and Eq. (16): 𝐸𝐶𝑂0 = 1.46713 − 0.0004527𝑇 (V) (15)
𝐸𝐻2
0 = 1.253 − 0.00024516𝑇 (V) (16)
It should be noted that the equilibrium potentials calculated by Eq. (13) and Eq. (14) are equal at an open circuit condition. When current is extracted from DC-SOFC, the equilibrium potentials for H2 fuel and CO fuel become different due to the different overpotential losses
involved in electrochemical oxidation of H2 and CO.
The operating potential (V) can be calculated by equilibrium potential and operating overpotential losses (V) as shown in Eq. (17):
𝑉 = 𝐸𝑒𝑞− 𝜂𝑎𝑐𝑡− 𝜂𝑜ℎ𝑚𝑖𝑐 (17)
The operating overpotential loss includes activation overpotential loss (𝜂𝑎𝑐𝑡) and ohmic loss
(𝜂𝑜ℎ𝑚𝑖𝑐). 𝜂𝑎𝑐𝑡 reflects the potential barrier for the electrochemical reaction to overcome,
which can be described by Butler-Volmer equation as shown in Eq. (17). 𝑖 = 𝑖0{exp (𝛼𝑛𝐹𝜂𝑅𝑇𝑎𝑐𝑡) − exp ((1−𝛼)𝑛𝐹𝜂𝑅𝑇 𝑎𝑐𝑡)} (17)
where 𝑖 is the operating current density (A m-2), 𝑖
0 is the exchange current density (A m-2),
𝛼 is the electron transfer coefficient and 𝑛 is the number of transferred electrons per electrochemical reaction. Considering temperature effect, 𝑖0 can be further expressed as Eq. (18).
10 where 𝛾 (A m-2) is the pre-exponential factor and 𝐸
𝑎𝑐𝑡 is the activation energy level (J mol-1).
The ohmic overpotential (𝜂𝑜ℎ𝑚𝑖𝑐) is related to the current intensity and ionic/electronic
conductivity of the cell, and can be calculated by Ohm law. More detailed information can be found in our previous works [25-28].
2.4 Mass and momentum transport
Extended Fick’s model is used to calculate the rate of mass transport (𝑁𝑖, 𝑚𝑜𝑙𝑚−3𝑠−1) in
channels and porous electrodes as shown in Eq. (19)[29]: 𝑁𝑖 = −𝑅𝑇1 (𝐵0𝑦𝑖𝑃
𝜇 ∂P
∂z− 𝐷𝑖
𝑒𝑓𝑓 ∂(𝑦𝑖P)
∂z )(𝑖 = 1, … , 𝑛) (19)
where 𝐵0 is the permeability (m2) of the porous electrodes, 𝑦𝑖 is the mole fraction of
component i,𝜇 is the gas viscosity (N m-1 s-1) and 𝐷
𝑖𝑒𝑓𝑓 is the overall effective diffusion
coefficient (m2 s-1) of component i in the porous electrodes, which can be calculated by Eq.
(20) [30]: 𝐷𝑖𝑒𝑓𝑓 = 𝜀𝜏( 1
𝐷𝑖𝑚𝑒𝑓𝑓+ 1 𝐷𝑖𝑘𝑒𝑓𝑓)
−1 (20)
where 𝜀 is the porosity, 𝜏 is the tortuosity factor, 𝐷𝑖𝑘𝑒𝑓𝑓 and 𝐷𝑖𝑚𝑒𝑓𝑓 are Knudsen diffusion coefficient (m2 s-1) and molecular diffusion coefficient (m2 s-1), respectively. Detailed
calculation of 𝐷𝑖𝑚𝑒𝑓𝑓and 𝐷𝑖𝑘𝑒𝑓𝑓can be found in ref. [31]. It should also be noted that the Knudsen diffusion mechanism is neglected in the gas channels as the channel size is considerably larger than the mean-free path of the molecular species.
11 𝜌𝜕𝑢𝜕𝑡+ 𝜌𝑢∇𝑢 = −∇𝑝 + ∇[𝜇 (∇𝑢 + (∇𝑢)𝑇) −2
3𝜇∇𝑢] − 𝜀𝜇𝑢
𝑘 (21)
where 𝜌 (kg m-3) is the gas density and u (m s-1) is the velocity vector. When the last term on
the right side is neglected, Eq. (20) is reduced to conventional N-S equation for momentum conservation in gas channels.
2.5 Model solution
Electric potentials are specified at the two electrodes while two ends of the cell are electrically insulated. Inflow gas mole fraction and flow rate (SCCM) are given at the inlets. The outflow condition is specified at the outlets of the gas channels. Zero flux is specified at the end of the electrodes and pressure condition is specified at the outlets of the two gas channels. The model is solved at given operating conditions such as electric potentials, temperature, inlet gas flow rate and mole fraction. The output of the model includes distributions of the electrochemical reaction rates, chemical reaction rates and mole fraction of gas species in the cell. The commercial software COMSOL MULTIPHYSICS® is employed for the numerical
simulation.
3 Results and discussion
3.1 Experiments for model validation
The fuel cell adopted in this study for model validation employed Ni-YSZ as anode supporting the bilayer YSZ/SDC electrolyte and LSCF cathode. Na2CO3 was adopted as the catalyst to
12
solution under vigorous stirring for 12 hours. The colloid was dried at 110 oC for 4 hours and
then calcined at 500 oC in nitrogen for 2 hours. It should be noted that the present study is the
first attempt to improve the performance of DC-SOFC by in-situ catalytic steam-gasification of carbon. The focus is to demonstrate the effect of catalyst on power generation and syngas co-generation. The lab-scale impregnation method for catalyst addition to carbon fuel ensures good contact between the carbon particles and the catalyst, which could facilitate carbon gasification and is beneficial to DC-SOFC. However, the impregnation method may not be practical for large-scale applications due to the relatively high cost. For practical applications, industrial scale carbon/coal gasification technology should be adopted. For example, physical mixing in a fluidized bed offers a simple and low cost option and can be employed for large-scale applications.
For the fuel cell test, the bottom cell was sealed onto a quartz tube by silver paste. The anode and cathode surfaces were printed with silver layers for current collection. 0.2 g solid carbon was fixed by asbestos in the anode chamber. A quartz tube was positioned beneath the carbon layer for introducing steam. The inlet gas flow rate of anode was set as 90 SCCM (standard conditions). 30 SCCM H2O was carried into anode by 60SCCM N2 in the test. The operating
temperature was kept constant at 850 o
C during the test. Current-voltage values were collected based on the four-terminal configuration. The schematic designs for fuel cell tests could be found in ref. [10].
13
compared with experimental data as shown in Fig. 2. The quite small difference between the modeling results and experimental data validates the present model. The same structure and tuning parameters are used in the subsequent parametric simulations. It should be mentioned that the activated carbon is use in the experiments for model validation. When other types of carbon are used, the carbon gasification reaction kinetics could be different due to the different properties of carbon fuels. However, the proposed model can be easily applied to DC-SOFC with different types of carbon fuels by modifying the carbon oxidation reaction kinetics.
3.2 Effect of applied voltage
The voltage-current density-power density curves of DC-SOFCs using H2O as agent are shown
in Fig. 3. The detailed operating conditions are listed in Table 3.
As can be seen in Fig. 3, the cell with in situ catalytic steam-carbon gasification has a much better performance compared with the cell without catalyst. By adding catalyst, the peak power density of the cell increases from about 3000 W m-2 to 4600 W m-2, with the maximum current
density increasing from about 10000 A m-2 to 23000 A m-2. This significant performance
improvement is mainly caused by the faster steam-carbon gasification kinetics. As can be seen in Fig. 4(a) and Fig. 4(b), the peak steam-carbon gasification reaction rate increases from 11.1 mol m-3 s-1 to 292 mol m-3 s-1 with most parts in catalytic carbon layer being larger than 50 mol
m-3 s-1. Consequently, the mole fraction of the fuel (both H
2 and CO) in anode is significantly
14 in situ catalytic gasification.
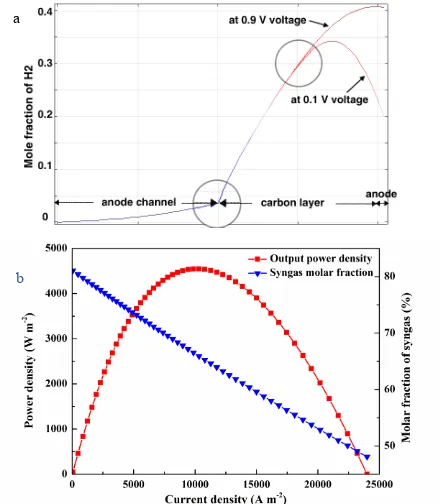
It should also be noted that the fuel concentration distribution in anode is significantly affected by both steam-carbon gasification reaction and applied voltage. As can be found in Fig.5(a), the H2 mole fraction obtains a sharp increase to 0.4 in carbon layer at 0.9 V applied voltage,
while it decreases quickly to 0.2 in the area close to anode at 0.1 V applied voltage. The relationship between electrochemical performance and syngas molar fraction on the anode surface is further shown in Fig. 5(b). The syngas molar fraction exceeds 80% at small operating current density but decreases to be less than 50% at a current density of 23000 A m-2. Thus, a
high operating potential is more favored to maintain a high fuel concentration in the anode outlet gas.
3.3 Effect of anode inlet gas flow rate
In DC-SOFCs using H2O as agent, steam is introduced to the anode inlet as it participates in
the carbon gasification reaction, however, the inlet steam can dilute fuel concentration on the other hand. Thus, it should be careful to choose a suitable steam flow rate in operation. For the study of anode inlet gas flow rate effect, the operating parameters are listed in Table 4.
15
fuel cell. Besides, a large steam flow rate is more favored under the fast in situ catalytic gasification reaction with its peak current density being obtained at 40 SCCM flow rate. In addition, the mole fraction of H2 and CO in anode is also significantly affected by inlet steam
flow rate as can be seen in Fig. 7(a). Apart from different electrochemical reaction kinetics, the reaction rate of WGSR is another key factor to the mole fraction change of H2 and CO (as
shown in Fig. 7(b)) since steam-carbon gasification produces equal amount of H2 and CO. At
small gas flow rates, more H2 than CO is consumed by electrochemical reaction due to the
faster reaction kinetics of H2, in the meanwhile, the lack of steam favors WGSR to convert H2
and CO2 into H2O and CO in anode (shown as negative value of WGSR in Fig. 7(b)). As a
result, more CO than H2 is left in anode. With an increase of steam flow rate, the WGSR rate
turns to positive and keeps growing, while the Boudouard reaction rate remains at a small value. Consequently, the mole fraction of CO keeps decreasing, while the mole fraction of H2 keeps
rising to exceed CO and remains at a relative high level. This phenomenon indicates that the outlet gas composition from anode can be adjusted by controlling the inlet gas flow rate.
3.5 Effect of operating temperature
The operating temperature affects not only the electrochemical kinetics but also the chemical reaction rate, thus, both the output power and the fuel percentage (H2 & CO) in outlet gas will
16
As can be seen in Fig. 8(a), the current density of DC-SOFC with H2O as agent is increased at
a higher temperature. The existence of catalyst improves the performance of DC-SOFC especially at a low operating temperature, where a large improvement can be found (4 times improvement at 923 K and 1.4 times improvement at 1173 K). Although the output electricity power improvement by adding catalyst is not that significant at high operating temperature, the fuel percentage in outlet gas is largely improved as shown in Fig. 8(b). Benefited from faster chemical reaction kinetics as a higher temperature, the fuel percentage in outlet gas increases from 0.15% at 923 K to 20% at 1173 K without catalyst, while a percentage of 85% of fuel in the outlet gas can be obtained with the help of catalyst at 1173 K. The high fuel concentration indicates an excellent potential for fuel (H2 & CO) and electricity cogeneration in DC-SOFC
with in situ catalytic steam-carbon gasification.
4 Conclusion
Both experimental testing and mathematical modeling are conducted to study the performance of DC-SOFCs with in situ catalytic gasification of carbon by H2O. The model is compared and
17
electrochemical reaction, which brings a significant improvement of output power density. A peak power density of about 4600 W m-2 is obtained with the help of catalyst compared with
that of 3000 W m-2 without catalyst. The high fuel percentage in anode outlet gas is also
obtained due to the faster gasification reaction with catalyst. It is found that the mole fraction of H2 and CO in the outlet gas is significantly affected by the inlet gas flow rate. The mole
fraction of CO is larger than H2 at small inlet gas flow rate (< 100 SCCM), while H2 exceeds
CO at high inlet gas flow rate (> 100 SCCM). Thus, it could be possible to adjust the fuel component by controlling the inlet gas flow rate. The operating temperature also significantly affect the fuel percentage in outlet gas, where a high fuel percentage (84% at 1173 K) can be obtained, indicating the possibility for fuel and electricity co-generation in DC-SOFC with H2O
as agent by integrating in situ catalytic steam-carbon gasification.
Acknowledgement
This research is supported by a grant (PolyU 152127/14E) from Research Grant Council, University Grants Committee, Hong Kong SAR, a grant from Environment and Conservation Fund (ECF 54/2015), Hong Kong SAR, and a grant from Research Institute for Sustainable Urban Development (RISUD) (1-ZVEA).
We gratefully acknowledge the financial support of the National Science Foundation of China (Grant No. 51406091).
Nomenclature
Abbreviation
18
SDC Samaria-doped ceria
SOFC Solid oxide fuel cell TPB Triple phase boundary WGSR Water gas shift reaction YSZ Yttrium stabilized zirconium
Roman
𝐵0 Permeability coefficient, m2
𝑐𝐶𝑂2 Mole concentration of carbon dioxide, mol·m-3
𝑐𝐻2𝑂 Mole concentration of water, mol·m-3 𝐷𝑖𝑒𝑓𝑓 Effective diffusivity of species 𝑖 , m
2·s-1
𝐷𝑖𝑘𝑒𝑓𝑓 Knudsen diffusion coefficient of 𝑖 , m
2·s-1
𝐷𝑖𝑚𝑒𝑓𝑓 Molecular diffusion coefficient of 𝑖, m
2·s-1
𝐸𝑎𝑐𝑡 Activation energy, J·mol-1
𝐸𝐶𝑂 Equilibrium potential for carbon monoxide oxidization, V
𝐸𝐶𝑂0 Standard equilibrium potential for carbon monoxide oxidization, V
𝐸𝑒𝑞 Equilibrium Nernst potential, V
𝐸𝐻2 Equilibrium potential for hydrogen oxidization, V
𝐸𝐻02 Standard equilibrium potential for hydrogen oxidization, V
𝐹 Faraday constant, 96485 C·mol-1
𝑖𝑜 Exchange current density, A·m-2
n Number of electrons transferred per electrochemical reaction 𝑁𝑖 Flux of mass transport, kg·m-3·s-1
𝑝 (partial) Pressure, Pa
𝑅 Gas constant, 8.314 J·mol-1·K-1
𝑅𝐶_𝐶𝑂2 Reaction rate of Boudouard reaction, mol·m-3·s-1
𝑅𝐶_𝐻2𝑂 Reaction rate of steam-carbon gasification, mol·m-3·s-1
𝑅𝑊𝐺𝑆𝑅 Reaction rate of water gas shift reaction, mol·m-3·s-1
T Temperature, K
u Velocity field, m3·s-1
V Volume fraction
𝑦𝑖 Mole fraction of component i
19 𝛼 Charge transfer coefficient
𝛽𝐻2 Electrochemical kinetics parameter for H2
𝜀 Porosity
𝜂𝑎𝑐𝑡 Activation polarization, V
𝜂𝑜ℎ𝑚𝑖𝑐 Ohmic polarization, V
𝜅 Permeability, m2
𝜇 Dynamic viscosity of fluid, Pa·s
𝜌 Fluid density, kg·m-3
σ Conductivity, S/m
𝛾 Pre-exponential factor, A m-2
τ Tortuosity
∅ Potential, V
Subscripts
an Anode
20
co Carbon monoxide
H2 Hydrogen
l Ionic phase
s Electronic phase
Superscripts
0 Parameter at equilibrium conditions
eff Effective
L Local
Reference
[1] Park S, Vohs JM, Gorte RJ. Direct oxidation of hydrocarbons in a solid-oxide fuel cell. Nature. 2000;404:265-7.
[2] Shao ZP, Haile SM. A high performance cathode for the next generation of solid oxide fuel cells, Nature. 2004; 431: 170-173.
[3] Ruiz-Morales JC, Canales Vazquez J, Savaniu CD, Marrero-Lopez D, Zhou W, Irvine JTS, Disruption of extended defects in solid oxide fuel cell anodes for methane oxidation. Nature. 2006; 439: 568-571.
[4] Wachsman ED, Lee KT, Lowering the temperature of solid oxide fuel cells. Science. 2011; 334(6058): 935-939.
[5] Ni M, Modeling of solid oxide fuel cells. Science Bulletin. 2016. 61(17): 1311-1312. [6] Cai WZ, Liu J, Yu FY, Zhou Q, Zhang YP, Wang XQ, Liu ML, Ni M. A high performance direct carbon solid oxide fuel cell fueled by Ca-loaded activated carbon. International Journal of Hydrogen Energy. 2017;42(33):21167-21176.
21
[8] Gür TM. Critical Review of Carbon Conversion in “Carbon Fuel Cells”. Chemical Reviews. 2013;113:6179-206.
[9] Jiang CR, Ma JJ, Corre G, Jain SL, Irvine JTS. Challenges in developing direct carbon fuel cells. Chemical Society Reviews. 2017; 46: 2889-2912.
[10] Wu Y, Su C, Zhang C, Ran R, Shao Z. A new carbon fuel cell with high power output by integrating with in situ catalytic reverse Boudouard reaction. Electrochemistry Communications. 2009;11:1265-8.
[11] Tang Y, Liu J. Effect of anode and Boudouard reaction catalysts on the performance of direct carbon solid oxide fuel cells. International Journal of Hydrogen Energy. 2010;35:11188-93.
[12] Li C, Shi Y, Cai N. Performance improvement of direct carbon fuel cell by introducing catalytic gasification process. Journal of Power Sources. 2010;195:4660-6.
[13] Cantero-Tubilla B, Xu C, Zondlo JW, Sabolsky K, Sabolsky EM. Investigation of anode configurations and fuel mixtures on the performance of direct carbon fuel cells (DCFCs). Journal of Power Sources. 2013;238:227-35.
[14] Jiao Y, Zhao J, An W, Zhang L, Sha Y, Yang G, et al. Structurally modified coal char as a fuel for solid oxide-based carbon fuel cells with improved performance. Journal of Power Sources. 2015;288:106-14.
[15] Ong KM, Ghoniem AF. Modeling of indirect carbon fuel cell systems with steam and dry gasification. Journal of Power Sources. 2016;313:51-64.
[16] Xu H, Chen B, Zhang H, Sun Q, Yang G, Ni M. Modeling of direct carbon solid oxide fuel cells with H2O and CO2 as gasification agents. International Journal of Hydrogen Energy. 2017;42:15641-51.
[17] Kopyscinski J, Lam J, Mims CA, Hill JM. K2CO3 catalyzed steam gasification of ash-free coal. Studying the effect of temperature on carbon conversion and gas production rate using a drop-down reactor. Fuel. 2014;128:210-9.
[18] Shi Y, Cai N, Li C, Bao C, Croiset E, Qian J, et al. Modeling of an anode-supported Ni– YSZ|Ni–ScSZ|ScSZ|LSM–ScSZ multiple layers SOFC cell: Part I. Experiments, model development and validation. Journal of Power Sources. 2007;172:235-45.
[19] Luo Y, Shi YX, Li WY, Ni M, Cai NS, Elementary reaction modeling and experimental characterization of solid oxide fuel-assisted steam electrolysis cells. International Journal of Hydrogen Energy. 2014. 39(20): 10359-10373.
[20] Eguchi K. Ceramic materials containing rare earth oxides for solid oxide fuel cell. J Alloy Compd. 1997;250:486-91.
[21] Fan B, Yan J, Yan X. The ionic conductivity, thermal expansion behavior, and chemical compatibility of La0.54Sr0.44Co0.2Fe0.8O3-δ as SOFC cathode material. Solid State Sciences. 2011;13:1835-9.
[22] Tai LW, Nasrallah MM, Anderson HU, Sparlin DM, Sehlin SR. Structure and electrical properties of La1 − xSrxCo1 − yFeyO3. Part 2. The system La1 − xSrxCo0.2Fe0.8O3. Solid State Ionics. 1995;76:273-83.
[23] Huang Z, Zhang J, Zhao Y, Zhang H, Yue G, Suda T, et al. Kinetic studies of char gasification by steam and CO2 in the presence of H2 and CO. Fuel Processing Technology. 2010;91:843-7.
[24] Ni M. Modeling of SOFC running on partially pre-reformed gas mixture. International Journal of Hydrogen Energy. 2012;37:1731-45.
[25] Xu H, Chen B, Liu J, Ni M. Modeling of direct carbon solid oxide fuel cell for CO and electricity cogeneration. Applied Energy. 2016;178:353-62.
22
(SOEC) for Syngas Production at Two Different Electrodes. Journal of The Electrochemical Society. 2016;163:F3029-F35.
[27] Xu H, Chen B, Irvine J, Ni M. Modeling of CH4-assisted SOEC for H2O/CO2 co-electrolysis. International Journal of Hydrogen Energy. 2016;41:21839-49.
[28] Chen B, Xu HR, NI M, Modelling of finger-like channelled anode support for SOFCs application, Science Bulletin. 2016; 61(17): 1324-1332.
[29] Suwanwarangkul R, Croiset E, Fowler MW, Douglas PL, Entchev E, Douglas MA. Performance comparison of Fick’s, dusty-gas and Stefan–Maxwell models to predict the concentration overpotential of a SOFC anode. Journal of Power Sources. 2003;122:9-18. [30] Ni M, An electrochemical model for syngas production by co-electrolysis of H2O and CO2.
Journal of Power Sources. 2012; 202: 209-216.
23 List of Tables
Table 1 Material properties
Table 2 Reaction parameters
Table 3 Operation parameters for operating potential effect study in DC-SOFCs
Table 4 Operation parameters for anode inlet gas flow rate effect study in DC-SOFCs
24
Table 1 Material properties [18-22]
Parameters Value or expression Unit
Ionic conductivity
YSZ 3.34 × 10⁴𝑒−10300𝑇 Sm-1
SDC 100
𝑇 × 10
5.48077−3792.53𝑇 Sm-1
LSCF 100
𝑇 × 10
2.51289−3036.75𝑇 Sm-1
Electronic conductivity
LSCF 100
𝑇 × 10
4.32576+1204.26𝑇 Sm-1
Ni 3.27 × 10⁶− 1065.3𝑇 Sm-1
Porosity
Cathode 0.2
Anode 0.6
Anode volume fraction
YSZ 0.4
Ni 0.6
𝐒𝐓𝐏𝐁
Cathode layer 2.14 × 10⁵ m2m-3
Anode layer 2.14 × 10⁵ m2m-3
Electrode tortuosity 3
25
Table 2 Reaction parameters
Parameter Value Unit
Chemical reaction without catalyst
𝐾1 1.03 × 10⁻³ s mol kg-1 m-2
𝐾2 9.88 × 10⁻⁴ Pa-1
𝐾3 8.13 × 10⁻⁵ Pa-1
𝐾4 3.11 × 10⁻⁵ s mol kg-1 m-2
𝐾5 1.25 × 10⁻³ Pa-1
𝐾6 3.82 × 10⁻⁵ Pa-1
Chemical reaction with catalyst
𝐾1 3.87 × 10⁻² s mol kg-1 m-2
𝐾2 9.88 × 10⁻⁴ Pa-1
𝐾3 8.13 × 10⁻⁵ Pa-1
𝐾4 1.17 × 10⁻³ s mol kg-1 m-2
𝐾5 1.25 × 10⁻³ Pa-1
𝐾6 3.82 × 10⁻⁵ Pa-1
Electrochemical reaction
𝛾𝐻2 3.68 × 10⁹ A m-2
𝐸𝑎𝑐𝑡,𝐻2 1.2 × 10⁵ J mol-1
26
𝐸𝑎𝑐𝑡,𝑂2 1.2 × 10⁵ J mol-1
𝛾𝐶𝑂 1.67 × 10⁹ A m-2
𝐸𝑎𝑐𝑡,𝐶𝑂 1.2 × 10⁵ J mol-1
𝛼𝐻2 0.5
𝛼𝐶𝑂 0.5
27
Table 3 Operation parameters for operating potential effect study in DC-SOFCs
Parameter Value Unit
Operating potential 0 – 1 V
Anode inlet gas flow rate 90 SCCM
Cathode inlet gas flow rate 10 SCCM
Anode gas composition H2O
Cathode gas composition Air
Temperature 1123 K
Table 4 Operation parameters for anode inlet gas flow rate effect study in DC-SOFCs
Parameter Value Unit
Operating potential 0.5 V
Anode inlet gas flow rate 1 -200 SCCM
Cathode inlet gas flow rate 10 SCCM
Anode gas composition H2O
Cathode gas composition Air
[image:27.595.64.529.419.653.2]28
Table 5 Operation parameters for temperature effect study in DC-SOFCs
Parameter Value Unit
Operating potential 0.5 V
Anode inlet gas flow rate 90 SCCM
Cathode inlet gas flow rate 10 SCCM
Anode gas composition H2O
Cathode gas composition Air
29 List of Figures
Fig.1. Schematic of DC-SOFC using H2O as gasification agent
Fig.2 Model validation for DC-SOFCs using H2O as agents without (a) and with (b) catalyst
Fig. 3 The voltage-current density-power density relationships of DC-SOFCs using H2O as
agents with and without catalyst
Fig. 4 The carbon gasification rate (mol m-3 s-1) without (a) with (b) catalyst in carbon layer
and mole fraction of fuel without (c) and with (d) catalyst in anode of DC-SOFCs at 0.8 V and 1123 K
Fig. 5 Distribution change of H2 mole fraction in anode with catalytic gasification at 0.9 V and
0.1 V operating potentials and 1123K.
Fig. 6 The effect of anode inlet gas flow rate on current density of DC-SOFCs with H2O as
agents at 0.5 V and 1123 K
Fig. 7 The effect of anode inlet gas flow rate on fuel mole fraction (a) and chemical reaction rates (b) in anode surface of DC-SOFCs at 0.5 V and 1123 K
30
31
Fig.2 Model validation for DC-SOFCs using H2O as agents without (a) and with (b) catalyst.
a
32
Fig. 3 The voltage-current density-power density relationships of DC-SOFCs using H2O as
33
Fig. 4 The carbon gasification rate (mol m-3 s-1) without (a) with (b) catalyst in carbon layer
and mole fraction of fuel without (c) and with (d) catalyst in anode of DC-SOFCs at 0.8 V and 1123 K
a
b
34
Fig. 5 (a)Distribution change of H2 mole fraction in anode with catalytic gasification at 0.9 V
and 0.1 V operating potentials and 1123K; (b) I-P characteristics and syngas molar fraction change at different operating current densities.
b
[image:34.595.81.521.111.615.2]35
Fig. 6 The effect of anode inlet gas flow rate on current density of DC-SOFCs with H2O as
36
Fig. 7 The effect of anode inlet gas flow rate on fuel mole fraction (a) and chemical reaction rates (b) in anode surface of DC-SOFCs at 0.5 V and 1123 K
a
37
Fig.8 The effect of operating temperature on current density (a) and fuel percentage in outlet gas (b) of DC-SOFCs with H2O as agents at 0.5 V operating potential
a
![Table 1 Material properties [18-22]](https://thumb-us.123doks.com/thumbv2/123dok_us/8710091.382910/24.595.89.508.85.715/table-material-properties.webp)