ISSN Online: 2153-1242 ISSN Print: 2153-1234
DOI: 10.4236/jis.2020.111001 Dec. 10, 2019 1 Journal of Information Security
Comparing the Area of Data Mining Algorithms
in Network Intrusion Detection
Yasamin Alagrash
1,2, Azhar Drebee
3,4, Nedda Zirjawi
51Computer Science and Informatics, Oakland University, Rochester, Michigan, USA
2SCR Office, Ministry of Higher Education & Scientific Research/SCR Office, Baghdad, Iraq 3Computer Engineering, Ankara Yildirim Beyazt University, Ankara, Turkey
4Computer Sciences, Al-Mustaniriyah University, Baghdad, Iraq
5Informatics-Applied Software Engineering, University of Hamburg, Hamburg, Germany
Abstract
The network-based intrusion detection has become common to evaluate ma-chine learning algorithms. Although the KDD Cup’99 Dataset has class im-balance over different intrusion classes, still it plays a significant role to eva-luate machine learning algorithms. In this work, we utilize the singular valued decomposition technique for feature dimension reduction. We further recon-struct the features form reduced features and the selected eigenvectors. The reconstruction loss is used to decide the intrusion class for a given network feature. The intrusion class having the smallest reconstruction loss is accepted as the intrusion class in the network for that sample. The proposed system yield 97.90% accuracy on KDD Cup’99 dataset for the stated task. We have also analyzed the system with individual intrusion categories separately. This analysis suggests having a system with the ensemble of multiple classifiers; therefore we also created a random forest classifier. The random forest clas-sifier performs significantly better than the SVD based system. The random forest classifier achieves 99.99% accuracy for intrusion detection on the same training and testing data set.
Keywords
Feature Reduction, Singular Value Decomposition, Intrusion Detection, Correlation Analysis, Association Impact Scale, Intrusion Detection System, KDD Cup 1999, Random Forest
1. Introduction
With the advance of the Internet and its potential, there has been a subsequent
How to cite this paper: Alagrash, Y., Dre-bee, A. and Zirjawi, N. (2020) Comparing the Area of Data Mining Algorithms in Network Intrusion Detection. Journal of Information Security, 11, 1-18.
https://doi.org/10.4236/jis.2020.111001 Received: July 25, 2019
Accepted: December 7, 2019 Published: December 10, 2019 Copyright © 2020 by author(s) and Scientific Research Publishing Inc. This work is licensed under the Creative Commons Attribution International License (CC BY 4.0).
DOI: 10.4236/jis.2020.111001 2 Journal of Information Security growth of information flow and services over networks. Consequently, the secu-rity issues have become a key concern of business organizations that rely on network-based 5 services. Therefore, there is an essential need for Intrusion De-tection Systems (IDS). That monitors and analyzes networks to automatically detect malicious and suspicious activities, vulnerabilities, and policy violations in the network.
An intrusion attempt or a threat can be defined as a deliberate and unautho-rized attempt to access or/and manipulate information or (ii) make a system unreliable or 10 unusable. Intrusion detection techniques used in IDSs are gen-erally classified into two categories: misuse detection and anomaly detection [1]. Misuse detection techniques are most widely used, and they are based on a da-tabase of previous and well-known attacks to identify any intrusion attempts. Although these techniques have very a small rate of false attacks, they must be continually updated and maintained and may fail to 15 detect unique intrusions. Anomaly detection techniques, on the other hand, are based on a set of rules of normal behavior to identify deviation of activities from this normal behavior. They have the ability to detect unknown, novel, or unfamiliar attacks that have not been encountered previously; however, false attack rate is high.
In recent years, the use of machine learning techniques such as support vector machine (SVM) [2], extreme learning machine (ELM) [3], Artificial Neural Networks (ANN) [4], Genetic Algorithms (GA), etc. to classify and detect at-tacks has become a common in intrusion detection system due to the fact that they can achieve intrusions generalizations. Due to the complexity and diversity of intrusions, machine learning based IDSs have the ability to process and ex-tract features from a large volume of data 25 related to online intrusions. Hence, they became a vital solution for developing an efficient and robust intrusion de-tection system.
Challenges and Motivations
This work is due to the demanded detection and analysis system over data and service flow produced by web service invocation over computing environment. The traditional analysis mechanisms do not offer significant results where mal-ware is everywhere and these services do share common geographical locations, reside on different internet segments.
The size of data in analysis phase is still challenge, so policy based analysis is a real demand to control and detect the intruder over virtual global network composed of web services.
Contribution
In this work, we have tested and analyzed the two classification methods based on Singular Value Decomposition (SVD) and Random Forest (RF). Besides this, we have evaluated the two methods with different performance measures.
DOI: 10.4236/jis.2020.111001 3 Journal of Information Security paper.
2. Background
2.1. Singular Value Decomposition Algorithm
The Singular Value Decomposition (SVD) technique has a long and surprising journey. SVD is first used in the social sciences with intelligence testing. The ini-tial research in intelligence testing found out that tests given to measure different aspects of intelligence, such as verbal and spatial, were often closely correlated. There are a lot of 150 names for which SVD is known. In the early days, it was called as principal component (PC) decomposition, factor analysis, and empiri-cal orthogonal function (EOF) analysis. All these names are mathematiempiri-cally equivalent to each other, but they are treated differently in the literature.
Today, singular value decomposition has spread through many branches of science, 155 in particular psychology and sociology, climate and atmospheric science, and astronomy. It is also extremely useful in machine learning and in both descriptive and predictive statistics. In many machine learning applica-tions, it is useful to find a lower rank matrix which can represent the data ma-trix. The singular value decomposition of a matrix X is the factorization of X in-to the product of three matrices as follows
T
X U D V= × × (1)
where the matrices U and V are real valued matrices. Besides this, the columns of Um160 and V are orthonormal. The matrix D is positive real valued and it is a diagonal matrix [5].
2.2. Random Forest Algorithm
There are a lot of supervised classification algorithms and the ensemble of those may yield better performance. With this intuition, Random forest algorithm creates the ensemble of several decision tree classifiers which is called as the for-est of the decision 165 of trees. The Random Forfor-est algorithm is proposed by Dr. Leo Breiman [6]. All the decision trees in the forest participate and the final re-sults are drowned by the majority vote. Therefore, a higher number of trees in the forest give the high accuracy results.
We have partitioned the training data samples into K subsets (K = 500 in our work) randomly. For each subset, we have constructed a decision tree. All the decision trees 170 are constructed by randomly selecting m variables (with ran-domly selected samples in the corresponding subset) and finding the best split on the selected variables. This technique is applied at each node of decision tree till a node becomes a leaf node. Each decision tree votes for a classification result and the final classification result is decided by the majority votes of the decision trees [7][8].
DOI: 10.4236/jis.2020.111001 4 Journal of Information Security and corresponding attribute samples vector then we can get the margin function by Equation (2)
(
)
(
( )
)
( )
(
)
; kI k J
kI k k
mg X Y av C X Y max
Yav Yav I C X j
= = −
= = (2)
where indicator function is symbolized with I. The margin function measures the 180 average number of votes the correct attack class exceeds by average number of votes for any other class at given vector X and Y. We will get more accuracy with the larger margin. The generalization error of the system is given as Equation (3).
(
)
(
)
, , 0
X Y
PE P= mg X Y ≤ (3)
where the PX,Y is the probability over the X, Y space.
3. Related Work
In Information security, the machine learning techniques have become more at-tractive to researchers because of their capabilities to process large volume of data and provide classifications without prior knowledge of data. Therefore, dif-ferent numbers of IDS have used these techniques to identify abnormal activities in the network. Extensive survey of various IDS are given in this study, we focus on IDS that are based on classification techniques. Examples of these IDS and their performance on KDD99Cup dataset are given in Table 1. Classification consists of two phases. First, during the training phase, a classifier is built (learned) using labeled training data. Then, this classifier is used to classify an instance as normal or anomalous (testing phase). Classification-based anomaly detection approaches are popular 45 for detecting network anomalies. The clas-sification techniques are based on establishing an explicit or implicit model that enables categorization of network traffic patterns into several classes.
Classifications based IDS can use number of classifiers such as Nave Bayesian, Support vector machine (SVM), Artificial Neural Networks (ANN), etc. Nave Bayesian is a most widely used classifier for network intrusion detection.
[image:4.595.198.539.624.745.2]Klassen and Ning [9] proposed a Nave Bayesian approach to detect black holes, selective forwarding and Distributed Denial of Service (DDoS) attacks, in real time. The system monitored packets sent from nodes; therefore, their beha-vior is checked in order to detect any abnormality. Tao et al. [10] also used a
Table 1. Different attack types and their categorization in KDD99 dataset [29].
Category Different Attack Type within its category
R2L ftp write, guess passwd, httptunnel, imap, multihop, named, phf, sendmail, snmpguess, spy, snmpget attack, xlock, xsnoop, ware z-client, worm, ware zmaster DoS apache2, back, cesstable, land, prosmurf, mailbomb, udpstorm, neptune, teardrop, pod Probe ipsweep, saint, mscan, port sweep, nmap, satan
DOI: 10.4236/jis.2020.111001 5 Journal of Information Security Nave Bayesian classifier in combination with a time slicing function to detect network abnormality. Thus, they exploited the relationship between time and network traffic, since network traffic changes at distinct times and some traffic does not occur at a particular time. The model proposed in [11] accurately de-tected suspicious payload content in network packets through the use of the multinomial one class Naive Bayes classifier for payload based anomaly detec-tion (OCPAD).
Also, SVM classifier is used to build IDS system. For instance, Wagner et al. [12] use one-class classifiers that can detect new anomalies data points that do not belong to the learned class. In particular, they use a one-class SVM classifier proposed by Scholkopf et al.[13]. In such a classifier, the training data is pre-sumed to belong to only one class, and the learning goal during training is to determine a function which 65 is positive when applied to points on the circum-scribed boundary around the training points and negative outside. They obtain 92% accuracy on average for all attacks classes. Catania et al. [14] proposed a novel approach to providing autonomous labeling to normal traffic, in order to overcome imbalanced class distribution situations and reduce the presence of attacks in the traffic data used for training an SVM classifier. Amer et al.[15] applied two modifications in order to make one-class SVMs more suitable for unsupervised anomaly detection: Robust one-class SVMs and eta one-class SVMs. Their aim was to make the decision boundary less sensitive to outliers in the data.
Additionally, Wang et al. [16] developed an effective IDS based on an SVM with 75 augmented features. These IDS model integrates the SVM with the loga-rithm marginal density ratios transformation (LMDRT), a feature transduction technique that transforms the dataset into a new one. The new and concise da-taset is used to train the SVM classifier, improving its detection. By evaluating the framework using the mostly used NSL-KDD dataset, the authors could achieve a fast training speed, high accuracy and 80 detection rates, as well as low false alarm presences. Kabir et al.[17] proposed an IDS based on a modification of the standard SVM classifier, known as the least square support vector ma-chine (LS-SVM). This alteration is sensitive to outliers and noise in the training dataset when compared to a regular SVM. Their decision-making process is di-vided into two stages. The first stage is 85 responsible for reducing the dataset dimension by selecting samples depending on the variability of data by using an optimum allocation scheme. Then, the next stage uses these representative sam-ples as the input of the LS-SVM. An example of classification-based IDS is Au-tomated Data Analysis and Mining (ADAM) [18] that provides a test bed for detecting anomalous instances. ADAM exploits a combination of classification techniques and association rule mining to discover attacks in a tcpdump audit trail. Abbes et al. [19] introduce an approach that uses decision trees with pro-tocol analysis for effective intrusion detection.
DOI: 10.4236/jis.2020.111001 6 Journal of Information Security For example, Muda et al. [20] present a two stage model for network intrusion detection. In the first stage, k-means clustering is used to generate three clusters: C1 for attack data such as Probe, U2R and R2L; C2 for DoS attack data, and C3 for non-attack data. In the second stage, the Naive Bayes classifier to classify the data into the five more classes called Normal, DoS, Probe, R2L and U2R. Anoth-er approach based on the combination of k-mean for clustAnoth-ering and ItAnoth-erative Dichotomiser (ID3) algorithm for decision tree classifier is proposed in [21]. In this approach, the training data is grouped into k clusters using Euclidean dis-tance similarity. A decision tree is then built using ID3 algorithm on the in-stances in a cluster to overcome the shortcomings of k-mean algorithm. The au-thors claim that the detection accuracy of the k-means + ID3 method 105 is very high with low false positive rate on network anomaly data.
Artificial Neural Networks (ANNs) are also used in the anomaly detection system mostly as classifiers. An example of ANN-based IDS is RT-UNNID [22]. This system is capable of intelligent real time intrusion detection using unsuper-vised neural networks (UNN). Subba et al.[23] employed an ANN model in or-der to introduce an intelligent agent for classifying whether the unor-derlying pat-terns of audit records are normal or abnormal while classifying them into new and unseen records. Saeed et al. [24] proposed a two-level anomaly-based IDS using a Random Neural Network (RNN) model in an IoT environment. The RNN model was employed in order to build a behavior profile based on both va-lid and invava-lid system input parameters to distinguish 115 normal and abnormal patterns. Brown et al.[25] proposed a two-class classifier using an evolutionary general regression neural network (E-GRNN) for intrusion detection based on the features of application layer protocols.
4. Proposed System
In this work we have utilized two machine learning approaches for the task of network intrusion detection. These approaches are Singular Value Decomposi-tion (SVD) and Randome Forest. The dataset used in this work to evaluate these approaches is KDDCUP’99 dataset for network intrusion detection. We have al-so compared these approaches in different evaluation metrics. The detail of comparison is given in Section 4. In this section we are explaining the two ap-proaches used in the work.
Pre-Processing of the Data
As the KDDCUP’99 dataset has continuous and categorical both type of attributes we need to change all categorical attributes into real values vectors. The detail of KDDCUP’99 dataset is given in subsection 4.1. Some operations are performed on the KDDCUP’99 dataset to prepare it for the machine learning algorithms.
cate-DOI: 10.4236/jis.2020.111001 7 Journal of Information Security gories available for the attribute. Every unique category has assigned an id. The position of one in one-hot encoded vector is given by this id. The corresponding vector for a category has one at position id of the category if unique categories are “A”, “B”, “C”, “D”, “E” then the one-hot vector for category “B” is 01000 where is it is 00010 for the category “D”.
2) Update Incomplete data samples: There are some attributes for which their corresponding value is not available for some sample in the dataset. We have updated 140 these values by its mean within the corresponding label class.
3) Normalized the data: The different features/attributes of the dataset have different unit and scale. The two attribute with different unit or scale cannot be compared, so we normalized the dataset. We are normalized the dataset as z score [22].
5. Comparative Study
5.1. Experimental Datasets
The KDDCUP’99 dataset is the processed version of DARPA dataset created in 1998. This dataset is distributed under a competition (KDDCUP competition in 1999). This competition was sponsored by the International Conference on Knowledge Discovery in Databases. This competition was required the content to create a predictive model that can learn to predict the class label of a comput-er network connection [9]. The class labels for any computer network connec-tion are legitimate and illegitimate connecconnec-tion. This dataset has a large number sample data for network connections. These sample have both normal connec-tions and attack connecconnec-tions. The whole dataset is divided into two mutual ex-clusive parts name train set and test set. The train set has approximately five mil-lion records of computer network connections whereas the test set has about 0.3 million records of computer network connections.
A computer network connection is a session of data transfer in-between a pair of computer. This session is time-stamped and has 41 other attributes. Out of these 41 attributes (features), 32 attributes are continuous type and rest 7 are ca-tegorical type. Beside these attributes the connections are also labeled as normal connection or as an attack type (different attack types are mentioned in Table 1) connection. These attributes can be further broken categorize into four catego-ries as Basic features, Traffic features, Host based traffic features, and Connec-tion-based content features [26][27][28].
Basic features/attributes (refer Table 2): the basic features/attributes are
common to all network connections. These features/attributes could be used in detection of intrusion/attacks targeting service and protocol vulnerabili-ties.
DOI: 10.4236/jis.2020.111001 8 Journal of Information Security Table 2. Basic attributes features in KDDCUP’99 dataset [30].
Attribute/Feature Name Type of attribute Description of Basic attribute duration continuous Time duration of the network connection in seconds protocol type nominal protocol type (e.g. udp, tcp, etc.)
service nominal destination system (e.g. http, ftp, telnet, etc.) network connection service on the src bytes continuous from source system to destination system the number of data bytes transferring dst bytes continuous the number of data bytes transfering from destination system to source system
flag nominal the status of the network connection (e.g. normal or error) land binary 1 if network connection is from/to the same host-port; 0 otherwise wrong fragment continuous number of the wrong fragments
urgent continuous total number of the urgent packets
Table 3. Traffic attributes features in KDDCUP’99 dataset using two-second time win-dows [30].
Attribute/Feature Name Type of attribute Description of Traffic attribute count continuous number of connections in the past two seconds to the same
host as the current connection serror rate continuous percent of connections for same host that have SYN errors rerror rate continuous percent of connections for same hostmthat have REJ errors same srv rate continuous percent of connections for same host to different services
srv count continuous number of connections in the past two seconds to the same service as the current connection srv serror rate continuous percent of connections for same service that have SYN errors srv rerror rate continuous percent of connections for same service that have REJ errors srv diff host rate continuous percent of connections for same service to different hosts
Host based traffic attributes/features (refer in Table 4): the host based traffic category capture the features/attributes as the number of network connec-tions to the same port, host, or service in the past 100 network connecconnec-tions by a destination host.
[image:8.595.206.540.337.580.2]DOI: 10.4236/jis.2020.111001 9 Journal of Information Security Table 4. Host based traffic attributes features in KDDCUP’99 dataset using windows of 100 connections [31].
Attribute/Feature Name Type of attribute Description of Host based traffic attribute dst host count continuous number of connections to the same host In the past 100 connections the
dst host serror rate continuous percent of connections that have SYN errors
dst host rerror rate continuous percent of connections that have REJ errors
dst host same srv rate continuous percent of connections to the same service
dst host dif srv rate continuous connections to different services percent of same host
dst host srv count continuous number of connections to the same service In the past 100 connections the
dst host srv serror rate continuous connections that have SYN errors percent of same service
dst host srv rerror rate continuous connections that have REJ errors percent of same service
dst host srv diff host rate continuous connections to different hosts percent of same service
dst host same src port rate continuous from the same source port percent of connections
Table 5. Connection-based content attributes features in KDDCUP’99 dataset based on domain knowledge [30].
Attribute/Feature Name Type of attribute Description of Connection-based content attribute
hot continuous hot indicators e.g., creation, and execution of programs, access to system directories, etc num failed logins continuous login attempts failed count
logged in binary if logged in successfully then 1; otherwise 0
num compromised continuous
number of compromised/warning states on the destination host
(e.g., Jump to instructions, and file/path not found errors, etc.) root shell binary if root shell is acquired then 1;
otherwise 0
su attempted binary if su root command tried then 1; otherwise 0
num root continuous total root accesses num file creations continuous number of file operations(creation)
[image:9.595.208.536.448.735.2]DOI: 10.4236/jis.2020.111001 10 Journal of Information Security Continued
num access files continuous On access control files, number of operations
num outbound cmds continuous In an ftp session, number of out-bound commands
is host login binary if login belongs to the host then 1; otherwise 0
is guest login binary if login is a guest then 1; otherwise 0
5.2. Evaluation Criteria
We need to compare the performance of two machine learning approaches therefore, we require an evaluation measures which is sensitive as well as robust to the available dataset. It is very uncertain to have these properties in a single measure, so we are testifying the performance of the system on several measures.
For a class X there are four type of observation depending upon the pre-diction and ground truth. These four observations are listed in Table 3.
There are some performance measures based on these observations. We are utilizing some of them which are listed below
Accuracy: This measure calculates the classifier performance as how many time it predict a class correctly with respect to the class itself. It can also refer to the closeness of a predicted value to a known or true value. This measure is calculated by Equation (4) [31].
accuracy= +tp tn N (4)
where N is the total number of test samples. Precision: This measure calculates the classifier performance as how many times, its prediction as a class is correct. It can also refer to the closeness of multiple measurements with each other. This measure is calculated by Equation (5).
Precision=tp tp fp+ (5)
Recall: This measure calculates the classifier performance as how many times its prediction of a class retrieve the class correctly. In other word we can say that the recall is the per class accuracy of the system. This measure is calculated by Equation (6).
Recall=tp tp fn+ (6)
F-measure [32]: Generally Precision and Recall for a classifier are not follow-ing each other. If Precision is improvfollow-ing after some consideration the recall de-clined and vice-versa. A sound classifier need the both measurement (Precision and Recall) as high therefore a new measurement is required that incorporate both of them. This measure is the F-measure which included the Precision and Recall measure in it. This measure is calculated by Equation (7).
( )
(
2) (
2)
2F-measure β = +1 β tp 1+β tp+β fp fn+ (7)
DOI: 10.4236/jis.2020.111001 11 Journal of Information Security
Area Under Curve (AUC): As Precision and Recall for a classifier are not following each other, and we need to encorporate them both for performance measurement, we can consider the area under the curve of Receiver operat-ing characteristic [33].
As the task is multi-class problem, averaging the evaluation measures over all intrusion classes can give a view on the general results. We are using the mi-cro-averaging and mami-cro-averaging approaches for this task.
Macro-averaged measure
The macro-averaged results for a multi-class problem can be computed by Equation (8).
(
)
1
Amicro 1q N A tp fp tn fn, , ,
λ λ λ λ
λ =
=
∑
(8)Here A = {Cλ: λ = 1:q}is the set of all attack classes. Let a binary classifier Cl and corresponding evaluation measure AC(tp, tn, fp, fn). These measures are calculated based on respective true positive numbers (tp), true negative numbers (tn) (Table 6).
False negative numbers (fn), and false positive numbers (fp). Let these num-bers are tpλ, tnλ, fnλ, and tnλand used to evaluate the measure A for the class Cl Finally, we calculate the mean of this measure over all attack classes (refer Equa-tion (8)).
Micro-averaged measure
Similarly, a micro averaged measure can be computed as Equation (9).
(
1 1 1 1)
Amicro=A
∑
qtpλ,∑
qfpλ,∑
qtnλ,∑
qfnλ (9)6. Results and Analysis
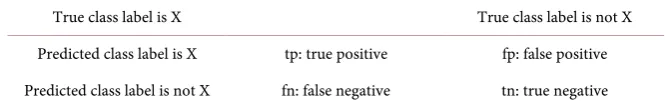
In this section, we are showing the result of Singular Valued Decomposition (SVD) based model and Random Forest (RF) based system. Figure 1 and Figure 2 show the normalized confusion matrix for the model based on SVD and RF model respectively. These confusion matrices show that the system is capable enough to classify the most of the attack types correctly. There are still some at-tack type for which the performance of the system is not satisfactory. The main reason of this behavior of the system is class imbalance in training sample set. In the KDDCup’99 dataset, there are some attack classes for which number of sam-ples are very low and for some classes it is very high. The ratio of maximum number of samples with respect to minimum.
[image:11.595.206.539.669.723.2]Number of samples for an attack type in the dataset is very high. Beside these class imbalance problem the Random Forest method outperform the SVD model
Table 6. Different observation of prediction for a class X.
DOI: 10.4236/jis.2020.111001 12 Journal of Information Security Figure 1. ROC curve for SVD model.
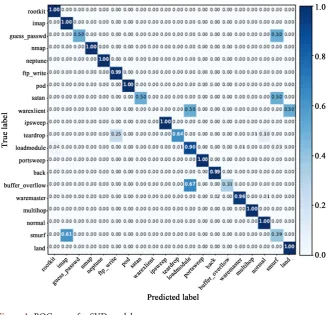
DOI: 10.4236/jis.2020.111001 13 Journal of Information Security in all aspect of confusion matrix. We have also analysis the performance of the system on Receiver operating characteristic (ROC) curve and the area under the curve (AUC) measure. The Random Forest method clearly surpassed the SVD (refer Figure 3).
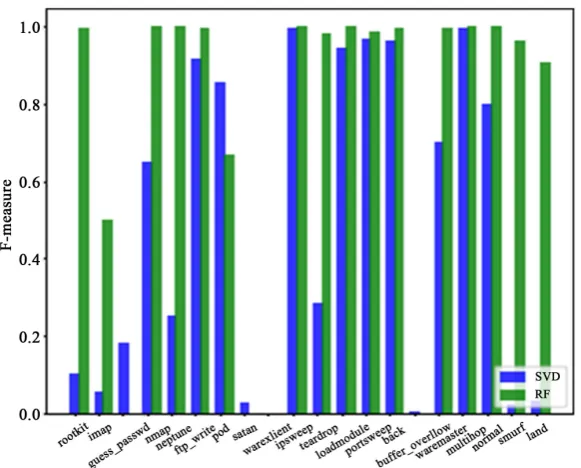
[image:13.595.77.520.277.693.2]Here we have compared the Receiver operating characteristic of the respective methods with micro averaged and macro averaged performance measures. These ROC curves and the AUC measures exemplify the superiority of the Random Forest method over the SVD based method. The area under curve (AUC) meas-ure for the Random Forest method is nearly perfect score (AUC = 1.0). The per-formance of the system with respect to individual attack type is depicted as bar charts in Figures 4-6. The attack type “ware client” and “neptune” are the worst behaving attack classes. The performance of the system for these attack classes is nearly zero with both methods.
DOI: 10.4236/jis.2020.111001 14 Journal of Information Security
Figure 4 shows the Precision performance analysis at all attack type for SVD
and Random Forest models. Figure 5 and Figure 6 show the Recall performance analysis and F-measure performance analysis at all attack type for SVD and Random Forest models. These barcharts also describe the better performance of the Random Forest methods over the SVD method. Finally we are showing the overall performance of the system.
Figure 4. Precision performance analysis at all attack type for SVD and random forest model.
DOI: 10.4236/jis.2020.111001 15 Journal of Information Security Here we are depicting the accuracy and F-measure of the Random Forest and SVD methods (refer Figure 7). The random forest method outperforms the SVD based system in all performance measures and shows the promising behavior for the intrusion detection in network connection environment.
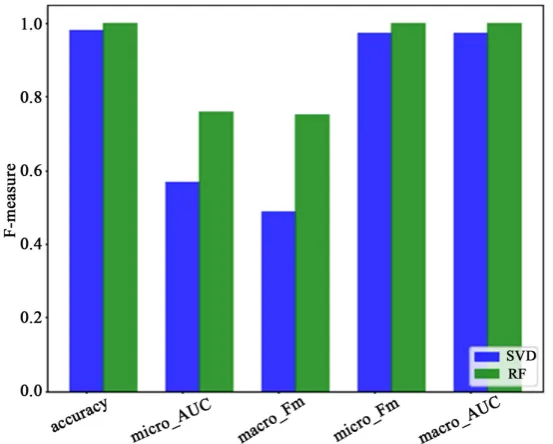
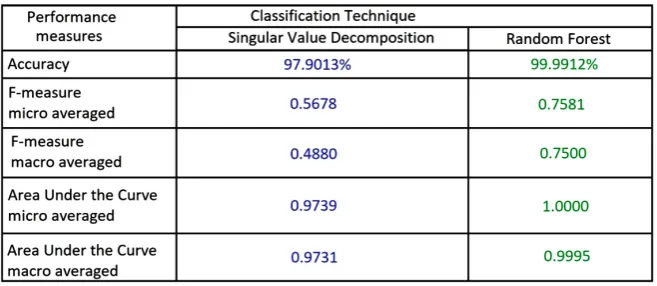
Figure 8 shows different performance in classification method of SVD and RF
[image:15.595.236.513.485.707.2]algorithms, the results indicate the promising behavior of RF algorithm.
Figure 6. F-measure performance analysis at all attack type for SVD and random forest model.
DOI: 10.4236/jis.2020.111001 16 Journal of Information Security Figure 8. Different performance measures for SVD and RF classification method over KDDCup’ 99 dataset.
7. Conclusion and Future Scope
In this work, we have tested and analyzed the two classification methods based on Singular Value Decomposition (SVD) and Random Forest (RF). The SVD based method utilizes the dimension reduction technique within each attack class. The decision is taken based upon the reconstruction error in each class. The class having the lowest reconstruction error is decided as the true attack class for the given sample. Besides this, the RF-based method utilizes the ensem-bles of decision trees to decide the true attack class. The results show that the RF-based method outperformed the SVD based method in all performance measures. The results show that the performance in both methods regarding the classes having few samples in the training set is suffering the class imbalance problem. A further study is required to handle this problem.
Conflicts of Interest
The authors declare no conflicts of interest regarding the publication of this pa-per.
References
[1] Bhuyan, M.H., Bhattacharyya, D.K. and Kalita, J.K. Network Anomaly Detection. [2] Feng, W., Zhang, Q., Hu, G. and Huang, J.X. (2014) Mining Network Data for
In-trusion Detection through Combining SVMs with Ant Colony Networks. Future Generation Computer Systems, 37, 127-140.
[3] Singh, R., Kumar, H. and Singla, R. (year) An Intrusion Detection System Using Network Traffic Profiling and Online Sequential Extreme Learning Machine. Ex-pert Systems with Applications, 42, 8609-8624.
[4] Wu, S.X. and Banzhaf, W. (2010) The Use of Computational Intelligence in Intru-sion Detection Intrusion Detection Systems: A Review. Applied Soft Computing, 10, 1-35. https://doi.org/10.1016/j.asoc.2009.06.019
[5] DeLong, E.R., DeLong, D.M. and Clarke-Pearson, D.L. (1988) Comparing the Areas under Two or More Correlated Receiver Operating Characteristic Curves: A Non-parametric. Biometrics, 44, 837-845.https://doi.org/10.2307/2531595
DOI: 10.4236/jis.2020.111001 17 Journal of Information Security [7] Nadeem, M., Marshall, O., Singh, S., Fang, X. and Yuan, X. (2016) Semi-Supervised Deep Neural Network for Network Intrusion Detection. KSU Proceedings on Cy-bersecurity Education, Research and Practice. 2.
[8] Shi, N., Yuan, X. and Nick, W. (2017) Semi-Supervised Random Forest for Intru-sion Detection Network. 2017The 28th Modern Artificial Intelligence and Cogni-tive Science Conference, Fort Wayne, IN, 28-29 April 2017, 181-185.
[9] Klassen, M. and Yang, N. (2012) IEEE Fifth International Conference on Advanced Computational Intelligence.
[10] Liu, T., Qi, A., Hou, Y. and Chang, X. (2008) Method for Network Anomaly Detec-tion Based on Bayesian Statistical Model with Time Slicing. 2008 7th World Con-gress on Intelligent Control and Automation, Chongqing, 25-27 June 2008, 3359-3362. https://doi.org/10.1109/WCICA.2008.4593458
[11] Swarnkar, M. and Hubballi, N. (2016) OCPAD: One Class Naive Bayes Classifier for Payload Based Anomaly Detection.Expert Systems with Applications, 64, 330-339.
https://doi.org/10.1016/j.eswa.2016.07.036
[12] Wagner, C., Francois, J., State, R. and Engel, T. (2011) Machine Learning Approach for IP-Flow Record Anomaly Detection. 10th IFIP Networking Conference (NETWORKING), Valencia, Spain, May 2011, 28-39.
[13] Scholkopf, B.S., Platt, J.C. and Shawe-Taylor, J.C. (2001) Estimating the Support of a High-Dimensional Distribution. NeuralComputation, 13, 1443-1471.
[14] Catania, C.A., Bromberg, F. and Garino, C.G. (2011) An Autonomous Labeling Approach to 345 Support Vector Machines Algorithms for Network Traffic Ano-maly Detection. Expert Systems with Applications, 39, 1822-1829.
https://doi.org/10.1016/j.eswa.2011.08.068
[15] Amer, M., Goldstein, M. and Abdennadher, S. (2013) Enhancing One-Class Support Vector Machines for Unsupervised Anomaly Detection. Proceedings of the ACM SIGKDD Workshop on Outlier Detection and Description on Outlier Detection and Description, Chicago, IL, 11 August 2013, 8-15.
https://doi.org/10.1145/2500853.2500857
[16] Wang, H., Gu, J. and Wang, S. (2017) An Effective Intrusion Detection Framework Based on SVM with Feature Augmentation. Knowledge-Based Systems, 136, 130-139. https://doi.org/10.1016/j.knosys.2017.09.014
[17] Kabir, E., Hu, J., Wang, H. and Zhuo, G. (2018) A Novel Statistical Technique for Intrusion Detection Systems. Future Generation Computer Systems, 79, 303-318. https://doi.org/10.1016/j.future.2017.01.029
[18] Barbard, D., Couto, J., Jajodia, S. and Wu, N. (2001) A Testbed for Exploring the Use of Data Mining in Intrusion Detection. SIGMODRecord, 30, 15-24.
[19] Abbes, T., Bouhoula, A. and Rusinowitch, M. (2010) Efficient Decision Tree for Protocol Analysis in Intrusion Detection. International Journal of Security and Networks, 5, 220-235. https://doi.org/10.1504/IJSN.2010.037661
[20] Muda, Z., Yassin, W., Sulaiman, M. and Udzir, N.I. (2011) A k-Means and Naive Bayes Learning Approach for Better Intrusion Detection. InformationTechnology Journal, 10, 648-655.https://doi.org/10.3923/itj.2011.648.655
[21] Quinlan, J.R. (1986) Induction of Decision Trees. Machine Learning.
[22] Amini, M., Jalili, R. and Shahriari, H.R. (2006)RT-UNNID: A Practical Solution to Real-Time Network-Based Intrusion Detection Using Unsupervised Neural Net-works. Computers & Security, 25, 459-468.
DOI: 10.4236/jis.2020.111001 18 Journal of Information Security [23] Subba, B., Biswas, S. and Karmakar, S. (2016) A Neural Network Based System for Intrusion Detection and Attack Classification. 2016 Twenty Second National Con-ference on Communication (NCC), Guwahati, India, 4-6 March 2016, 1-6.
https://doi.org/10.1109/NCC.2016.7561088
[24] Saeed, A., Ahmadinia, A., Javed, A. and Larijani, H. (2016) Intelligent Intrusion Detection in Low-Power IoTs. ACM Transactions on Internet Technology, 16, Ar-ticle No. 27. https://doi.org/10.1145/2990499
[25] Brown, J., Anwar, M. and Dozier, G. (2016) An Evolutionary General Regression Neural Network. 25th International Conference on Computer Communication and Networks, Waikoloa, HI, 1-4 August 2016, 1-5.
https://doi.org/10.1109/ICCCN.2016.7568493
[26] Stolfo, S.J., Fan, W., Lee, W., Prodromidis, A. and Chan, P.K. (2000) Cost-Based Modeling for Fraud and Intrusion Detection: Results from the Jam Project. Tech Report, Columbia University, New York.
[27] Shafi, K. (2008) An Online and Adaptive Signature-Based Approach for Intrusion Detection.
[28] Stewart, I. (2009) A Modified Genetic Algorithm and Switch-Based Neural Net-Work Model.
[29] Sheikhan, M., Jadidi, Z. and Farrokhi, A. (2012) Intrusion Detection Using Re-duced-Size RNN Based on Feature Grouping.Neural Computing and Applications, 21, 1-6. https://doi.org/10.1007/s00521-010-0487-0
[30] Protić, D.D. (2018) Review of KDD Cup’99, NSL-KDD i Kyoto 2006+ Baza Podata-ka. Vojnotehnički glasnik, 663, 580-596. https://doi.org/10.5937/vojtehg66-16670 [31] Kemal, O. (2015) A New Classification Scheme of Plastic Wastes Based upon
Recy-cling Labels. WasteManagement, 35, 29-35.
https://doi.org/10.1016/j.wasman.2014.09.030
[32] Rijsbergen, C.J.V. and Croft, W.B. (1975) Document Clustering: An Evaluation of Some Experiments with the Cranfield 1400 Collection. Information Processing & Management,11, 171-182.
![Table 1. Different attack types and their categorization in KDD99 dataset [29]](https://thumb-us.123doks.com/thumbv2/123dok_us/8740531.388136/4.595.198.539.624.745/table-different-attack-types-categorization-kdd-dataset.webp)
![Table 3. Traffic attributes features in KDDCUP’99 dataset using two-second time win-dows [30]](https://thumb-us.123doks.com/thumbv2/123dok_us/8740531.388136/8.595.208.539.90.295/table-traffic-attributes-features-kddcup-dataset-using-second.webp)
![Table 4. Host based traffic attributes features in KDDCUP’99 dataset using windows of 100 connections [31]](https://thumb-us.123doks.com/thumbv2/123dok_us/8740531.388136/9.595.208.536.448.735/table-traffic-attributes-features-kddcup-dataset-windows-connections.webp)