Water in the Earth's mantle: a solid-state NMR study of
hydrous wadsleyite
†
John M. Griffin,aAndrew J. Berry,bcDaniel J. Frost,dStephen Wimperis*e and Sharon E. Ashbrook*a
Wadsleyite,b-(Mg,Fe)2SiO4, is the main component of the transition zone in the Earth's mantle, at depths
of 410–530 km below the surface. This mineral has received considerable interest as a potential reservoir for the vast amount of hydrogen, as hydroxyl, referred to as water, that is thought to be contained within the mantle. However, the exact way in which water is incorporated into the structure of wadsleyite is not fully understood and has been the subject of considerable debate. In this work,17O,25Mg,29Si,1H and2H
solid-state NMR spectra were obtained from isotopically enriched samples of anhydrous and hydrous b-Mg2SiO4. First-principles DFT calculations were also carried out for a range of model structures to aid
interpretation of the experimental data. The results are consistent with a model for hydrous wadsleyite whereby hydrogen bonds to the O1 site to form hydroxyl groups that are charge balanced by cation vacancies on the Mg3 site. Structural models containing cation vacancies on the Mg2 site are found to be energetically less favourable and calculated NMR parameters show poor agreement with the experimental data. Disorder was also observed in the hydrous wadsleyite samples, and1H and2H NMR are consistent with not only Mg–O1–H but also more strongly hydrogen-bonded Si–O–H environments. These silanol protons can be incorporated into the structure with only a small increase in energy. Two-dimensional1H–29Si and1H–17O NMR correlation experiments confirm that the additional resonances do not correspond to Mg–OH protons and enable the identification of29Si and17O species within the Si–OH groups. This assignment is also confirmed byfirst-principles DFT calculations of NMR parameters. Silanol protons within Mg3 vacancies could account for up to 20% of the protons in the structure.
Introduction
The Earth's mantle to a depth of 660 km is primarily composed of iron-bearing magnesium silicates, which undergo a number of phase transitions with increasing depth owing to changes in temperature and pressure. At a depth of 410 km, the main constituent of the upper mantle, olivine (a-(Mg,Fe)2SiO4),
transforms to wadsleyite, (b-(Mg,Fe)2SiO4).1 Wadsleyite is the
main component of the so-called transition zone between the
upper and lower mantle, until a depth of530 km where it transforms to ringwoodite (g-(Mg,Fe)2SiO4). Although making
up a relatively small proportion of the Earth's mantle, wad-sleyite has received intense interest as a potential host for hydrogen, as hydroxyls, commonly termed water, in the inner-Earth.1–4 Whilst nominally anhydrous, this mineral can
accommodate up to 3.3 wt% water.2,5,6Over the volume of the
Earth's transition zone, this represents a potentially vast amount of water (if fully hydrated, the amount of hydrogen stored would be approximately four times the amount present in the oceans and atmosphere)3 with signicant implications
for mantle properties such as conduction,7phase relations8and
elastic properties.9
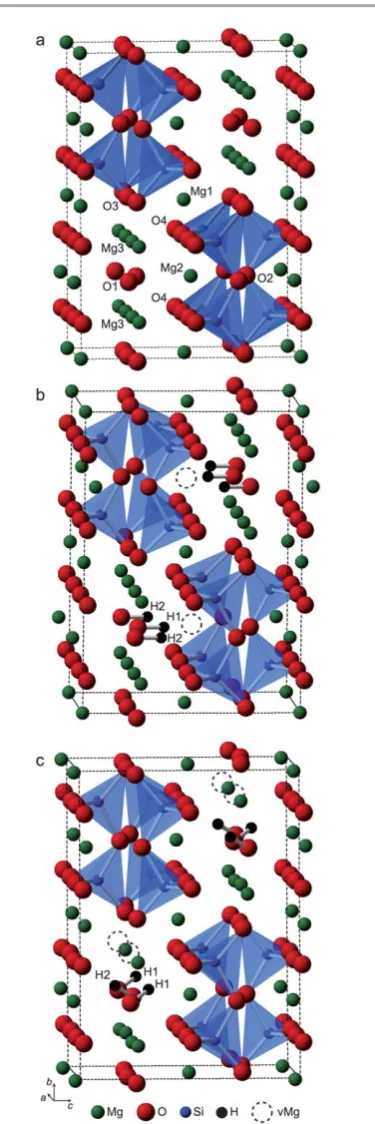
The structure of Fe-free wadsleyite (b-Mg2SiO4), shown in
Fig. 1a, has orthorhombic symmetry with the space group Imma.10The structure is made up of Si
2O7(pyrosilicate) groups
comprising a single crystallographic Si site, a bridging oxygen, O2, and two crystallographically distinct non-bridging silicate oxygens, O3 and O4. The structure also contains an oxygen site, O1, which is not bonded to silicon but instead is coordinated tove Mg2+ cations. This environment has a low apparent Pauling bond-strength sum, making it‘underbonded’ relative to conventional divalent oxygen species. Each of the
aSchool of Chemistry and EaStCHEM, University of St Andrews, North Haugh, St
Andrews KY16 9ST, UK. E-mail: [email protected]
bDepartment of Earth Science and Engineering, Imperial College London, South
Kensington SW7 2AZ, UK
cDepartment of Earth Sciences, Natural History Museum, Cromwell Road, London SW7
5BD, UK
d
Bayerisches Geoinstitut, Universit¨at Bayreuth, Bayreuth 95440, Germany
eSchool of Chemistry and WestCHEM, University of Glasgow, Glasgow G12 8QQ, UK.
E-mail: [email protected]
†Electronic supplementary information (ESI) available: FTIR spectra of hydrous wadsleyite, a comparison of17O MQMAS and STMAS NMR spectra, structural
models used for DFT calculations, calculated17O and25Mg NMR parameters
(and total energies) for structural models,1H MAS and variable-temperature2H
MAS of wads-D, 29Si and 1H solid-state NMR of phase B. See DOI:
10.1039/c3sc21892a
Cite this:Chem. Sci., 2013,4, 1523
Received 3rd November 2012 Accepted 11th January 2013
DOI: 10.1039/c3sc21892a
www.rsc.org/chemicalscience
EDGE ARTICLE
Open Access Article. Published on 14 January 2013. Downloaded on 30/07/2013 10:04:01.
three crystallographically distinct Mg species is approximately octahedrally coordinated to six surrounding oxygens. Local coordination environments for each species are shown in ESI.†
Despite its importance as a potential water reservoir in the mantle, the exact way in which hydrogen is substituted into the
wadsleyite structure is not fully understood. Hydrogen can be incorporated into anhydrous silicates through the formation of OHgroups, which are charge balanced by cation vacancies or coupled substitutions.11,12For hydrous wadsleyite, the
incorpo-ration of hydrogen atoms is balanced by the removal of magnesium, with the maximum effective H2O content of 3.3
wt% corresponding to the removal of two magnesium cations per unit cell. In principle, cation vacancies can be located at any of the Mg1, Mg2 or Mg3 sites. Immediately surrounding each of these vacancies, there are eight oxygen atoms to which the incorporated hydrogen can bond. This means that there are several possible locations for hydrogen close to each vacancy and a number of different possibilities for the ordering of vacancies in the structure.
Several theoretical studies have identied the O1 site as being particularly susceptible to protonation due to its under-bonded state.2,3,13–17 Using simple ionic constraints and
consideration of electrostatic potentials for the different oxygen sites, Smyth proposed a hypothetical ordered structure whereby O1 is fully protonated, with the O–H bond vectors oriented parallel to the c-axis, and the incorporation of H charge balanced by vacancies on the Mg2 site.3This model, shown in
Fig. 1b, corresponds to a theoretical maximum H2O content of
3.3 wt%, which is in good agreement with a range of experi-mental measurements.2,5,6 Recently, Tsuchiya and Tsuchiya
performed a rst-principles density functional theory (DFT) study of model structures for hydrous wadsleyite.17 Fully
hydrated structures with vacancies on the Mg2 site (including the Smyth structure) were found to be stable; however, struc-tures with full hydration of O1 balanced by vacancies on the Mg3 site, such as the structure shown in Fig. 1c, were found to be energetically more favourable. Other theoretical studies have identied favourable locations for protonation close to other oxygen sites in the structure. On the basis of electrostatic calculations, Downs suggested that the O2 site is a favourable location for protonation,18while Rosset al.performed electron
density calculations for wadsleyite and found favourable dock-ing sites close to all oxygens in the structure.19However, these
studies did not account directly for the presence (and position) of cation vacancies in the structure.
Experimental studies of wadsleyite with high H2O contents
have generally indicated that the main mechanism for hydrogen incorporation is through vacancies on the Mg3 site. Indeed, X-ray diffraction suggests that most protons are located around the edges of vacant Mg3 octahedra.20–23A recent neutron
diffraction study of a sample containing 1.6 wt% H2O found the
main location of deuterium atoms to be between the O1 and O4 oxygens,24 as in the lowest energy Mg3-vacancy structures
identied by Tsuchiya and Tsuchiya.17However, larger numbers
of hydrogen sites have been suggested for samples with lower H2O concentrations. Kohnet al.used1H solid-state NMR and
Fourier-transform infra-red (FTIR) spectroscopy to identify at least 14 different proton environments in samples with hydra-tion levels between 0.8 and 1.5 wt% H2O. It was suggested that
O1 is no longer the main protonation site at 1.5 wt% H2O.25
Jacobsen et al. used polarised FTIR spectroscopy to study a series of samples with hydration levels up to 1 wt% and Fig. 1 (a) Crystal structure of anhydrous wadsleyite with the four distinct O sites
and three distinct Mg sites indicated. (b and c) Hypothetical ordered structures for fully hydrated hydrous wadsleyite obtained through full substitution of Mg2 and Mg3, respectively. Mg vacancies are indicated by dashed circles.
[image:2.595.78.266.118.681.2]assigned OH bands to protons situated along the O1/O1, O1/ O3 and O1/O4 vectors.26However, Deon et al.recently
per-formed a combined XRD and FTIR study of samples containing 0.8 and 1.6 wt% H2O and suggested that most hydrogen is
located along the O1/O4 and O3/O4 edges of vacant Mg3 octahedra.27
The sensitivity of NMR to the local structural environment makes it a potentially powerful complementary method to diffraction and FTIR for probing the structure of hydrous wadsleyite. NMR is an excellent probe of structure and dynamics in both crystalline and disordered materials, providing information with no requirement for long-range order. However, the synthesis of high-pressure minerals for NMR studies can be very challenging. The low natural abun-dances of the NMR-active nuclei (25Mg (I¼5/2),17O (I¼5/2) and
2H (I¼1)) mean that isotopic enrichment is oen required for
enhancement of the NMR signal. Furthermore, the high pres-sures (15–20 GPa) that are needed to synthesise mantle transi-tion zone phases oen greatly restrict the amount of sample that can be produced. However, despite the difficulties associ-ated with NMR studies of high-pressure minerals, technological and methodological advances are enabling an increasing amount of structural insight to be obtained. The development of high-eld NMR spectrometers and experimental methodol-ogies such as DFS, WURST and QCPMG28–30has opened the way
for the study of“difficult”nuclei such as25Mg and17O, which can suffer from poor receptivity (even when isotopically enriched) owing to the quadrupolar broadening of spectral resonances. Furthermore, sophisticated experimental methods such as two-dimensional multiple-quantum (MQ)31 and
satel-lite-transition (ST) MAS32,33experiments have been applied to
achieve resolution of distinct resonances that are overlapped due to second-order quadrupolar broadening in conventional MAS NMR spectra.34–38 Indeed, the STMAS method offers
particular advantages in the study of high-pressure minerals, as sensitivity is typically 2–8 times higher than with MQMAS.33
Another recent advance that has greatly complemented experimental solid-state NMR methods is the development of DFT codes that utilise periodic boundary conditions. These codes enable the efficient calculation of NMR parameters of solids with high accuracy by exploiting the inherent periodicity associated with crystalline systems. In particular, codes employing the gauge including projector augmented wave (or GIPAW)39 approach, such as CASTEP40have seen widespread
application for a large range of crystalline systems. More recently, a number of studies have demonstrated how this approach can also provide valuable insight in the study of structure, disorder and dynamics in inner-Earth minerals.37,41–47
In the study of wadsleyite, NMR investigations have been relatively scarce to date.17O and29Si NMR spectra for
anhy-drous wadsleyite have been obtained48–50 and resonances
assigned to distinct sites in the structure usingrst-principles calculations.41For hydrous wadsleyite, in addition to the 1H
NMR study by Kohnet al.,25recent studies by Stebbins et al.
used29Si enrichment to obtain structural information and were able to observe the effect on29Si NMR spectra of trace
impuri-ties of paramagnetic transition metal ions in the structure.51,52
Here, we present a full multinuclear study of all the NMR-active nuclei present in anhydrous and hydrous wadsley-ite. For the inherently insensitive nuclei 25Mg, 17O and 2H, isotopic enrichment is used for the acquisition of high-quality NMR spectra. A variety of experimental methods are employed, including two-dimensional17O STMAS and1H double-quantum
(DQ) MAS NMR approaches, which provide a direct insight into the mechanism of hydration and enable the identication of distinct types of hydrated cation vacancies. These methods are complemented byrst-principles calculations performed for a series of recently proposed model structures containing a range of different cation vacancy congurations. Using this approach, we are able to identify which models provide a better descrip-tion of the overall structure in terms of both energetics and predicted NMR parameters. Additional calculations for a series of alternative defect structures together with heteronuclear correlation experiments provide further insight into the disorder that is observed to be present, leading to a more detailed picture of the local structure of this important mineral.
Experimental and computational methods
Synthesis 17O-enriched SiO
2and Mg(OH)2were prepared from the
reac-tion of 75%-enriched H217O with SiCl4 and Mg3N2,
respec-tively.34 Mg(17OH)
2 was dehydrated to give Mg17O. Mg(O2H)2
was prepared by the reaction of2H
2O with Mg3N2. 98%-enriched 25MgO was used without further modication. Relevant starting
materials were mixed, in some cases with non-enriched oxides, in the correct proportions to give Mg1.77H0.46Si17O4 (3 wt%
H217O), Mg1.772H0.46SiO4 (3 wt% 2H2O), and 25Mg2SiO4.
Mg2Si17O4was prepared previously (ref. 49). The compositions
(20–30 mg in most cases) were sealed in welded Pt capsules, with an external diameter of 3 mm and length of 3.5 mm, which were inserted into a 25/15 assembly comprising a MgO sleeve and spacers, LaCrO3heater, ZrO2outer sleeve, and Cr2O3
-doped MgO octahedron. The hydrous wadsleyite compositions were equilibrated at either 1100C and 14 GPa or 1200C and 14.5 GPa for 1–3 h, and the anhydrous composition at 1100C and 15 GPa for 2 h, using a split-cylinder 6–8 Kwai-type multi-anvil apparatus (Toshiba F grade tungsten carbide multi-anvils and pyrophyllite gaskets) and 5000-tonne hydraulic press. Further details of the assembly and press are given in ref. 53.
X-ray diffraction
X-ray powder diffraction patterns were recorded using a PAN-alytical X'Pert PRO diffractometer equipped with a Cu tube operating at 45 kV and 40 mA, a primary monochromator, and a 2.1position sensitive detector (Xcelerator). Lattice parameters were determined by Le Bail renement using Topas v4.1 soware.
FTIR spectroscopy
Unpolarised transmission FTIR spectra were recorded from irregular aggregates of powder, held by surface tension within
the squares of a TEM grid, using a Bruker Hyperion 1000 FTIR microscope connected to a Bruker Tensor 27 FTIR spectrometer.
Solid-state NMR
Solid-state NMR experiments were performed using Bruker Avance III spectrometers operating at magneticeld strengths, B0, of 14.1 T and 20.0 T, corresponding to1H Larmor
frequen-cies of 600.1 and 850.2 MHz, respectively. All experiments at both magneticelds were performed using a Bruker 2.5 mm probe, at a MAS frequency of 30 kHz, unless otherwise stated.
17O MAS NMR spectra were recorded using recycle intervals of 2
s or 30 s. Two-dimensional 17O STMAS NMR spectra were recorded using a phase-modulated split-t1pulse sequence, with
a recycle interval of 2 s. A double-quantumlter (DQF) was also used in the STMAS experiments to ensure the removal of the undesirable autocorrelation diagonal.54 For all STMAS
experi-ments, the rotor angle was adjusted prior to the experiment (to within an estimated accuracy of0.002) using Rb2SO4.33,55For 1H–17O CP MAS and two-dimensional HETCOR NMR
experi-ments, transverse magnetisation was obtained by cross polar-isation (CP) from1H using a contact pulse duration of 500ms
(ramped for1H), and a recycle interval of 1.5 s. Typical radio-frequencyeld strengths of 50 kHz and 10 kHz were used for1H and17O, respectively. Owing to the relatively low signal-to-noise for hydrous wadsleyite, these parameters were optimised using
17O-enriched Mg(OH)
2. 17O chemical shis were referenced
relative to H2O (l) at 0 ppm.
25Mg MAS NMR spectra were recorded using a spin-echo
pulse sequence to avoid baseline distortions owing to the rela-tively short T2 relaxation times. For the natural abundance
samples an initial double frequency sweep (DFS) pulse was used to increase signal sensitivity.56Spectra were referenced relative
to 11 M MgCl2using a secondary reference of MgO at 26 ppm.
The1H MAS NMR spectrum was recorded using the“Depth”
pulse sequence in order to reduce background signals from the probe.57 The two-dimensional homonuclear 1H correlation
experiment was carried out using the double-quantum (DQ) MAS pulse sequence in ref. 47 with two cycles of BABA58dipolar
recoupling for DQ excitation and reconversion. Sign discrimi-nation in the indirect dimension was achieved using the States, Haberkorn, Ruben method.59Recycle intervals of 2 s were used
for all1H NMR experiments. Spectra were referenced relative to TMS using the CH3 resonance of L-alanine at 1.1 ppm as a
secondary reference.
2H MAS NMR spectra were recorded using a recycle interval
of 5 s. Prior to each experiment, the rotor angle was adjusted (to within an estimated accuracy of 0.01) by minimising the linewidth of the OD resonance ofd4-malonic acid.
29Si MAS NMR spectra were obtained by direct polarisation of
29Si, with a recycle interval of 120 s. Although this duration is too
short to allow full relaxation, no difference in the relative intensities of the Si resonances was observed at shorter or longer recycle intervals. For the 1H–29Si CP MAS NMR experiment, transverse magnetisation was obtained by cross polarisation from1H using a contact pulse duration of 6 ms (ramped for1H) and a recycle interval of 3 s. Typical radiofrequency eld
strengths of 70 kHz and 50 kHz were used for 1H and 29Si, respectively. Two-pulse phase modulation (TPPM) 1H decou-pling was applied during acquisition. For the1H–29Si CP HET-COR NMR experiment, a contact pulse duration of 1 ms was used. Sign discrimination in the indirect dimension was ach-ieved using the States, Haberkorn, Ruben method.59Spectra were
referenced relative to TMS using the single resonance of for-sterite (Mg2SiO4) at62 ppm as a secondary reference. Further
experimental details are given in the relevantgure captions.
DFT calculations
Calculations of total energies and NMR parameters were carried out using the CASTEP DFT code,40employing the GIPAW
algo-rithm,39which allows the reconstruction of the all-electron wave
function in the presence of a magneticeld. The generalised gradient approximation (GGA) PBE functional60was employed
and core–valence interactions were described by ultraso pseudopotentials.61,62Total energies and NMR parameters were
calculated using a planewave energy cut-offof 50 Ry (680 eV) and integrals over the Brillouin zone were performed using a k-point spacing of 0.05A˚1. Calculations generate the absolute
shielding tensor (s) in the crystal frame. Diagonalisation of the symmetric part ofsyields the three principal components,sXX,
sYYandsZZ. The isotropic shielding,siso, is given by (1/3) Tr{s}.
The isotropic chemical shi, diso, is given by (siso sref),
wheresrefis a reference shielding. For17O and29Si,srefvalues of
251.1 ppm and 314.7 ppm, respectively, were determined by comparison to the experimental spectrum for anhydrous wad-sleyite. For25Mg a sref value of 565.7 ppm was taken from a
recent DFT study of MgSiO3.47For1H asrefvalue of 30.5 ppm
was determined by comparison of the calculated and experi-mental chemical shis forL-alanine.
The quadrupolar coupling constant, CQ ¼ eQVZZ/h and
asymmetry parameter,hQ¼(VXXVYY)/VZZare obtained directly
from the principal components of the electric eld gradient (EFG) tensor, which are ordered such that |VZZ|$|VYY|$|VXX|,
whereQis the nuclear quadrupole moment (for which experi-mentally determined values of 199.4 and25.6 mb were used for25Mg and17O, respectively).63In addition to the magnitude,
the calculations also generate the sign ofCQ. However, the sign
of CQ cannot be determined from the experimental data
presented in this work; therefore, when comparing calculated and experimental quadrupolar couplings, we refer only to the magnitude of the calculatedCQ.
For anhydrous wadsleyite, the initial atomic positions and unit cell parameters were taken from an experimental diffrac-tion structure.10 For hydrous wadsleyite model structures,
hydrated defects were introduced by the removal of magnesium atoms from anhydrous wadsleyite and manual insertion of two protons around the resulting vacancies. For the calculation of defects within ordered hydrous wadsleyite structures, a 21 1 supercell was used to isolate the defect from its periodic images. Prior to calculation of the NMR parameters, all struc-tures were fully geometry-optimised with the unit cell parame-ters allowed to vary using a cut-offenergy of 40 Ry andk-point spacing of 0.05A˚1. Calculations were carried out using CASTEP
version 5.5 on a 198-node (2376 core) Intel Westmere cluster with 2 GB memory per core and QDR Inniband interconnect at the University of St Andrews. Typical calculation wallclock times ranged from 0.5 to 2 h using 96 cores, depending on the size of the model unit cell being calculated.
Results
X-ray diffraction and FTIR spectroscopy
The phase purity of each sample was determined using powder XRD. The anhydrous,17O-enriched sample was pure wadsleyite, while the synthesis using the25Mg-enriched starting materials produced a mixture of wadsleyite, MgO and an unidentied minor phase. The 17O-enriched hydrous wadsleyite sample (referred to hereaer as wads-H) was found to be phase pure, while the sample of deuterated hydrous wadsleyite (hereaer referred to as wads-D) contained15 wt% clinoenstatite. It is known that the water content of hydrous wadsleyite can be determined from an empirical relationship between the hydration level and the ratio of thebandalattice parameters.26
Although anhydrous wadsleyite has orthorhombic symmetry (Imma), hydration results in a deviation of b from 90 and monoclinic (I2/m) symmetry.21,64The lattice parameters of the
hydrous wadsleyite samples were rened in both space groups, and the average values are given in Table 1. From these values, water contents of 2.9 wt% for wads-H and 3.2 wt% for wads-D were estimated. These values are close to the maximum hydration level of 3.3 wt%. We note that the empirical rela-tionship relating the water content tob/arelies on calibrations of infrared spectra that may not be appropriate; however, it allows relative water contents to be compared between studies, although the absolute error may be as high as 20%.23
FTIR spectra of the O–H stretching region (shown in ESI†) are broadly consistent with previous results for1H (ref. 25, 26
and 65) and2H (ref. 24) hydrous wadsleyite. The2H/(1H +2H)
ratio of wads-D was estimated from the relative intensities of the1H–O and2H–O stretching bands near 3350 and 2475 cm1, respectively, to be0.35 (noting that the absorption coefficient of1H–O is 1.89 times that of2H–O).
Solid-state NMR spectroscopy
17O MAS NMR spectra of anhydrous wadsleyite and wads-H are
compared in Fig. 2. As observed previously at lower magnetic
eld49,50 for anhydrous wadsleyite, a sharp resonance is
observed corresponding to the O1 species, which has a small quadrupolar interaction as a result of its relatively symmetric
local environment. Intensity observed between 80 and 40 ppm corresponds to the silicate oxygens O2, O3 and O4, which have larger quadrupolar interactions, and for which the resonances are consequently overlapped in the spectrum. Resolution is increased in a17O STMAS NMR spectrum, shown in Fig. 2b,
where the O1 and O2 sites are well separated in the isotropic dimension. At 20.0 T, the resonances corresponding to the O3 and O4 silicate oxygens remain closely spaced in the d1
dimension. However, these resonances have been resolved and assigned in previous studies at lower magnetic eld.49,50
Experimental NMR parameters for the four distinct oxygen sites in anhydrous wadsleyite are summarised in Table 2.
Fig. 2c shows a 17O MAS NMR spectrum of wads-H. This spectrum has a similar overall appearance to that for anhydrous wadsleyite, featuring a sharp O1 resonance and broader inten-sity corresponding to overlap of signals from O2, O3 and O4. However, the relative intensity of the O1 resonance is signi -cantly reduced, and expansion of the region between 30 and 20 ppm (shown in the inset) reveals an additional, much broader resonance. The width and position of this resonance is consistent with that expected for a hydroxyl oxygen, which, in silicates, typically exhibit large quadrupolar coupling constants of between 6 and 7 MHz.32,66,67The simultaneous reduction in
relative intensity of the O1 resonance and observation of hydroxyl group resonances suggests that hydrogen has been incorporated into the structure by bonding to O1. In the17O STMAS NMR spectrum of wads-H, shown in Fig. 2d, the hydroxyl resonance is visible at a d1 value of20 ppm. The
spectrum also exhibits signicant broadening of the resonances in both dimensions. It has been shown in STMAS NMR studies of other hydrated silicates that resonances in STMAS NMR spectra can be broadened as a result of microsecond timescale dynamics.42,68However, a17O triple-quantum MAS NMR
spec-trum of wads-H (shown in ESI†) was recorded and found to be identical in appearance to the 17O STMAS NMR spectrum.
MQMAS NMR experiments are not sensitive to dynamics on the same timescale, and therefore the observation of broadening in both high-resolution spectra indicates the presence of posi-tional disorder rather than dynamics in the material.
To help interpret the 17O NMR data, rst-principles DFT calculations were carried out. As a starting point, NMR param-eters were calculated for anhydrous wadsleyite and the six fully hydrated ordered model structures identied by Tsuchiya and Tsuchiya.17 In each of these structures, two Mg2+ cations per
unit cell are substituted for four protons, giving a formula unit of Mg7Si4O14(OH)2. Models containing vacancies on the Mg2
and Mg3 sites are denoted by vMg2a,band vMg3a–d, respectively. In the vMg2 structures, the O1–H bond vectors lie parallel to the crystallographiccaxis, each pointing into the centre of four O4 sites. The vMg2astructure (shown in Fig. 1b) is equivalent to
that proposed by Smyth, while in vMg2b(shown in ESI†)
adja-cent O1–H bond vectors point in opposite directions. In the vMg3 structures, removal of the Mg3 cation is balanced by the incorporation of hydrogen atoms on O1 that form O1–H/O4 hydrogen bonds along the longer O1/O4 edge (3.12˚A) of the vacant Mg3 octahedron (as shown for vMg3ain Fig. 1c). The four vMg3 structures differ in the relative positions of the two Mg3 Table 1 Unit cell parameters for samples of hydrous wadsleyite and calculated
water contents.26The error in the lattice parameters corresponds to the difference between refinements inImmaandI2/m. The value ofbis forI2/m
Sample a(˚A) b(˚A) c(˚A) b() b/a H2O (wt%)
Wads-H 5.6646(4) 11.5818(5) 8.2388(3) 90.051 2.0446 2.9 Wads-D 5.6654(1) 11.6041(20) 8.2412(9) 90.176 2.0482 3.2a
aNo correction was made for the difference in mass between1H and2H.
vacancies within the unit cell. All structures were fully geometry-optimised prior to calculation of the NMR parameters. Whilst in all cases the basic wadsleyite structure was preserved, geometry optimisation resulted in small changes to the bond distances in all structures and more signicant local distortions of the structures around the hydrated defects. In the following discussions of hydrogen locations within the optimised struc-tures, we therefore refer to O/O distances as given in the unoptimised anhydrous structure10for clarity. Further details of
the model structures used, and calculated17O NMR parameters for all structures, are given in ESI.†
Simulated 17O (20.0 T) MAS NMR spectra based on the calculated NMR parameters for each model structure are shown in Fig. 3. For anhydrous wadsleyite, good agreement between the calculated and experimental NMR parameters is observed (as shown in Table 2), and the simulated17O MAS NMR trum shown in Fig. 3a agrees well with the experimental spec-trum in Fig. 2a. The simulated spectra for the model structures vMg2aand vMg2bshow very poor agreement with the experi-mental 17O MAS NMR spectrum of wads-H. In these model
[image:6.595.130.468.54.287.2]structures, hydrogen bonding between the O1–H hydroxyl protons and O4 silicate oxygens signicantly changes the chemical shifor the O4 species resulting in intensity between Fig. 2 (a and c)17O (20.0 T) MAS and (b and d) STMAS NMR spectra of (a and b) anhydrous wadsleyite and (c and d) wads-H. MAS NMR spectra are the result of coadding 360 transients separated by a recycle interval of 30 s. STMAS NMR spectra are the result of averaging (b) 1280 and (d) 512 transients separated by a recycle interval of 1 s for each of (b) 164 and (d) 128t1increments of 43.06ms. In each case an echo duration of 1.8 ms was used and the MAS rate was 30 kHz.
Table 2 Experimental and calculated17O quadrupolar coupling constants,CQ, asymmetry parameters,hQ, and chemical shifts,diso, for anhydrous wadsleyite
Site Cexp
Q /MHz hexpQ dexpiso (ppm) CcalcQ /MHz hcalcQ dcalciso (ppm)
O1 1.3(1)a n. d. 38(1)b 1.56 0.45 36.9 O2 5.0(1) 0.9(1) 78(1) 5.16 0.94 78.3 O3 4.4(1)b 0.2(1) 66(1)b 4.78 0.19 68.6 O4 3.8(1)b 0.3(1) 65(1)b 4.13 0.28 66.5
aEstimated from the value ofP
Q(¼CQ(1 +hQ2)1/2) determined in ref. 49. bDetermined in ref. 50.
Fig. 3 Simulated17O (20.0 T) MAS NMR spectra for (a) anhydrous wadsleyite and (b–g) fully hydrated ordered model structures for hydrous wadsleyite based on calculated NMR parameters. Lorentzian line broadening factors of (a) 200 Hz and (b–g) 400 Hz were applied prior to Fourier transformation of the simulated FIDs.
[image:6.595.324.535.343.624.2] [image:6.595.43.292.377.442.2]90 and 70 ppm in the simulated spectra, which is not observed experimentally. This indicates that vacancies on the Mg2 site are not the main mechanism for hydration in wadsleyite. Better agreement with the experimental data is observed for the model structures vMg3a–d. Although these structures also contain O1–H/O4 hydrogen bonds, the different geometries of the hydroxyl groups result in17O NMR parameters for the
sili-cate oxygens that are more consistent with the intensity observed experimentally, between 80 and 40 ppm. Furthermore, the calculated quadrupolar parameters for the hydroxyl oxygen yield a lineshape that agrees well with the experimental hydroxyl resonance.
Calculated unit cell parameters and total energies for the ordered model structures are summarised in Table 3. Total energies are given (in kJ per mole of fully hydrated wadsleyite (Mg7Si4O14(OH)2)) relative to the lowest energy structure.
Further details of the calculation of these total energies are given in the ESI.†Considering the calculated total energies, the vMg3a–dstructures are found to be much more favourable, as was observed by Tsuchiya and Tsuchiya.17The lowest energy
structure, vMg3a, is lower in energy than vMg2aand vMg2bby
132 and 187 kJ mol1, respectively. For vMg3aand vMg3d, the
geometry-optimised structure exhibits a distortion of the unit cell from orthorhombic to monoclinic symmetry. This is consistent with the experimental diffraction studies that have observed an increase in the unit cell b angle from 90 with increasing H2O content.21,64,65 However, the reported
(experi-mental)bangles range between90.1and 90.4, which is less than the value of 92.82predicted by the calculation for vMg3a. It was suggested by Tsuchiya and Tsuchiya that the similarity in energy of the other vMg3 structures means that disorder of the Mg3 vacancies could be possible and may result in partial cancelling of the monoclinic distortion.17This would also be
consistent with the disorder observed in the17O STMAS NMR
spectrum of wads-H.
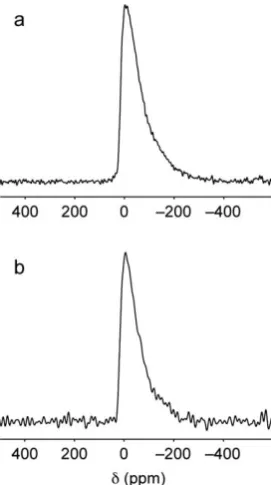
25Mg MAS NMR spectra of 25Mg-enriched anhydrous
wad-sleyite and wads-H are shown in Fig. 4. A 25Mg MAS NMR
experiment carried out for the anhydrous sample used for17O NMR (which is natural abundance in25Mg) was unsuccessful owing to the very small quantity of sample. In the25Mg MAS NMR spectra, distinct magnesium sites are unresolved and the observation of broadened intensity extending to lower frequency indicates some disorder in the structures. For wads-H, this is consistent with the disorder observed in the17O NMR spectra. For the25Mg-enriched anhydrous wadsleyite sample, the additional impurity phases that are known to be present in the sample may contribute to the broadening observed.
However, we note that the dominant impurity, MgO, is not observed in the spectrum, probably owing to the very longT1
relaxation time for this phase (60 s) compared to the short recycle interval (0.5 s) used in the experiment.
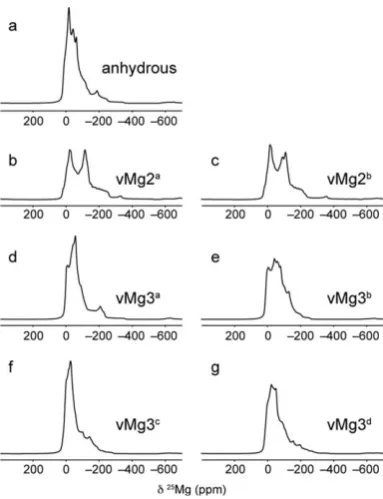
The similarity in appearance of the experimental25Mg NMR spectra for anhydrous wadsleyite and wads-H suggests that
25Mg NMR is not very sensitive to the structural changes that
take place upon hydration. However, simulated 25Mg NMR spectra based on calculated NMR parameters for anhydrous wadsleyite and the six ordered model structures, shown in Fig. 5, indicate that it should be possible to distinguish between fully hydrated structures with Mg2 vacancies and Mg3 vacan-cies. Indeed, reasonable agreement between the simulated and experimental spectra is observed for anhydrous wadsleyite. The superposition of relatively sharp and broad second-order quadrupolar lineshapes in each case gives spectra that exhibit decreasing intensity to lower frequency, as seen in the experi-mental spectrum. In contrast, simulated25Mg NMR spectra for vMg2a and vMg2b, shown in Fig. 5b and c, are signicantly different in appearance to the experimental spectrum for wads-H, with two distinct features clearly observed. The simulated spectra for vMg3a–dshow better agreement, each exhibiting one main feature with broadened intensity extending to low frequency. Even in the presence of disorder resulting in a broadening of the experimental lineshape, it should be possible to identify spectral features indicative of the fully hydrated vMg2 structure if they were present in signicant amounts. The
25Mg NMR data are therefore consistent with the 17O NMR
[image:7.595.360.496.49.292.2]spectrum that supports the presence of Mg3 vacancies. The calculated 25Mg NMR parameters for the six fully hydrated ordered model structures are given in ESI.†
Table 3 Unit cell parameters and calculated total energies relative to the lowest energy structure,Ecalc
rel, for fully ordered model structures for hydrous wadsleyite
vMg2a vMg2b vMg3a vMg3b vMg3c vMg3d
a/˚A 5.82 5.82 5.71 5.71 5.74 5.72
b/˚A 11.56 11.56 11.70 11.69 11.77 11.71
c/˚A 8.29 8.34 8.30 8.31 8.21 8.25
b() 90 90 92.82 90 90 92.24
Ecalc
rel /kJ mol1 132.15 187.46 0.00 14.40 33.12 44.17
Fig. 4 25Mg (20.0 T) MAS NMR spectra of (a)25Mg-enriched anhydrous wadsleyite and (b) wads-H. Spectra are the result of coadding (a) 109 552 and (b) 163 840 transients separated by a recycle interval of 0.5 s. For wads-H an initial DFS pulse was used to increase signal sensitivity. In both cases the MAS rate was 30 kHz.
[image:7.595.42.289.654.730.2]1H solid-state NMR offers a direct insight into the local
[image:8.595.71.263.47.297.2]environment of the hydrogen atoms in the structure of hydrous wadsleyite. A 1H MAS NMR spectrum of wads-H is shown in Fig. 6a. The spectrum exhibits an intense resonance at4 ppm, together with a broad‘shoulder’at approximately 2 ppm. These chemical shis are consistent with other measurements of hydroxyl protons in Mg–OH environments,69,70and are therefore
consistent with the main mechanism of hydrogen atom incor-poration being protonation of the O1 site. However, in addition to this main region of intensity, weaker resonances are also observed between approximately 6 and 10 ppm. These higher chemical shis indicate the presence of protons that are in different (i.e., not Mg–OH) environments. A t of the experi-mental spectrum assuming four individual Lorentzian line-shapes (and including spinning sidebands which are outside of the displayed spectral region) is shown underneath the experi-mental spectrum in red, with the individual components shown in blue. Integrated peak intensities obtained from thet are summarised in Table 4. It can be seen that the resonances with chemical shis greater than 6 ppm account for17% of the total intensity, indicating that the protons in non-Mg–OH environments represent a small but signicant proportion of the total number of protons in the sample. A two-dimensional
1H DQMAS NMR spectrum, shown in Fig. 6b, correlates
homonuclear dipolar-coupled spin pairs enabling the identi -cation of protons that are in close proximity to each other. The two-dimensional spectrum provides higher resolution and conrms the presence of a number of distinct H sites. The main region of high intensity is revealed to be composed of two distinct species with chemical shis ofdSQ¼4.1 and 3.9 ppm. A
weak autocorrelation signal is also observed atdSQ¼1.2 ppm.
This resonance does not correlate with any other resonances in the spectrum, indicating that it corresponds to H species that are either more remote within the structure or related to a background signal from the rotor, as has been observed in another 1H NMR study of high-pressure minerals.71 The
[image:8.595.332.524.50.353.2]Fig. 5 Simulated25Mg (20.0 T) MAS NMR spectra for (a) anhydrous wadsleyite and (b–g) fully hydrated ordered model structures for hydrous wadsleyite based on calculated NMR parameters. In each case a Lorentzian line broadening factor of 400 Hz was applied prior to Fourier transformation of the simulated FID.
Table 4 Experimental1H and 2H chemical shifts,
diso, quadrupolar coupling constants,CQ, and asymmetry parameters,hQ, and relative intensities for H sites in hydrous wadsleyite samples obtained fromfits to1H and2H MAS NMR spectra shown in Fig. 6a and 7a
Wads-H Wads-D
Site
diso1H (ppm)
Rel. int. (%)
diso2H (ppm)
Rel. int. (%)
CQ2H/
kHz hQ
1 1.1 19 2.8 13 240(10) 0.1(1)
2 3.4 64 4.6 57 223(10) 0(1)
3 6.7 10 7.9 9 184(10) 0.2(1)
4 8.6 7 9.7 21 148(10) 0.3(1)
Fig. 6 (a) A1H (14.1 T) MAS NMR spectrum of wads-H. The spectrum is the result of coadding 16 transients separated by a recycle interval of 10 s. A deconvolution of the experimental spectrum is shown below the MAS lineshape in red, with individual components shown in blue. (b) A rotor-synchronised1H (14.1 T) DQMAS NMR spectrum of wads-H recorded using two cycles of BABA recou-pling.58DQ correlations are indicated by dashed lines. The diagonal line shows the axisd1¼2d2around which symmetrical correlation peaks are expected to appear. The1H DQMAS NMR spectrum is the result of coadding 32 transients separated by a recycle interval of 2 s for each of the 100t1increments of 33.33ms. Both spectra were recorded at a MAS rate of 30 kHz.
[image:8.595.303.553.533.632.2]spectrum exhibits a considerable spread along thedDQ¼2dSQ
diagonal, indicating a distribution of hydroxyl proton environ-ments. In addition to the Mg–OH resonances, correlations involving the protons with higher chemical shi are also observed. The resonances atdSQ ¼8.6 and 6.7 ppm correlate
with each other, and that atdSQ¼8.6 ppm correlates with the
resonance atdSQ¼3.9 ppm. This conrms that protons with
both high and low chemical shis belong to the same phase, and indicates that multiple types of proton environments can exist for each hydrated cation vacancy.
A rotor-synchronised2H MAS NMR spectrum of wads-D is shown in Fig. 7a. This spectrum has a similar overall appear-ance to the1H MAS NMR spectrum of wads-H, but is better resolved owing to the smaller dipolar coupling for 2H. The spectrum exhibits an intense resonance at 4.6 ppm with a shoulder at 2.8 ppm, as well as two lower-intensity resonances at 7.9 and 9.7 ppm. These values are slightly higher than the1H chemical shis found for wads-H, although this could be due to the difference in hydrogen-bonding strength between1H and 2H, and also possibly due to small differences in referencing.
We note that a1H MAS NMR spectrum of the residual protons in
wads-D (shown in ESI†) exhibits very similar chemical shis to those observed for wads-H. As well as providing higher resolu-tion,2H MAS NMR can be a sensitive probe of microsecond timescale dynamics, as modulation of the 2H quadrupolar coupling by dynamic processes can lead to a temperature-dependent broadening of the MAS sidebands.45,68,72However, a
second2H MAS NMR spectrum recorded at 373 K (shown in ESI†) showed no signicant differences in the spectrum to that recorded at ambient temperature, conrming that microsecond timescale dynamics do not appear to be present.
Fig. 7b shows a2H MAS NMR spectrum of wads-D recorded
with a wider spectral width. In this spectrum, the rst-order quadrupolar broadening of the2H NMR resonances results in
the observation of a spinning sideband manifold across a frequency range of approximately 200 kHz. 2H quadrupolar parameters obtained from ts for each of the four sites are summarised in Table 4. For the resonances with the lower chemical shis,CQvalues of 240 and 223 kHz, andhQvalues of
0.09 and 0.00 are consistent with deuterons in Mg–OH envi-ronments.45 However, the 2H species with higher chemical
shis have smallerCQvalues of 184 and 148 kHz and slightly
higherhQ values of 0.17 and 0.27. This further indicates that
these resonances do not correspond to deuterons in Mg–OD environments.
Calculated1H chemical shis for the ordered model
struc-tures are summarised in Table 5. For vMg2a, the values of 3.6
and 3.5 ppm are within the distribution of the highest intensity observed in the 1H DQMAS NMR spectra. For vMg2b, the
calculated chemical shiof 1.3 ppm for H2 is consistent with the low intensity resonance observed at 1.2 ppm. For the vMg3 structures, it can be seen that the arrangement of the Mg3 vacancies affects the calculated 1H chemical shi, with
pre-dicted values between 3.6 and 5.2 ppm for the four structures. The disordered co-existence of these different arrangements could give rise to the broad region of intensity observed around
dSQ¼4 ppm in the1H DQMAS NMR spectrum. However, none
of the model structures adequately explain the resonances with higher chemical shi observed between 6 and 9 ppm. The observation of these resonances suggests the presence of protons in more strongly hydrogen-bonded environments.
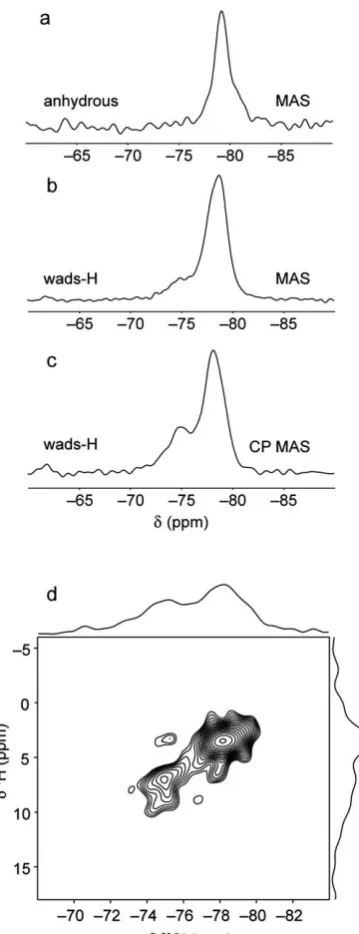
To obtain further insight into the nature of the proton environments, 29Si solid-state NMR experiments were
per-formed.29Si MAS NMR spectra for anhydrous wadsleyite and
wads-H are compared in Fig. 8a and b. For anhydrous wad-sleyite, the observation of a single sharp resonance at79 ppm is consistent with the single crystallographic Si site in the crystal structure, and is in agreement with previous work.48,50–52For
wads-H, the 29Si MAS NMR spectrum appears very similar to that obtained for anhydrous wadsleyite, with an intense reso-nance observed at 78.8 ppm. However, a lower intensity
[image:9.595.46.291.396.666.2]Fig. 7 (a) Rotor-synchronised and (b) wide-spectral width2H (14.1 T) MAS NMR spectra of wads-D. A deconvolution of the experimental spectrum in (a) is shown below the MAS lineshape in red, with individual components shown in blue. Spectra are the result of coadding (a) 4126 and (b) 12 378 transients separated by recycle intervals of 5 s. MAS rates were (a) 12.5 kHz and (b) 20 kHz.
Table 5 Calculated1H and29Si chemical shifts,
dcalciso, for anhydrous wadsleyite and fully ordered model structures for hydrous wadsleyite
dcalciso (ppm)
Site Anhyd. vMg2a vMg2b vMg3a vMg3b vMg3c vMg3d
H1 — 3.6 3.9 4.2 3.6 4.6 5.2
H2 — 3.5 1.3 4.2 3.6 4.6 5.2
Si1a –79.0 –80.7 –80.0 –76.8 –77.2 –77.8 –78.2 Si1b — –80.6 –80.8 –76.9 –78.9 –78.1 –78.2
Si1c — — — –78.4 — — —
Si1d — — — –78.4 — — —
[image:9.595.301.553.625.729.2]‘shoulder’is also observed at approximately75 ppm. In a29Si CP MAS NMR spectrum, shown in Fig. 8c, the relative intensity of the shoulder is signicantly increased and the position of the main resonance is shied slightly to78.2 ppm. The increased intensity of the additional resonance indicates that it corre-sponds to a silicon species that is closer to hydrogen in the
structure than those that correspond to the main resonance. In a recent study by Stebbinset al., the observation of resonances around 75 ppm in 29Si CP MAS NMR spectra of hydrous wadsleyite was attributed to the presence of a signicant impurity of phase B, a dense hydrous magnesium silicate phase that was known to be present in the sample.52 However, no
evidence of this (or any other) phase was observed in X-ray diffraction measurements of the sample used in the current study. Furthermore, for phase B, a second resonance corre-sponding to a SiVI site is expected at 166 ppm.71,73 A SiVI
resonance was observed in a29Si CP MAS NMR spectrum of a mixed phase sample known to contail a signicant proportion of a related material, superhydrous phase B (shown in ESI†). However29Si CP MAS NMR spectra recorded for wads-H with contact times of up to 10 ms (shown in ESI†) did not show any evidence for resonances between :165 and :170 ppm that would indicate the presence of phase B or superhydrous B. This indicates that the additional resonance at 75 ppm corre-sponds to a silicon species within the hydrous wadsleyite structure itself.
Further insight is obtained from a1H–29Si two-dimensional
HETCOR correlation spectrum of wads-H, shown in Fig. 8d. This spectrum was recorded using a relatively short contact time of 1 ms in order to favour short through-space proximities. In this spectrum, a high-intensity correlation peak is observed between the29Si resonance at78.2 ppm and the1H resonances around 4 ppm. This is consistent with magnetisation transfer between Mg–OH hydroxyl protons and nearby pyrosilicate silicon species in the structure. However, a second low-intensity correlation is also observed between the29Si resonance at75.0 ppm and the protons at chemical shis between 6 and 10 ppm. This conrms that the additional29Si resonance is unlikely to correspond to phase B or superhydrous phase B, since a correlation with Mg–OH protons at lower chemical shi would be expected. Indeed, a 1H DQMAS NMR spectrum of a sample containing
superhydrous phase B (shown in ESI†) exhibits just two reso-nances with chemical shis of 4.2 and 3.8 ppm (in good agree-ment with previous 1H NMR studies of superhydrous phase B71,73). Therefore, if phase B or superhydrous B were present in
wads-H, the1H–29Si HETCOR spectrum would be expected to exhibit a correlation between the29Si resonance at75 ppm and proton resonances at lower chemical shi.
[image:10.595.76.256.46.514.2]Calculated29Si chemical shis for anhydrous wadsleyite and the ordered fully hydrated model structures are summarised in Table 5. For the model structures, a loss of symmetry upon incorporation of H into the structure leads to the structures having two or four crystallographically distinct silicon sites in the unit cell. The calculated29Si chemical shiof79 ppm for the single crystallographic Si site in anhydrous wadsleyite is in good agreement with the experimental value. For vMg2aand
vMg2b, the calculated chemical shis show the opposite
behaviour to those observed experimentally, being shied downeld slightly to–80.0 and80.7 ppm. The calculated29Si chemical shis for vMg3a–d show better agreement with the experimental values, with shis predicted between 76.8 and78.9 ppm. Although the exact values of calculated shis would not necessarily be expected to be in perfect agreement Fig. 8 29Si (14.1 T) MAS NMR spectra of (a) anhydrous wadsleyite and (b)
wads-H, and (c) a1H–29Si (14.1 T) CP MAS NMR spectrum of wads-H. (d) A1H–29Si (14.1 T) CP HETCOR NMR spectrum of wads-H. MAS NMR spectra are the result of coadding (a) 136 and (b) 1576 transients separated by a recycle interval of 120 s. The1H–29Si CP MAS NMR spectrum was recorded using a contact pulse duration of 6 ms and is the result of coadding 2400 transients separated by a recycle interval of 3 s. The HETCOR spectrum is the result of coadding 2720 transients separated by a recycle interval of 1.5 s for each of the 28t1increments of 50ms. Polarisation transfer was achieved using a contact pulse duration of 1 ms. Spectra were recorded at MAS rates of (a and d) 20 kHz, (b) 30 kHz and (c) 12.5 kHz.
with experimental values, calculated changes in shi(for29Si) have been shown to be extremely reliable.74 The calculated
shis lie within the range covered by the main resonance in the experimental spectrum and therefore do not fully account for the additional signal intensity between72.5 and76 ppm in the experimental CP MAS and HETCOR spectra.
Discussion
The multinuclear experimental NMR data are generally consis-tent with a model for the structure of hydrous wadsleyite in which most of the hydrogen is located on the O1 site, with the substitution charge balanced by Mg3 cation vacancies. Consid-ering the17O NMR data for wads-H, the simultaneous observa-tion of a resonance consistent with a hydroxyl oxygen and reduced intensity of the O1 resonance is a strong indication that hydrogen bonds to the O1 site to form Mg–OH hydroxyl groups. The presence of hydroxyl groups is further indicated by the1H and2H NMR spectra, which show high intensity resonances with
chemical shis that are consistent with protons and deuterons in Mg–OH environments. Calculated17O and25Mg NMR spectra
for fully hydrated ordered model structures give much better agreement with the experimental data for structures containing Mg3 vacancies than for structures containing Mg2 vacancies. The validity of the model structures with Mg3 vacancies is also supported by the signicantly lower calculated energies as compared to those with Mg2 vacancies. These ndings are consistent with a number of experimental X-ray diffraction studies of hydrous wadsleyite which have observed high concentrations of Mg3 vacancies together with the shortening of the O1–O4 distance, indicating that the proton sits on the edge of the octahedral vacancy.20,22,23,27Additionally, a recent neutron
powder diffraction study located deuterium in an O1–D/O4 hydrogen bond along the Mg3 octahedral edge.24
However, the models with ordered Mg3 cation vacancies do not provide a complete explanation for all the experimental NMR data. In particular, the observation of resonances with chemical shis between 6 and 9 ppm in the1H NMR spectrum, and a29Si
resonance with a chemical shiof75 ppm in29Si CP MAS NMR and1H–29Si HETCOR spectra are not consistent with any of the fully hydrated ordered model structures. It is possible that, while a large proportion of the hydrogen is located in environments such as those described by the model structures vMg3a–d, a smaller number are present in defects with different proton arrangements, or are centred around vacancies on different cation sites. Indeed, a number of other hydrogen locations have been proposed in the literature. In particular, FTIR and neutron powder diffraction measurements have been interpreted in terms of a bent O1–H/O3 hydrogen bond along the edge of a vacant Mg3 octahedron.24,26Recently, Deonet al.suggested that
protonation occurs along the O3–O4 edge of the vacant Mg3 octahedron (in addition to O1–O4), with random protonation of either two O1, two O3, or one O1 and one O3.27Diffraction studies
have generally reported that concentrations of cation vacancies on the Mg2 and Mg1 sites are low. However, it may be possible that low levels of hydrated Mg1 and Mg2 defects could contribute to the low-intensity signals observed in the NMR spectra.
To investigate the relative stabilities of alternative hydrated defects within the hydrous wadsleyite structure, further DFT calculations were carried out on additional model structures. A set of 24 additional structures was constructed, with each structure based upon a 211 supercell of the lowest energy ordered vMg3 structure, vMg3a. In each supercell, a single Mg3 vacancy was altered such that the proton conguration was changed, or it was replaced by a vacancy on another cation site. In this way, the models simulate an alternative hydrated defect within an otherwise ordered fully hydrated structure. For alternative defects based around Mg2 and Mg3 vacancies, congurations were considered that contained either a single hydroxyl proton and a single silanol proton, or two silanol protons. For congurations based around a vacancy on the Mg1 site, the relatively large distance from O1 meant that only defects containing two silanol protons were considered. Further details of all the structural models used are given in ESI.†Aer full geometry optimisation of each structure, the total internal energy and NMR parameters were calculated.
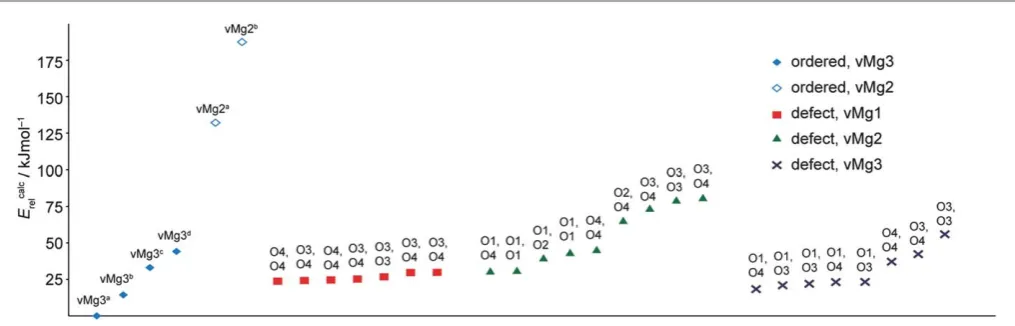
Fig. 9 Calculated total energies for fully hydrated ordered model structures (represented by empty andfilled blue diamonds) and structures containing a hydrated defect at an alternative cation site (represented by squares, triangles and crosses). For the defect model structures, the oxygen sites to which the hydrogen atoms are bonded within the alternative defect are indicated. Energies are shown relative to the lowest energy structure, vMg3a.
[image:11.595.44.552.530.693.2]Calculated total energies for the supercell defect structures are compared with energies for the ordered model structures in Fig. 9. The structures are ranked in terms of increasing total energy for each type of alternative defect and the oxygen sites to which the protons are bonded within the alternative defect are indicated. The results show that the fully ordered vMg3a
struc-ture still remains the lowest energy of all the strucstruc-tures considered. However, the energies for the alternative defect structures show that in many cases altering the proton con g-uration within one of the Mg3 vacancies in this structure, or replacing it with a vacancy in another location only leads to a relatively small increase in the total energy. For the structures where the alternative defect remains around Mg3 and simply differs in the proton conguration,ve structures have energies of less than 23 kJ mol1greater than vMg3a. These structures each have a Mg3 vacancy defect containing a single hydroxyl and a single silanol proton. In each of these alternative defects the hydroxyl proton forms an O1–H/O4 hydrogen bond along the longer (3.12A) octahedral edge, as in the fully hydrated˚ model structures. The silanol protons were found to form hydrogen bonds along the O3–H/O4 (2.91 ˚A), O3–H/O3 (2.85A) and O4˚ –H/O1 (3.12A) edges of the vacant Mg3 octa-˚ hedron. We note that structures containing defects with a proton situated in a bent O1–H/O3 (2.99˚A) hydrogen bond conguration (as has been suggested in the literature24,26) were
found to be unstable and always optimised to the O1–H/O4 (3.12˚A) position. Furthermore, structures with protons situated in hydrogen bonds along the O1/O1 (2.90˚A) and shorter O1/ O4 (2.79˚A) edges of the vacant Mg3 octahedron, which have also been suggested in the literature,26were also found to be
unstable, and similarly optimised consistently to the longer O1– H/O4 (3.12A) position.˚
Three other structures with Mg3 vacancy defects containing two silanol protons have energies between 37 and 55 kJ mol1
greater than vMg3a. The slightly higher energies of these
structures indicate that protonation of the O1 site is favoured over protonation of silicate oxygens. However, the calculated energies for the structures containing defects centred around Mg1 (which all contain two silanol protons) all fall within 30 kJ mol1 of vMg3a. For structures containing Mg2 vacancy defects, proton congurations including one or two O1–H hydroxyl groups are more favourable, although energies are higher in general than for the alternative Mg1 and Mg3 defects. Comparing the calculated energies with those deter-mined for the other ordered fully hydrated structures, the energies for the alternative defect structures are signicantly less than for the ordered structures vMg2a and vMg2b. This analysis does not provide a complete picture of the energetics of hydrated defects in wadsleyite as not all possible proton congurations have been considered. Furthermore, the calcu-lated energies do not account for nite temperature and entropic effects, which will be important in determining whether the types of defects considered can be stabilised under the high-temperature and/or high-pressure synthesis conditions. However, the calculations for the 24 additional model structures serve to illustrate that alternative types of defect including silanol protons can be accommodated within
the fully hydrated structure with only a small effect on the total energy.
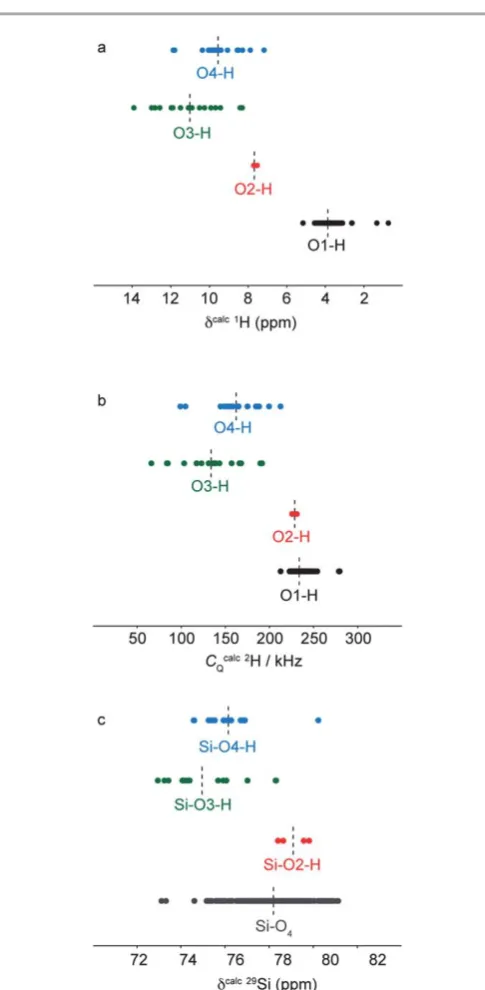
Calculated1H chemical shis for the ordered model struc-tures and alternative defect strucstruc-tures are plotted for each type of 1H environment in Fig. 10a. For O1–H hydroxyl protons,
[image:12.595.304.547.183.679.2]calculated chemical shis fall within the range 5.2–0.7 ppm, with an average shi(indicated by the dotted line) of 3.8 ppm. This is still within the range of the broad region of high signal observed in the experimental 1H DQMAS NMR spectrum of wads-H, indicating that the incorporation of the alternative
Fig. 10 Calculated (a)1H chemical shifts, (b)2H quadrupolar coupling and (c) 29Si chemical shifts for all H and Si sites in the ordered and defect-containing
model structures, grouped by local bonding environment. Average values for each group of parameters are indicated by dashed lines.
defects in the fully hydrated model structures does not have a signicant effect on the chemical shis of surrounding hydroxyl protons. In contrast, for protons bonded to silicate oxygens O2, O3 and O4, signicantly higher chemical shis are predicted, with values in the range 7.5–13.9 ppm. These values are generally higher than the experimental values for the high chemical shiresonances of 8.7 and 6.7 ppm. However, the calculated values indicate that signicantly higher chemical shis are expected for silanol protons, and therefore offer a possible explanation for the high chemical shi resonances observed experimentally. We note that a tendency for the overestimation of 1H chemical shis for hydrogen-bonded protons has been observed in other GIPAW studies.74–76
Calculated 2HCQ values for the ordered model structures
and the alternative defect structures are plotted for each type of
2H environment in Fig. 10b. The calculations predictC Qvalues
for O1–H hydroxyl deuterons in the range 212–280 kHz, with an average value of 233 kHz. This range is consistent with the values of 223 and 240 kHz measured for the deuterons with low chemical shiin the2H MAS NMR spectrum shown in Fig. 7b.
For O2–H deuterons, largeCQvalues are also predicted, with an
average value of 228 kHz. This makes it unlikely that the reso-nances with high chemical shicorrespond to hydrogen in O2– H environments, since smallerCQvalues of 148 and 184 kHz
were measured experimentally. However, for silanol O3–H and O4–H deuterons, distinctly smaller CQ values in the range
66–212 kHz are predicted, with average values of 134 and 162 kHz, respectively. These ranges and average values are in good agreement with the experimentalCQvalues measured for
the2H species with high chemical shi. This further indicates that the resonances at higher chemical shiobserved in the1H and2H NMR data correspond to silanol O3–H and O4–H.
Calculated29Si chemical shis for different types of silicon environments in the ordered fully hydrated model structures and the alternative defect structures are plotted in Fig. 10c. For silicon species in non-protonated silicate SiO4 environments,
[image:13.595.76.253.42.667.2]the calculated chemical shis lie between73.1 and81.1 ppm with an average value of 78.2 ppm. This value is in good agreement with the experimental chemical shi of the most intense resonance in the29Si CP MAS NMR spectrum of wads-H. Signicant shis are also predicted for Si–OH environments, depending on the oxygen site that is protonated. For silicon species directly bonded to a protonated O2 oxygen, a downeld shi is predicted, with an average value of 79.1 ppm. For silicon species directly bonded to protonated O3 and O4 oxygens, upeld shis are predicted with average values of 75.0 and76.2 ppm, respectively. The close proximity of the silicon species in these environments to the nearby silanol protons would favour their observation in29Si CP MAS NMR spectra over SiO4silicon species that are slightly further away
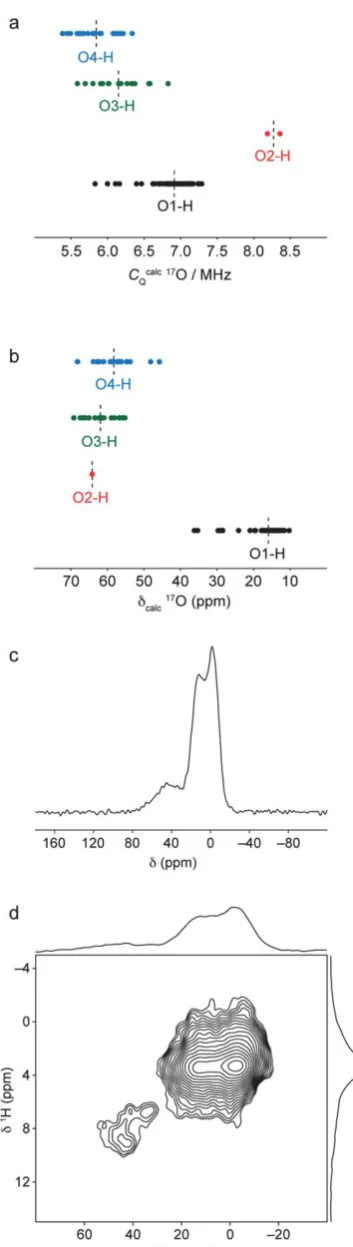
Fig. 11 Calculated (a) 17O quadrupolar coupling constants and (b) chemical shifts for all O sites in the ordered and defect-containing model structures, grouped by local bonding environment. Average values for each group of parameters are indicated by dashed lines. (c)1H–17O (20.0 T) CP MAS NMR
spectrum of wads-H obtained by coadding 3752 transients separated by a recycle interval of 1.5 s. (d)1H–17O CP HETCOR NMR spectrum of wads-H, obtained by coadding 400 transients separated by a recycle interval of 1.5 s for each of the 90t1increments of 33.33ms. The1H–17O CP MAS and HETCOR NMR spectra were both recorded at a MAS rate of 30 kHz, with polarisation transfer achieved using a contact time of 500ms.
from protons in the structure. The increased intensity of the resonance at around75 ppm in the29Si CP MAS NMR spec-trum of wads-H is therefore consistent with the presence of Si–O3–H and Si–O4–H silanol silicon species in the structure. Increased intensity in the region around 79.1 ppm is not observed experimentally, indicating that silicon species in Si–O2–H environments are not present in signicant quantities and that protonation of O2 is not extensive.
The1H and29Si solid-state NMR data are consistent with a structural model for hydrous wadsleyite whereby most hydrogen is incorporated as hydroxyl groups in Mg3 cation vacancies, while low levels of silanol O3–H and O4–H groups are also present. To obtain further evidence for the existence of silanol groups in the structure, we may consider what NMR parameters should be expected for17O species within the sila-nol groups. Fig. 11a plots calculated 17O CQ values for all
hydroxyl and silanol oxygen species in the ordered model structures and the 24 defect model structures considered in this study. In general, lowerCQvalues are calculated for oxygens in
O3–H and O4–H oxygens. However, the results suggest that it would be difficult to distinguish these from the O1–H hydroxyl oxygens, as there is considerable overlap in the ranges of calculatedCQvalues.
Calculated values for O2–H oxygens are signicantly larger, although this also means they will be more difficult to observe experimentally. However, a plot of calculated isotropic chem-ical shi for each type of oxygen environment, shown in Fig. 11b, shows that the silanol oxygens have signicantly higher chemical shis and should be distinguishable from the hydroxyl oxygens on this basis. The calculations predict that the silanol oxygens should fall in the same region as the sili-cate oxygen resonances, making them difficult to observe in
17O MAS, MQMAS and STMAS NMR spectra. Instead, it is
possible to favour the observation of oxygens that are close to protons by using a1H–17O CP MAS NMR experiment. A1H–17O
CP MAS NMR experiment was performed on wads-H using a contact time of 500 ms to ensure selective transfer between protons and nearby oxygens. This is slightly longer than contact times employed in other selective 1H–17O CP MAS NMR experiments;77however, the faster MAS frequency of 30
kHz used in this experiment (to maximise 1H resolution) necessitates longer contact times to achieve magnetisation transfer. In the 1H–17O CP MAS NMR spectrum, shown in Fig. 11c, a strong resonance corresponding to the hydroxyl oxygen species is observed owing to the close1H–17O proximity (approximately 1A as determined from the optimised model˚ structures) and high proportion of hydroxyl groups in the structure. In addition to the hydroxyl oxygen resonance, additional weak intensity is observed at higher chemical shi. In a 1H–17O heteronuclear correlation spectrum recorded
using the same 500ms contact time, shown in Fig. 11d, this resonance is observed to correlate with only the protons with higher chemical shis between 6–9 ppm, while the intense hydroxyl oxygen resonance correlates only with protons around 4 ppm. This conrms that those protons with high chemical shiare in close proximity to oxygen species that are not in Mg–OH environments. The position of the observed resonance
is instead consistent with the calculated 1H and 17O NMR parameters for oxygens in Si–OH environments.
Conclusions
[image:14.595.349.505.57.484.2]The multinuclear NMR data point towards a structural model for hydrous wadsleyite that is consistent with those proposed in recent studies whereby a large proportion of the cation vacan-cies are located on the Mg3 site, and protonation takes place along the longer O1/O4 (3.12 A) edges of the vacant Mg3˚ octahedron. An expanded view of this hydrated defect structure is shown in Fig. 12a. DFT calculations indicate that fully ordered structures containing hydrogens in locations such as Fig. 12 Expanded views of proposed models for hydrated defects surrounding the vacant Mg3 octahedron (shown in green) in the structure of hydrous wad-sleyite. Vacancies are shown containing (a) two hydroxyl, (b) one hydroxyl and one silanol, and (c) two silanol protons. Oxygen, silicon and hydrogen atoms are represented by red, blue and black spheres, respectively. The nomenclature of the oxygen species is as given in the anhydrous crystal structure.10