Agricultural sector is a key driver in the world-wide economic and social development. it plays a substan-tial role in achieving, among other, food security, economic diversification, poverty eradication, and human welfare. its role is highly emphasized while the international community, in particular developing countries, is struggling to cope with the impacts of the climate change and the implementation of response measures in a sustainable manner. The adjustment of planting dates and crop variety, and crop re-allocation are among the selected planned adaptation actions in the agricultural sector (iPcc 2007).
The vulnerability of the agricultural sector to climate changes has driven Saudi Arabia to set up programs and policies heading towards maximizing the utilization of its limited resources, mainly, the irrigation water supply and arable land to produce high value crops such as fruits and vegetables. The 8th Development Plan of Saudi Arabia (Ministry of Economy and Planning 2004) emphasized the importance of rationalizing the cultivation of water-intensive crops, such as cereals and fodder, in favour of highly water-efficient crops, such as fruits and vegetables.
This research paper underlines some of the promis-ing deliverables of a five-year research project (Al-Amoud et al., 2010) funded by the King Abdulaziz city for Science and Technology – Saudi Arabia
(http://www.kacst.edu.sa), to optimize the cropping pattern in Saudi Arabia using a mathematical sector model that would maximize the net annual return of the agricultural sector in Saudi Arabia and to ensure the efficient allocation of the scarce water resources and arable land among the competing crops.
Various modelling approaches have been applied to optimize the cropping pattern worldwide includ-ing the linear and nonlinear optimization models (haouari and Azaiez 2001; Singh et al. 2001; Montazar and rahimikob 2008; Kaur et al. 2010); deterministic linear programming and chance-constrained linear programming models (Sethi et al. 2006), the interactive fuzzy multi-objective optimization approach (zhou at al. 2007), the goal program approach (Vivekanadan et al. 2009), the multi-objective fractional goal pro-gramming approach (Fasakhodi et al. 2010), and the genetic algorithm model (Karamouz et al. 2010).
MATERIALS AND METHODS
Fourteen cash crops grown in nine major cropping-production regions (study regions) in Saudi Arabia were considered to optimize the cropping pattern in accordance with the regional comparative advantage. The considered crops covered different crop groups, namely, forage including alfalfa and roadus grass;
Optimization of the cropping pattern in Saudi Arabia
using a mathematical programming sector model
Ahmed M. Alabdulkader
1, Ahmed I. Al-Amoud
2, Fawzi S. Awad
21
King Abdulaziz City for Science and Technology, Life Sciences and Environment
Sector, Riyadh, Saudi Arabia
2
King Saud University, College of Food and Agricultural Sciences, Riyadh, Saudi
Arabia
Abstract:A mathematical sector model has been formulated to optimize the cropping pattern in Saudi Arabia aiming at maximizing the net annual return of the agricultural sector in Saudi Arabia and ensuring the efficient allocation of the scarce water resources and arable land among the competing crops. The results showed the potential for Saudi Arabia to optimize its cropping pattern and to generate an estimated net return equivalent to about 2.42 billion US$ per year. The optimized cropping pattern in Saudi Arabia has been coupled with about 53% saving in the water use and about 48% redu-ction in the arable land use compared to the base-year cropping pattern. comparable weights was given to different crop groups by allocating about 48.4%, 35.4%, 13.1%, and 3.2% to grow cereals, fruits, forages, and vegetables, respectively. These findings were in line with the national strategy to rationalize the cultivation of water-intensive crops in favour of highly wa-ter-efficient crops.
cereals including wheat, sorghum, millet, and sesame; vegetables including tomatoes, potatoes; and fruits including dates, melons, olives, orange, mango and lemon. The market structure was visualized in this study as having two supply regions. Both regions compete to satisfy the national demand of the given commodity. These supply regions represent: (i) supply from the major cropping-production regions or study regions, and (ii) supply from the outside study regions or the rest of the nation. At the given price, supply from study regions would represent the difference between the quantity demanded and the quantity supplied from the outside study regions.
A mathematical sector model has been formulated to achieve the ultimate objective of this study using the Lingo optimizer modelling program (2008), popular and reliable software used for solving optimization models. The mathematical formulation of the formu-lated sector model comprised four key components: objective function, resource constraints, national commodity balance and national trade balance.
The objective function of the sector model was to determine the optimal one-year cropping pattern in accordance with the comparative advantage in the major cropping-production regions in Saudi Arabia. The model maximized the net annual return subject to the limited water supply and arable land, given the marketing and trade balance constraints.
y j y j y jr y jr R r J j y j
y f W C X I E
Z
1 1 ( )
for all j, r (1)
where: y
Z = net economic return, in terms of US $ per year )
( y j W
f = welfare function which measures the area under the excess demand equation for jth crop in year y y
jr
C = average cost for the jth crop in rth study region, in terms of US $ per ton
y jr
X = average yield for jth crop in rth study region, in terms of tons per hectare
y j
I = net national imports for jth crop in year y, in terms of tons
y j
E = net national exports for jth crop in year y, in terms of tons
J = 1, 2, 3, …, 13 crops
R = 1, 2, 3, …, 9 study areas
The resource constrains ensured that the amount of the limited resources used in the production process did not exceed the available levels of resources. Two key resource constraints were applied in the model: water supply and arable land. Water supply constraint was presented in two forms: a monthly water supply and an annual water supply. The monthly water supply was used to overcome the seasonality of production and to ensure that the irrigation water requirements of
all crops in the study areas did not exceed the available monthly water supply, while the annual water supply constraint ensured that the annual irrigation water requirements for the considered economic crops in the study areas did not exceed a specific quantity of water annually. The mathematical illustration of the resource constrains was presented as follows:
t ir y jr j t
ijrX b
a for all i, r (2)
y r y jr j y
wjrX w
a for all r (3)
where: t ijr
a = input-output coefficients that states the amount of
ith resources required to produce one hectare of jth crop in rth study region in time t
y jr
X = annual yield for jth crop in rth study region in terms of ton per hectare
t ir
b = maximum amount of ith resource available in rth study region in time t
y wjr
a = irrigation water requirements (w) for jth crop in rth study region in year y
y r
w = maximum water supply in year y in rth study region
I = irrigation water requirement, and arable lands
T = 1, 2, 3 …, 12 months
For the given crop, the national commodity balance
comprised three key elements. These were the average supply in the study areas ( y
jr
GS ), the net national import ( y
jn
NI ) or the net national export ( y jn
NE ), and the excess national demand ( y
jn
Ed ). The national commodity bal-ance for the net-imported crops aimed at ensuring that the sum of the study areas’ supplies and the net national import were greater than or equal to the ex-cess national demand. on the other hand, the national commodity balance for the net-exported crops aimed at ensuring that the sum of the regional supplies was greater than or equal to the excess demand plus the net national exports for the given crop. The national commodity balance was illustrated mathematically for the net-imported crops and for the net-exporting crops, respectively, as follows:
0 y jr y jn y
jn NI GS
Ed (4)
0 y jr y jn y
jn NE GS
Ed (5)
where: y jn
Ed = excess national demand for the jth crop in year y y
jn
NI = net national imports for the jth crop in year y y
jr
GS = average production for the jth crop in year y y
dn
Ed = excess national demand for exporting crops in year y
y dn
NE = net national exports for exporting crops (d) in year y
y dr
The national trade balance ensured that the net national import ( y
jn
NI ) for the given crop did not ex-ceed a maximum limit for the net national imports ( y
jn
I ) annually, and the net national export ( y jn NE ) for the given crop did not exceed a maximum limit for the net national exports ( y
jn
E ) annually. The national trade balance could be illustrated mathematically as follows:
y jn y
jn I
NI (6)
y jn y
jn E
NE (7)
where: y jn
NI = net national imports for jth crop in year y y
jn
I = maximum limits for net national imports for jth crop in year y
y jn
NE = net national exports for jth crop in year y y
jn
E = maximum limits for net national exports for jth crop in year y
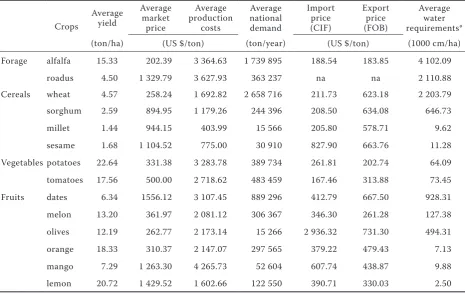
The key input-output coefficients for the math-ematical sector model include the average values of the following: yield, market price, production cost, ciF and FoB prices, crop water requirements and national demand for the considered cash crops.
More than 160 farms were field-surveyed and some statistical yearbooks were investigated to calculate the required input-output coefficients. Table 1 shows the input-output coefficients for the considered cash crops in Saudi Arabia.
RESULTS AND DISCUSSION
optimizing the cropping pattern of the considered crops in Saudi Arabia in accordance with the regional comparative advantage using the mathematical sector model showed the great potential of Saudi Arabia to restructure its cropping pattern in accordance with its limited water resources and arable land and to gener-ate a high net annual return equivalent to about 2.42 billion US$/year. The optimized cropping patterns would provide Saudi Arabia with the opportunity to reduce the cropping areas by about 48%, from about 704 thousand hectares to about 364 thousand hectares, and the water supply by about 53%, from 8.84 million cubic meters a year to about 4.12 million cubic meters a year.
[image:3.595.65.531.424.718.2]As shown in Figure 1, the optimized cropping patterns put comparable weights to different crop
Table 1. Mathematical programming sector model input-output coefficients in Saudi Arabia
crops
Average yield
Average market price
Average production
costs
Average national demand
import price (ciF)
Export price (FoB)
Average water requirements*
(ton/ha) (US $/ton) (ton/year) (US $/ton) (1000 cm/ha)
Forage alfalfa 15.33 202.39 3 364.63 1 739 895 188.54 183.85 4 102.09
roadus 4.50 1 329.79 3 627.93 363 237 na na 2 110.88
cereals wheat 4.57 258.24 1 692.82 2 658 716 211.73 623.18 2 203.79
sorghum 2.59 894.95 1 179.26 244 396 208.50 634.08 646.73
millet 1.44 944.15 403.99 15 566 205.80 578.71 9.62
sesame 1.68 1 104.52 775.00 30 910 827.90 663.76 11.28
Vegetables potatoes 22.64 331.38 3 283.78 389 734 261.81 202.74 64.09
tomatoes 17.56 500.00 2 718.62 483 459 167.46 313.88 73.45
Fruits dates 6.34 1556.12 3 107.45 889 296 412.79 667.50 928.31
melon 13.20 361.97 2 081.12 306 367 346.30 261.28 127.38
olives 12.19 262.77 2 173.14 15 266 2 936.32 731.30 494.31
orange 18.33 310.37 2 147.07 297 565 379.22 479.43 7.13
mango 7.29 1 263.30 4 265.73 52 604 607.74 438.87 9.88
lemon 20.72 1 429.52 1 602.66 122 550 390.71 330.03 2.50
Sources: calculated from field survey collected data (2007), Ministry of Agriculture (2007), Ministry of Agriculture official website www.agrwat.gov.sa/public/portal, Food and Agriculture organization www.fao.org
groups by allocating about 48.4%, 35.4%, 13.1%, and 3.2% to grow cereals, fruits, forages, and veg-etables, respectively, while the base-year cropping patterns, which represent the average cropping areas in Saudi Arabia during 2003–2005, placed a higher weight to cereals by allocating more than 61.2% from the cropping areas to cereals and 19.7% to fruits, 16.4% to forages, and 2.8% to vegetables, as shown in Figure 2. These findings were in line with the national strategy to rationalize the cultivation of water-intensive crops, such as cereals and fodder, in favour of highly water-efficient crops, such as fruits and vegetables.
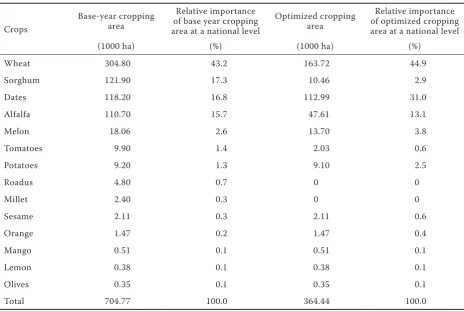
in terms of the allocated cropping area, the op-timized cropping pattern was given the priorities from among the fourteen considered cash crops to grow wheat, dates and alfalfa, respectively, with an allocated area equivalent to about 89% of the total cropping area in Saudi Arabia. The allocated crop-ping area was different in the base year, the cropcrop-ping pattern giving the priority to wheat, sorghum, dates, and alfalfa with a proximity allocated area equiva-lent to about 93% of the total cropping area. Table 2 compared the optimized cropping pattern versus the base year cropping pattern for each considered crop in Saudi Arabia.
Cereals 48.4%
Fruits 35.4% Vegetables
3.2%
Forage 13.1%
Cereals 61.2% Fruits
19.7% Vegetables
2.8%
[image:4.595.313.525.68.195.2]Forage 16.4%
Figure 1. optimized cropping pattern in Saudi Arabia
[image:4.595.72.282.69.194.2]us-ing sector model Figure 2. Base-year cropping pattern representing the aver-age cropping areas in Saudi Arabia during 2003–2005
Table 2. optimized cropping pattern Vs. Base year cropping pattern in Saudi Arabia
crops
Base-year cropping area
relative importance of base year cropping area at a national level
optimized cropping area
relative importance of optimized cropping area at a national level
(1000 ha) (%) (1000 ha) (%)
Wheat 304.80 43.2 163.72 44.9
Sorghum 121.90 17.3 10.46 2.9
Dates 118.20 16.8 112.99 31.0
Alfalfa 110.70 15.7 47.61 13.1
Melon 18.06 2.6 13.70 3.8
Tomatoes 9.90 1.4 2.03 0.6
Potatoes 9.20 1.3 9.10 2.5
roadus 4.80 0.7 0 0
Millet 2.40 0.3 0 0
Sesame 2.11 0.3 2.11 0.6
orange 1.47 0.2 1.47 0.4
Mango 0.51 0.1 0.51 0.1
Lemon 0.38 0.1 0.38 0.1
olives 0.35 0.1 0.35 0.1
[image:4.595.66.531.455.766.2]CONCLUSIONS
Saudi Arabia is among the most vulnerable countries regarding the impact of the climate change and the impact of the implementation of response measures. optimizing the cropping pattern of the cash crops in accordance with the comparative advantage in the major crop production regions in Saudi Arabia would scale up the capability to adapt to climate change and its impacts and it would demonstrate what crops and where to grow, given the limited natural resources, and to bridge the gap between the national demand and supply through importing from the world market. The findings of this research project are significant and will be of a great interest not only to the researchers working in the field, but they will also appeal to the decision makers and to a broader public.
ACKNOwLEDgMENT
The authors of this study are thankful to the King Abdulaziz city for Science and Technology (KAcST) – Saudi Arabia for its enormous financial funding and support.
REfERENCES
Al-Amoud A.i., Awad F.S., Alabdulkader A.M., Alazba A.A., Al-hamed S.A., Al-Tokhais A.S., Basahi J.M., Al-Moshaili A.M., Al-Dakheel Y.Y. (2010): Water re-quirements for economical crops in Saudi Arabia (in Arabic). King Abdulaziz city for Science and Technol-ogy. Saudi Arabia.
Fasakhodi A., Seyed h. nour., Amini M. (2010): Water resources sustainability and optimal cropping pattern in farming systems; a multi-objective fractional goal programming approach. Water resource Manage, 24: 4639–4657; Doi 10.1007/s11269-010-9683-z
Food and Agriculture organization. Available at www. fao.org
haouari M., Azaiez M.n. (2001): optimal cropping patterns under water deficits. European Journal of operational research, 130: 133–146.
iPcc (2007): climate change 2007: Synthesis repot. in: Pachauri r. K reisinger A. (eds.): contribution of Work-ing groups i, ii, and iii to the Forth Assessment report of the intergovernmental Panel on climate change. iPcc, geneva, Switzerland.
Karamouz M., zahraie B., Kerachian r., Eslami A. (2010): crop pattern and conjunctive use management: A case study. irrigation and Drainage, 59: 161–173.
Kaur B., Sidhu r.S., Kamal V. (2010): optimal crop plans for sustainable water use in Punjab. Agricultural Economics research review, 23: 273–284.
Lingo Modeling Language and optimizer (2008): release 11.0.0.4. LinDo Systems inc., chicago.
Ministry of Agriculture (2007): Agricultural Statistical Year Book. Saudi Arabia.
Ministry of Agriculture Saudi Arabia (2007): Available at www.agrwat.gov.sa/public/portal
Ministry of Economy and Planning (2004): The Eighth Development Plan 1425–1430 (2005–2009). Saudi Ara-bia.
Montazar A., rahimikob A. (2008): optimal water pro-ductivity of irrigation networks in arid and semi-arid regions. irrigation and Drainage, 57: 411–423. Sethi L.n., Panda S.n., nayak M.K. (2006): optimal crop
planning and water resources allocation in a coastal groundwater basin, orissa, india. Agricultural Water Management, 83: 209–220.
Singh D.K., Jaiswalb c.S., reddya K.S., Singha r.M., Bhan-darkar D.M. (2001): optimal cropping pattern in a canal command area. Agricultural Water Management, 50: 1–8.
Vivekanandan n., Viswanathan K., Sanjeev gupta (2009): optimization of cropping pattern using goal program-ming approach. oPSEArch, 46: 259–274.
zhou h., hui P., chi z. (2007): An interactive fuzzy multi-objective optimization approach for crop planning and water resources allocation. in: Bio-inspired computa-tional intelligence and Applications, Lecture notes in computer Science, 4688: 335–346, Springer, Berlin-heidelberg.
Arrived on 10th January 2011
Contact address:
Ahmed M. Alabdulkader, King Abdulaziz city for Science and Technology, Life Sciences and Environment Sector, P. o. Box 6086, riyadh 11442, Saudi Arabia