Received 22 November 2018 Accepted 28 November 2018
Edited by W. T. A. Harrison, University of Aberdeen, Scotland
‡ Thomson Reuters ResearcherID: F-8816-2012.
§ Thomson Reuters ResearcherID: A-5525-2009.
Keywords:crystal structure; polymorph; hydrogen-bond; 3-methoxybenzoic acid.
CCDC reference:1448794
Supporting information:this article has supporting information at journals.iucr.org/e
Crystal structure of a second monoclinic polymorph
of 3-methoxybenzoic acid with
Z
000= 1
Tze Shyang Chia,a‡ Huey Chong Kwong,bQin Ai Wong,aChing Kheng Quaha§ and Md. Azharul Arafathc*
aX-ray Crystallography Unit, School of Physics, Universiti Sains Malaysia, 11800 USM, Penang, Malaysia,bSchool of
Chemical Sciences, Universiti Sains Malaysia, 11800 USM, Penang, Malaysia, andcDepartment of Chemistry, Shahjalal
University of Science and Technology, Sylhet, 3114, Bangladesh. *Correspondence e-mail: [email protected]
A new polymorphic form of the title compound, C8H8O3, is described in the
centrosymmetric monoclinic space groupP21/cwithZ0= 1 as compared to the
first polymorph, which crystallizes with two conformers (Z0 = 2) in the
asymmetric unit in the same space group. In the crystal of the second polymorph, inversion dimers linked by O—H O hydrogen bonds occur and these are linked into zigzag chains, propagating along theb-axis direction by C— H O links. The crystal structure also features a weak–interaction, with a centroid-to-centroid distance of 3.8018 (6) A˚ . The second polymorph of the title compound is less stable than the reported first polymorph, as indicated by its smaller calculated lattice energy.
1. Chemical context
Methoxybenzoic acid, also called anisic acid, consists of three isomers with molecular formula C8H8O3: the crystal structures
of 2- and 4-methoxybenzoic acids with Z0 = 1 have been
reported (Parvez, 1987; Etteret al., 1988; Bryan, 1967; Cola-pietro & Domenicano, 1978; Faustoet al., 1997; Hathwaret al., 2011) and polymorphism has not been observed for these two isomers in the Cambridge Structural Database (CSD) (Version 5.39, last update August 2018; Groomet al., 2016) to date. In this article, we report a second polymorphic form (I) of 3-methoxybenzoic acid withZ0 = 1 and compare its
prop-erties with those of the previously reported first polymorphic form (I). Polymorph Icrystallizes in the monoclinic space group P21/n with a = 13.8034 (17) A˚ , b= 5.0275 (5) A˚ , c =
21.446 (3) A˚ and= 99.320 (13)(Raffo et al., 2014; refcode
EFINEO). The asymmetric unit of I consists of two mol-ecules with different conformations (Z0 = 2), which are connected into a homodimer through strong O—H O hydrogen bonds. As described below, these two conformers (A andB) differ in the orientation of the methoxy group and its relative position from the —OH group. DFT calculations suggest that theAconformer of Iis more energetically stable than theBconformer (Pereira Silvaet al., 2015).
2. Structural commentary
The asymmetric unit of I (Fig. 1) consists of a unique 3-methoxybenzoic acid molecule (Z0 = 1). The molecule is
almost planar with a maximum deviation of 0.107 (1) A˚ at atom O1. The molecules of Iadopt a similar conformation (overlay r.m.s.d. = 0.052 A˚ ) as compared to the conformerAof I(Raffoet al., 2014). The carboxyl group (O1/O2/C7/H1O2) of Iis close to coplanar with the attached phenyl ring (C1– C6) as indicated by the dihedral angle of 5.6 (7). The C8— O3—C3—C2 torsion angle of Iis176.63 (7)as compared to 176.75 (11) and 1.4 (2) for conformers A and B,
respectively, of I.
3. Supramolecular features
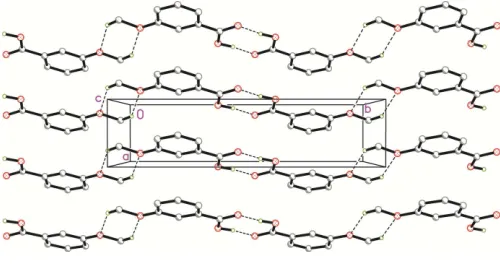
In the crystal of I, two inversion-related molecules are joined into a homodimer with an R2
2(8) graph-set motif via strong
pairwise O—H O hydrogen bonds (Fig. 2, Table 1). The homodimers are linked by weak C—H O hydrogen bonds between two methoxy groups into zigzag chains with R2
2(6)
graph-set motifs, which propagate along theb-axis direction. The [010] chains are stacked along theaaxis into corrugated sheets parallel to theabplane via weak–interactions with a
centroid-to-centroid distance of 3.8018 (6) A˚ (symmetry codes:x1,y,zandx+ 1,y,z) and slippage of 1.676 A˚ .
4. Hirshfeld surface analysis
The Hirshfeld surfaces mapped with normalized contact distancednormand the two-dimensional fingerprint plots for I
were generated usingCrystalExplorer17.5(Turneret al., 2017). The large and small red spots on the Hirshfeld surface mapped with dnorm (Fig. 3) correspond to the O2—H1O2 O1 and
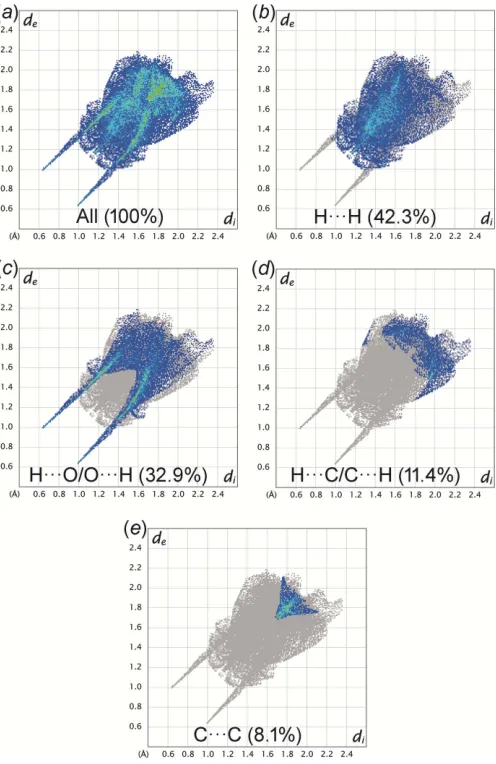
C8—H8A O3 hydrogen bonds, respectively. The H O distances are 1.09 and 0.16 A˚ shorter than the sum of van der Waals radii of H and O atoms (2.72 A˚ ). The H H contact is the most populated contact and contributes 42.3% of the total intermolecular contacts, followed by H O/O H (32.9%), H C/C H (11.4%) and C C (8.1%) contacts (Fig. 4). The tips of pseudo-mirrored sharp spikes at de + di ’ 1.6 A˚
represent the shortest H O/O H contacts, corresponding to the O2—H1O2 O1 hydrogen-bond. The absence of significant C—H interaction in the crystal structure of I
is indicated by the absence of characteristic ‘wings’ in the fingerprint plot of H C/C H contacts. The C C contacts include the weak–interaction, which appears as a unique ‘triangle’ focused atde’di’1.8 A˚ . The –interaction is
illustrated as a unique pattern of red and blue ‘triangles’ on the shape-index surface and a flat region on the curvedness surface of the phenyl ring (see supporting Figures S1 and S2).
5. Lattice energy calculation
The lattice energies of polymorphs Iand Iwere calculated usingPIXELsoftware (Gavezzotti, 2003) at default settings. The calculated lattice energy of I(107.5 kJ mol1) is larger than that of I (98.5 kJ mol1) and this comparison is in agreement with the report of Pereira Silva et al. (2015), in which Iis more stable than Iunder ambient conditions.
research communications
Acta Cryst.(2019). E75, 8–11 Chiaet al. C
[image:2.610.69.274.73.202.2]8H8O3
9
Figure 2
Partial crystal packing of I. Dashed lines represent the hydrogen-bonds. Hydrogen atoms not involved in hydrogen bonding are omitted for clarity.
Table 1
Hydrogen-bond geometry (A˚ ,).
D—H A D—H H A D A D—H A
O2—H1O2 O1i 1.008 (19) 1.626 (19) 2.6295 (9) 173.3 (17)
C8—H8A O3ii 0.98 2.56 3.4016 (11) 144
[image:2.610.45.295.573.706.2]Symmetry codes: (i)x;yþ2;zþ2; (ii)x;yþ1;zþ2.
Figure 3
The Hirshfeld surface mapped overdnormof the central molecule of I hydrogen bonded to two neighbouring molecules.
Figure 1
[image:2.610.315.565.653.712.2]6. Database survey
For the structure of 2-methoxybenzoic acid (refcodes FUFBOX and FUFBOX01, respectively), see: Parvez (1987) and Etteret al.(1988). For the structure of 4-methoxybenzoic acid (refcodes ANISIC, ANISIC01, ANISIC02 and ANISIC04, respectively), see: Bryan (1967), Colapietro & Domenicano (1978), Fausto et al.(1997) and Hathwar et al. (2011). For the previous structure of 3-methoxybenzoic acid (refcodes EFINEO and EFINEO01, respectively), see: Raffo et al.(2014) and Pereira Silvaet al.(2015).
7. Synthesis and crystallization
Single crystals of I were obtained from an unsuccessful attempt of co-crystallization between 3-methoxybenzoic acid and hexamethylenetetramine. Colourless plate-like crystals were obtained from slow evaporation of a methanolic mixture
of 3-methoxybenzoic acid and hexamethylenetetramine in equimolar ratio at room temperature.
8. Refinement
Crystal data, data collection and structure refinement details are summarized in Table 2. The O-bound H atom was located from the difference-Fourier map and refined freely [O2— H1O2 = 1.01 (2) A˚ ]. The remaining H atoms were positioned geometrically [C—H = 0.95 and 0.98 A˚ ] and refined using a riding model withUiso(H) = 1.2 or 1.5Ueq(C). A rotating group
model (AFIX 137) was applied to the methyl group.
Funding information
QAW thanks the Malaysian Government and USM for the award of the post of Research Officer under the Research University Individual Grant (1001/PFIZIK/8011080). HCK thanks the Malaysian Government for a MyBrain15 scholar-ship.
References
Bruker (2009). SADABS, APEX2 and SAINT. Bruker AXS Inc., Madison, Wisconsin, USA.
Bryan, R. F. (1967).J. Chem. Soc. B, pp. 1311–1316.
[image:3.610.48.296.70.452.2] [image:3.610.313.561.93.396.2]Colapietro, M. & Domenicano, A. (1978). Acta Cryst.B34, 3277– 3280.
Table 2
Experimental details.
Crystal data
Chemical formula C8H8O3
Mr 152.14
Crystal system, space group Monoclinic,P21/c
Temperature (K) 100
a,b,c(A˚ ) 3.8018 (4), 15.6027 (16), 11.9755 (12) (
) 90.889 (2)
V(A˚3) 710.28 (13)
Z 4
Radiation type MoK
(mm1) 0.11
Crystal size (mm) 0.560.220.12
Data collection
Diffractometer Bruker SMART APEXII DUO
CCD
Absorption correction Multi-scan (SADABS; Bruker, 2009)
Tmin,Tmax 0.881, 0.987
No. of measured, independent and observed [I> 2(I)] reflections
9395, 2550, 2049
Rint 0.023
(sin/)max(A˚
1) 0.758
Refinement
R[F2> 2(F2)],wR(F2),S 0.038, 0.113, 1.04
No. of reflections 2550
No. of parameters 105
H-atom treatment H atoms treated by a mixture of independent and constrained refinement
max, min(e A˚
3) 0.40,0.27
Computer programs:APEX2andSAINT(Bruker, 2009),SHELXS2013andSHELXTL (Sheldrick, 2008),SHELXL2014(Sheldrick, 2015),PLATON(Spek, 2009) andpublCIF (Westrip, 2010).
Figure 4
The two-dimensional fingerprint plots of Ifor different intermolecular contacts giving their percentages of contribution to the Hirshfeld surface.
Etter, M. C., Urban´czyk-Lipkowska, Z., Fish, P. A., Panunto, T. W., Baures, P. W. & Frye, J. S. (1988).J. Crystallogr. Spectrosc. Res.18, 311–325.
Fausto, R., Matos-Beja, A. & Paixa˜o, J. A. (1997).J. Mol. Struct.435, 207–218.
Gavezzotti, A. (2003).J. Phys. Chem. B,107, 2344–2353.
Groom, C. R., Bruno, I. J., Lightfoot, M. P. & Ward, S. C. (2016).Acta Cryst.B72, 171–179.
Hathwar, V. R., Thakur, T. S., Row, T. N. G. & Desiraju, G. R. (2011).
Cryst. Growth Des.11, 616–623.
Parvez, M. (1987).Acta Cryst.C43, 2243–2245.
Pereira Silva, P. S., Castro, R. A. E., Melro, E., Silva, M. R., Maria, T. M. R., Canotilho, J. & Euse´bio, M. E. S. (2015).J. Therm. Anal. Calorim.120, 667–677.
Raffo, P. A., Rossi, L., Albore´s, P., Baggio, R. F. & Cukiernik, F. D. (2014).J. Mol. Struct.1070, 86–93.
Sheldrick, G. M. (2008).Acta Cryst.A64, 112–122. Sheldrick, G. M. (2015).Acta Cryst.C71, 3–8. Spek, A. L. (2009).Acta Cryst.D65, 148–155.
Turner, M. J., McKinnon, J. J., Wolff, S. K., Grimwood, D. J., Spackman, P. R., Jayatilaka, D. & Spackman, M. A. (2017).
CrystalExplorer17. University of Western Australia. Westrip, S. P. (2010).J. Appl. Cryst.43, 920–925.
research communications
Acta Cryst.(2019). E75, 8–11 Chiaet al. C
sup-1
Acta Cryst. (2019). E75, 8-11
supporting information
Acta Cryst. (2019). E75, 8-11 [https://doi.org/10.1107/S2056989018016900]
Crystal structure of a second monoclinic polymorph of 3-methoxybenzoic acid
with
Z
′
= 1
Tze Shyang Chia, Huey Chong Kwong, Qin Ai Wong, Ching Kheng Quah and Md. Azharul
Arafath
Computing details
Data collection: APEX2 (Bruker, 2009); cell refinement: SAINT (Bruker, 2009); data reduction: SAINT (Bruker, 2009);
program(s) used to solve structure: SHELXS2013 (Sheldrick, 2008); program(s) used to refine structure: SHELXL2014
(Sheldrick, 2015); molecular graphics: SHELXTL (Sheldrick, 2008); software used to prepare material for publication:
PLATON (Spek, 2009) and publCIF (Westrip, 2010).
3-Methoxybenzoic acid
Crystal data
C8H8O3
Mr = 152.14 Monoclinic, P21/c
a = 3.8018 (4) Å b = 15.6027 (16) Å c = 11.9755 (12) Å β = 90.889 (2)° V = 710.28 (13) Å3
Z = 4
F(000) = 320 Dx = 1.423 Mg m−3
Mo Kα radiation, λ = 0.71073 Å Cell parameters from 3889 reflections θ = 2.6–32.4°
µ = 0.11 mm−1
T = 100 K Plate, colourless 0.56 × 0.22 × 0.12 mm
Data collection
Bruker SMART APEXII DUO CCD diffractometer
Radiation source: fine-focus sealed tube Graphite monochromator
φ and ω scans
Absorption correction: multi-scan
(SADABS; Bruker, 2009)
Tmin = 0.881, Tmax = 0.987
9395 measured reflections 2550 independent reflections 2049 reflections with I > 2σ(I) Rint = 0.023
θmax = 32.6°, θmin = 2.1°
h = −5→5 k = −21→23 l = −18→17
Refinement
Refinement on F2
Least-squares matrix: full R[F2 > 2σ(F2)] = 0.038
wR(F2) = 0.113
S = 1.04 2550 reflections 105 parameters 0 restraints
Primary atom site location: structure-invariant direct methods
Hydrogen site location: mixed
H atoms treated by a mixture of independent and constrained refinement
w = 1/[σ2(F
o2) + (0.0616P)2 + 0.1229P]
where P = (Fo2 + 2Fc2)/3
supporting information
sup-2
Acta Cryst. (2019). E75, 8-11
Δρmax = 0.40 e Å−3 Δρmin = −0.27 e Å−3
Special details
Geometry. All esds (except the esd in the dihedral angle between two l.s. planes) are estimated using the full covariance matrix. The cell esds are taken into account individually in the estimation of esds in distances, angles and torsion angles; correlations between esds in cell parameters are only used when they are defined by crystal symmetry. An approximate (isotropic) treatment of cell esds is used for estimating esds involving l.s. planes.
Fractional atomic coordinates and isotropic or equivalent isotropic displacement parameters (Å2)
x y z Uiso*/Ueq
O1 0.20200 (18) 0.96657 (4) 0.88546 (5) 0.02247 (16) O2 −0.04494 (18) 0.88699 (4) 1.01876 (5) 0.02142 (16) H1O2 −0.091 (5) 0.9451 (12) 1.0523 (16) 0.068 (5)* O3 0.17686 (17) 0.58676 (4) 0.92170 (5) 0.01959 (15) C1 0.2204 (2) 0.81461 (6) 0.86862 (7) 0.01512 (16) C2 0.1573 (2) 0.73618 (6) 0.91952 (7) 0.01515 (16) H2A 0.0504 0.7341 0.9906 0.018* C3 0.2516 (2) 0.66069 (5) 0.86565 (7) 0.01517 (16) C4 0.4082 (2) 0.66360 (6) 0.76109 (7) 0.01698 (17) H4A 0.4738 0.6121 0.7245 0.020* C5 0.4674 (2) 0.74261 (6) 0.71099 (7) 0.01847 (18) H5A 0.5727 0.7447 0.6396 0.022* C6 0.3755 (2) 0.81821 (6) 0.76329 (7) 0.01759 (17) H6A 0.4169 0.8718 0.7283 0.021* C7 0.1244 (2) 0.89573 (6) 0.92491 (7) 0.01636 (17) C8 0.2877 (2) 0.50822 (6) 0.87173 (7) 0.01985 (18) H8A 0.2229 0.4601 0.9198 0.030* H8B 0.5434 0.5091 0.8628 0.030* H8C 0.1726 0.5017 0.7984 0.030*
Atomic displacement parameters (Å2)
U11 U22 U33 U12 U13 U23
sup-3
Acta Cryst. (2019). E75, 8-11
Geometric parameters (Å, º)
O1—C7 1.2394 (10) C3—C4 1.3956 (12) O2—C7 1.3110 (10) C4—C5 1.3909 (12) O2—H1O2 1.01 (2) C4—H4A 0.9500 O3—C3 1.3666 (10) C5—C6 1.3829 (12) O3—C8 1.4301 (10) C5—H5A 0.9500 C1—C2 1.3896 (12) C6—H6A 0.9500 C1—C6 1.4019 (11) C8—H8A 0.9800 C1—C7 1.4823 (12) C8—H8B 0.9800 C2—C3 1.3925 (12) C8—H8C 0.9800 C2—H2A 0.9500
C7—O2—H1O2 109.8 (11) C6—C5—H5A 119.4 C3—O3—C8 116.94 (7) C4—C5—H5A 119.4 C2—C1—C6 120.52 (8) C5—C6—C1 119.09 (8) C2—C1—C7 120.47 (7) C5—C6—H6A 120.5 C6—C1—C7 119.01 (8) C1—C6—H6A 120.5 C1—C2—C3 119.62 (7) O1—C7—O2 122.85 (8) C1—C2—H2A 120.2 O1—C7—C1 121.76 (7) C3—C2—H2A 120.2 O2—C7—C1 115.39 (7) O3—C3—C2 115.43 (7) O3—C8—H8A 109.5 O3—C3—C4 124.26 (7) O3—C8—H8B 109.5 C2—C3—C4 120.31 (8) H8A—C8—H8B 109.5 C5—C4—C3 119.34 (8) O3—C8—H8C 109.5 C5—C4—H4A 120.3 H8A—C8—H8C 109.5 C3—C4—H4A 120.3 H8B—C8—H8C 109.5 C6—C5—C4 121.13 (8)
Hydrogen-bond geometry (Å, º)
D—H···A D—H H···A D···A D—H···A
O2—H1O2···O1i 1.008 (19) 1.626 (19) 2.6295 (9) 173.3 (17)
C8—H8A···O3ii 0.98 2.56 3.4016 (11) 144