JOURNAL OF FOREST SCIENCE, 59, 2013 (4): 137–149
Birch (Betula papyrifera)
×
white spruce (Picea glauca)
interactions in mixedwood stands: implications
for management
Ch.D.B. Hawkins
1,2, A. Dhar
11Mixedwood Ecology and Management Program, University of Northern British Columbia, Prince George, Canada
2Yukon College, Yukon Research Centre, Whitehorse, Canada
ABSTRACT: Current British Columbia forest regulations drive the regeneration management towards pure conifer stands rather than remaining in a mixed-species condition. This approach may result in unnecessary vegetation con-trol. The main objective of this investigation was to study the impact of variable paper birch densities on white spruce growth in 15–20 years old stands for management implications. Regression analysis was used to examine the effect of birch density and two competition indices to predict spruce growth. A mixed model ANOVA showed that spruce mean annual DBH and basal area increment differed significantly among sites and density. From the regression analysis it appears that birch density up to 4,000 stems·ha–1 had no significant influence on spruce growth which is much higher than the current BC reforestation guideline (1,000 stems·ha–1 broadleaves). Similarly, birch relative density index (RDI) had to exceed 3 to affect spruce DBH growth significantly on all sites except one. On most sites, spruce had a larger DBH than birch. Our results also suggest that rather than following the current broadcast approach to vegetation management, a targeted approach could enhance forest productivity and stand diversity.
Keywords: boreal forest; competition; mean annual DBH growth; productivity; relative density index (RDI); vegeta-tion management
Generally conifer plantations are regularly man-aged by removing competing broadleaf trees to increase productivity and meet reforestation re-quirements in northern temperate forests as mixed species management was historically associated with lower stand yields (Leiffers et al. 1996; Rothe, Binkley 2001). Moreover, conifer productivity has been shown to increase, following complete removal of broadleaves from the forest (Simard et al. 2001). As a result, intensive broadleaf control has been jus-tified to enhance conifer productivity (Lavender et al. 1990; Wagner et al. 2005) but there are increas-ing concerns about the associated costs to forest health, timber production and detrimental effects on biodiversity (Simard et al. 2005; Kelty 2006). It was shown by different investigations that removal of broadleaves increased the rate of disease and
in-sect infestations among residual conifers (Taylor et al. 1994; Simard et al. 2001; Hawkins et al. 2012a) as well as reduced the habitat quality for cavity nest-ing birds (Aitken et al. 2002). In addition, exten-sive removal of broadleaf species has the potential to reduce the diversity of stand types in semi-natural landscapes, where the landscape should include a mosaic of managed pure conifer and mixed conifer-broadleaf plantations (Lautenschlager 2000). Si-mard et al. (2005), Paquette and Messier (2011) and Hawkins et al. (2012a) suggested that yields may be greater in mixed species stands than in pure stands while Frivold and Frank (2002) and Fahlvik et al. (2005) reported that the effect of tree mixture on yield is unclear.
single species (monoculture) stands: facilitation and complementary resource use (Kelty 2006). Facilitative interactions occur when one species directly benefits from another: e.g. N fixing tree species [Alnus rubra Bong. and Pseudotsuga
men-ziesii (Mirb.) Franco] (Binkley 2003). Species
that differ in shade tolerance, height growth rates, crown structure, phenology and rooting depth are described as having complementary resource use (Haggar, Ewell 1997) or competitive production (Vandermeer 1989). Species with complementary characteristics have lower rates of interspecific competition than rates of intraspecific competition (Haggar, Ewell 1997; Kelty 2006). Picea–Betu-la mixtures common to Scandinavia are a good example of managing mixed species with comple-mentary growth characteristics (Bergqvist 1999; Frivold, Frank 2002).
For stands with complementary growth charac-teristics, density measures such as stand density index (SDI) (Reineke 1933) and relative density in-dex (RDI) (Curtis 1982) are widely used in forest research (Torres-Rojo, Martínez 2000; Ducey, Knapp 2010). The relative density index (RDI) is often used to determine the growth of trees (Du-cey, Larson 2003). Indices based on density and size relationships provide better prediction about competition as they are independent of site qual-ity and stand age (Curtis 1970; Long 1985). How-ever, competition mechanisms between conifers and broadleaves are a continuous process and may change over time due to the alteration of stand structure and species composition (Burton 1993; Newton, Jolliffe 1998).
The main objective of this investigation was to increase our level of understanding about the dy-namic interactions between conifer crop trees
[spruce: Picea glauca (Moench) Voss] and associ-ated broadleaf competition (paper birch: Betula papyrifera Marsh) in mixedwood boreal stands of northern British Columbia. Specific objectives of the study were: (1) to quantify and compare the ef-fects of birch competition on spruce performance across a range of birch densities; and (2) to identify densities that are deleterious to spruce growth.
MATERIAL AND METHODS
Site description
[image:2.595.63.535.572.725.2]The study sites are located in the Fort Nel-son forest district of north-eastern BC between 122°16' to 123°49'W, and 58°19' to 59°26'N (Ta-ble 1). The biogeoclimatic zone of the study sites is moist, warm subzone of the boreal white and black spruce (BWBSmw2) (DeLong et al. 1991). Soils are well-poorly drained with a wide range of soil types Cumulic Regosols, Organic Cryosols and Lu-vic Gleysols. All 12 months of the year may experi-ence snow, but the wettest period is between May and September. Annual precipitation ranges from 330 to 570 mm and about one-third falls as snow. The mean annual temperature is –1.4°C with ex-tremes of –51.7 to 36.7°C and an average frost free period of 106 days (DeLong et al. 1991). The zone is dominated by extensive mixed broadleaf and coniferous forests, and mature coniferous forests. The major tree species in this area are white spruce [Picea mariana (Mill.) Britton, Sterns and Poggen-burg], lodgepole pine [Pinus contorta (Douglas)], subalpine fir [Abies lasiocarpa (Hooker) Nuttall], paper birch and balsam poplar [Populus balsami-fera L.]
Table 1. Stand and site history of the sample locations
Site Latitude (N) Longitude (W) applicationHerbicide establishmentYear of plot Stand age at plot establishment* re-measuredPlot (SISIBEC
50)**
Total plot No. Raspberry
Creek 11 59°26' 123°28' 1991 2004 15 2007 19.9 129
Beaver Lake 59°02' 123°19' 1991 2004 15 2007 15.0 84
Raspberry
Creek 12 58°28' 123°49' 1991 2004 15 2009 19.9 77
Klua Creek 58°37' 122°43' 1996 2005 11 2009 12.0 60
Profit River 58°19' 122°16' 1993 2007 16 2009 15.0 72
Luyben 59°07' 123°24' 1995 2005 12 2008 15.0 76
Sampling design
The stands used in this study have at least five hectares planted with spruce, as well as a signifi-cant number of paper birches where white spruce was the target crop species (Table 1). In total six stands were measured: three stands in 2004 (Rasp-berry Creek 11, Rasp(Rasp-berry Creek 12, and Beaver Lake), two stands in 2005 (Luyben and Klua Creek) and one stand in 2007 (Profit River). Detail stand establishment height and size distribution is also presented in Table 2. All stands were subjected to an aerial application of the herbicide glyphosate (6 l·ha–1, Vision – contains about 35.6% glyphosate)
approximately two years post planting, as a means of early vegetation control.
Single tree temporary sample plots (TSP) were established using the nearest individual method de-scribed in Kent and Coker (1992). A systematic GPS grid point was established for each stand in a 100-m interval. Plot location was determined by proceeding along a bearing for a fixed distance to the GPS grid point: if in a mixedwood area, a ran-dom bearing was taken from this point and the first spruce encountered was deemed the target tree and TSP centre of a 1.78 m radius (10 m2) plot. Selection
of a target tree was repeated up to three times at a grid point: bearings were at 90° to each other. Target trees were selected according to predetermined cri-teria which required them to be free of defects and be taller than 1.3 m. Defects may have been induced by pathogens or insects and the reduced growth po-tential would not be due to interspecific competition (stand density). The target crop tree (spruce) and all birches taller than 1.3 m were measured in each plot (10 m2). In total, 9 different birch density classes
(1,000; 2,000; 3,000; 4,000; 5,000; 6,000; 7,000 and ≥ 8,000 stems·ha–1) including a control (no birch)
were used to examine the impact of birch on spruce growth. Total height, height to live crown, crown
width, DBH, and age (whorl counts for young trees and tree cores for older ones) for spruce were re-corded whereas for birch only height and DBH were recorded. In total 498 TSP were installed across the six stands for continuous monitoring. All six stands were re-measured at least once (Table 1). All mea-surements were conducted at the end of growing season between October and March and each site was re-measured at 2 to 4 year intervals (Table 1).
Stand competition indices
In addition to determining the plot density (stems·ha–1), relative density index (RDI)
(Cur-tis 1982) and stand density index (SDI) (Reineke 1933; Long 1985) were calculated at the time of plot establishment and with each re-measurement. Only birch density was used to calculate the SDI and RDI. The following formula was used to calcu-late the birch relative density index (RDI):
(1)
where:
BA – basal area (m2·ha–1),
QMD – quadratic mean diameter (cm),
0.5 – a single slope coefficient from Curtis (1982). There was a strong positive correlation be-tween SDI and RDI when all sites were combined (r2 = 0.9900, F = 48096.817, P < 0.001, n = 486). As
a result, only RDI was used to describe the birch spruce interaction in this paper.
Statistical analyses
All analyses were conducted using the statistical package SYSTAT version 12®. Mixed model ANOVA
5 . 0
) (QMD
[image:3.595.63.534.603.757.2]BA RDI
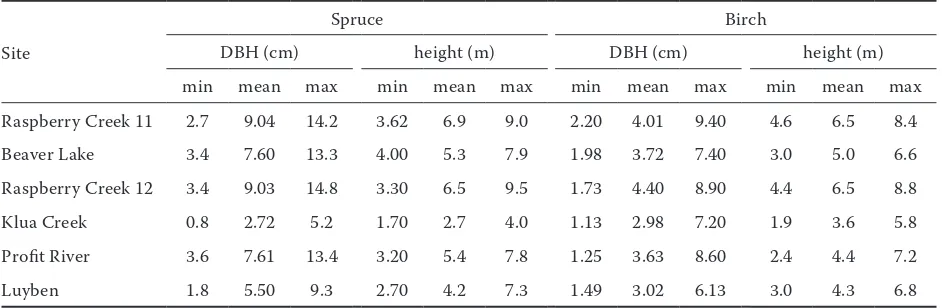
Table 2. Stand DBH distribution of different locations
Site
Spruce Birch
DBH (cm) height (m) DBH (cm) height (m)
min mean max min mean max min mean max min mean max Raspberry Creek 11 2.7 9.04 14.2 3.62 6.9 9.0 2.20 4.01 9.40 4.6 6.5 8.4 Beaver Lake 3.4 7.60 13.3 4.00 5.3 7.9 1.98 3.72 7.40 3.0 5.0 6.6 Raspberry Creek 12 3.4 9.03 14.8 3.30 6.5 9.5 1.73 4.40 8.90 4.4 6.5 8.8 Klua Creek 0.8 2.72 5.2 1.70 2.7 4.0 1.13 2.98 7.20 1.9 3.6 5.8 Profit River 3.6 7.61 13.4 3.20 5.4 7.8 1.25 3.63 8.60 2.4 4.4 7.2
was used to determine the effect of different birch densities on spruce growth. Plot layout for each site was modelled as a randomized complete block de-sign where different sites acted as blocks and each of the blocks was treated as a random factor in the ANOVA. Least-squares means were calculated in the mixed model analysis for each density class (av-eraged over sites) and for each site (av(av-eraged over density classes). The general tests for normality of data distribution were also carried out within the statistical analysis process.
The further analysis was conducted using sim-ple regression that integrated competition indices (independent variables) to spruce size (DBH) and mean annual DBH growth (dependent variables). We did not use multiple regression because: (a) dif-ferent studies have revealed that a consistent model is not applicable to all sites (Brand 1986; Simard 1990), and (b) it also showed limited values in an earlier study (Simard 1990). The impact level of birch density and RDI were identified when the re-gression analysis changed from significant to non-significant in relation to impact on spruce annual DBH and height increment at each site. The impact levels were identified using a ceiling function which described the upper boundary of the data and en-veloped at least 95% of the observations (Burton 1993). However, in this investigation only diameter was considered to describe the impact of broadleaf on target tree (spruce) growth performance. The reasons why diameter was considered instead of height to explain birch-spruce competition are as follows: it is an easily measurable integrative index of tree physiological responses to environmental variation (Misson et al. 2003) and the first energy sink to be abandoned when growth is challenged (Oliver, Larson 1996). Moreover Mitchell (2003) and Newsome et al. (2010) reported that diameter is an excellent response variable for com-petition studies because interspecific comcom-petition affects diameter growth more than it affects height growth. In many investigations (DeLong 1991; Si-mard et al. 2001; Newsome et al. 2008) it was
re-ported that diameter responds more quickly than height to external sources whereas height respons-es tend not to be exprrespons-essed until conifers are expe-riencing extreme stress and low vigour. The most appropriate functional forms between the response variables and each competition index were identi-fied according to Simard et al. (2004).
RESULTS
Effect of site and age on spruce growth
From the mixed model ANOVA sites (random effect) were significant (P ≤ 0.05) at trial establish-ment for spruce and birch DBH, height, basal area (Table 3). Spruce mean annual DBH and basal area increment also differed significantly among sites. However, density (fixed effect) was significant for all birch and spruce variables except spruce height (Table 3). Moreover, when the effect of stand age on birch spruce competitive interaction was inves-tigated, spruce mean annual DBH growth showed a significant (P = 0.003) difference among ages, younger age stands (15 years in the last re-mea-surement) having lower mean annual DBH growth (0.75 cm·yr–1) than 18 years old stands (0.87 cm·yr–1)
and 20 years old stands (0.95 cm·yr–1).
Effect of birch density on spruce growth
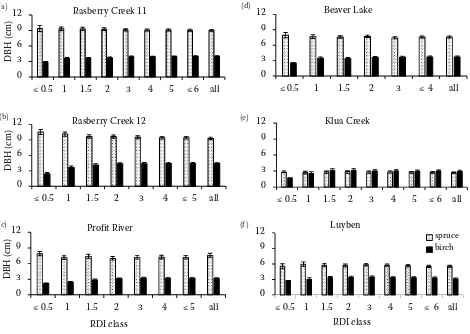
Birch and spruce DBH decreased slightly with in-creasing stand density from 1,000 to 5,000 stems·ha–1
(Fig. 1). In most cases, spruce DBH was greater than birch DBH except for the Klua site, where birch DBH was larger. Considering establishment height, spruce was taller than birch at four sites: Raspberry Creek 11 (RC11), Raspberry Creek 12 (RC12), Bea-ver and Profit whereas at Luyben site birch height was marginally taller than spruce height while at Klua site birch was much taller than spruce (Ta-ble 4). Regression analysis of spruce DBH at plot
es-Table 3. P-values for ANOVA tests of different birch densities and site effects on spruce and birch attributes. Site is treated as a random effect
Factor Spruce at establishment Birch at establishment Spruce mean annual increment height (m) DBH (cm) BA (m2·ha–1) height (m) DBH (cm) BA (m2·ha–1) DBH (cm) BA (m2·ha–1) Site < 0.001 < 0.001 < 0.001 0.038 < 0.001 0.004 0.005 < 0.001 Density 0.164 < 0.001 0.004 < 0.001 < 0.001 < 0.001 0.011 0.004
[image:4.595.64.530.668.737.2]tablishment was not significantly impacted by birch density at Beaver and Luyben sites whereas spruce DBH was significantly impacted by all birch
densi-ties except 4,000 stems·ha–1 at RC12 site (Table 5).
The Kula, Profit and RC11 sites had different birch density of 6,000; 5,000 and 4,000 stems·ha–1, respec-Fig. 1. Mean spruce and birch DBH (± SEM) at plot establishment (first measurement) by birch density (stems·ha–1)
[image:5.595.65.537.56.389.2]classes at different sites
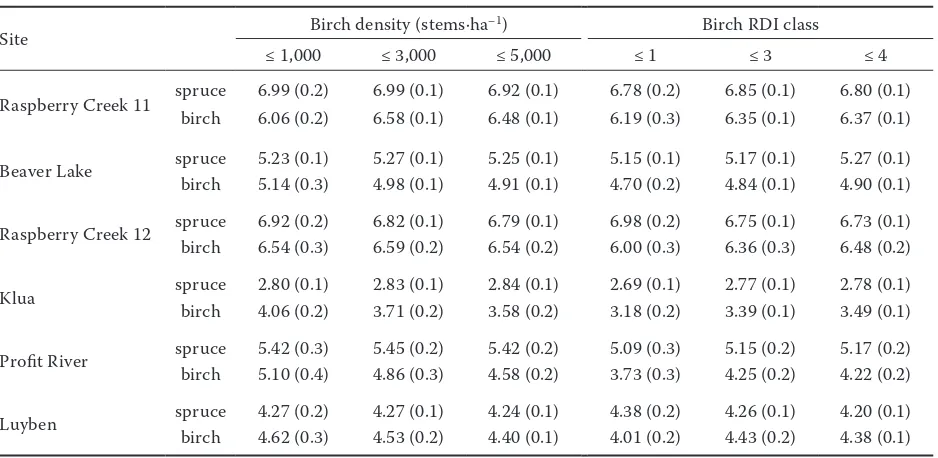
Table 4. Mean (± SEM) spruce and birch establishment (first measurement) height (m) at different density and relative density index (RDI) classes at the six sites
Site Birch density (stems·ha–1) Birch RDI class
≤ 1,000 ≤ 3,000 ≤ 5,000 ≤ 1 ≤ 3 ≤ 4
Raspberry Creek 11 spruce 6.99 (0.2) 6.99 (0.1) 6.92 (0.1) 6.78 (0.2) 6.85 (0.1) 6.80 (0.1) birch 6.06 (0.2) 6.58 (0.1) 6.48 (0.1) 6.19 (0.3) 6.35 (0.1) 6.37 (0.1)
Beaver Lake spruce 5.23 (0.1) 5.27 (0.1) 5.25 (0.1) 5.15 (0.1) 5.17 (0.1) 5.27 (0.1) birch 5.14 (0.3) 4.98 (0.1) 4.91 (0.1) 4.70 (0.2) 4.84 (0.1) 4.90 (0.1)
Raspberry Creek 12 sprucebirch 6.92 (0.2)6.54 (0.3) 6.82 (0.1)6.59 (0.2) 6.79 (0.1)6.54 (0.2) 6.98 (0.2)6.00 (0.3) 6.75 (0.1)6.36 (0.3) 6.73 (0.1)6.48 (0.2)
Klua spruce 2.80 (0.1) 2.83 (0.1) 2.84 (0.1) 2.69 (0.1) 2.77 (0.1) 2.78 (0.1) birch 4.06 (0.2) 3.71 (0.2) 3.58 (0.2) 3.18 (0.2) 3.39 (0.1) 3.49 (0.1)
Profit River spruce 5.42 (0.3) 5.45 (0.2) 5.42 (0.2) 5.09 (0.3) 5.15 (0.2) 5.17 (0.2) birch 5.10 (0.4) 4.86 (0.3) 4.58 (0.2) 3.73 (0.3) 4.25 (0.2) 4.22 (0.2)
Luyben spruce 4.27 (0.2) 4.27 (0.1) 4.24 (0.1) 4.38 (0.2) 4.26 (0.1) 4.20 (0.1) birch 4.62 (0.3) 4.53 (0.2) 4.40 (0.1) 4.01 (0.2) 4.43 (0.2) 4.38 (0.1)
Figure 1 Mean spruce and birch DBH (± SEM) at plot establishment establishment (first measurement) by birch densi
(a) (b)
(c) (d)
(e) (f)
0 3 6 9 12
0 1 2 3 4 5 6 7 ≤ 8 all
D
BH
(cm
)
Birch density (stems·ha—1)
Luyben spruce
birch
0 3 6 9 12
0 1 2 3 4 5 6 7 ≤ 8 all
D
BH
(cm
) Klua Creek
0 3 6 9 12
0 1 2 3 4 5 6 ≤ 7 all
D
BH
(cm
)
Beaver Lake
0 3 6 9 12
0 1 2 3 4 5 ≤ 6 all
D
BH
(cm
) Rasberry Creek 12
0 3 6 9 12
0 1 2 3 4 5 6 7 ≤ 8 all
D
BH
(cm
)
Birch density (stems·ha—1)
Profit River 0
3 6 9 12
0 1 2 3 4 5 6 7 ≤ 8 all
D
BH
(cm
) Rasberry Creek 11
(b)
(d)
(c)
(e)
[image:5.595.64.533.528.757.2]Table 5. Regression of establishment spruce DBH (cm) against different density (stems·ha–1) classes at the six sites
Site Density class r2 F P Equation
Raspberry Creek 11
all 0.0476 7.3454 0.008 DBH = 9.6005 – 0.00018 × stems·ha–1, n = 128 ≤ 5,000 0.0554 7.0981 0.009 DBH = 9.9649 – 0.00035 × stems·ha–1, n = 107 ≤ 4,000 0.0271 3.6984 0.0592 DBH = 9.9292 – 0.00032 × stems·ha–1, n = 96
Beaver Lake all 0.0000 0.6628 0.418 DBH = 7.7763 – 0.000069 × stems·ha–1, n = 78 ≤ 5,000 0.0000 0.9869 0.324 DBH = 7.8822 – 0.000151 × stems·ha–1, n = 68
Raspberry Creek 12
all 0.2026 19.5431 < 0.001 DBH = 10.0411 – 0.00035 × stems·ha–1, n = 74 ≤ 5,000 0.0759 6.4214 0.014 DBH = 10.1879 – 0.00043 × stems·ha–1, n = 67 ≤ 4,000 0.0402 3.5978 0.063 DBH = 10.1697 – 0.00041 × stems·ha–1, n = 63 ≤ 3,000 0.1781 13.3501 < 0.001 DBH = 10.5501 – 0.00095 × stems·ha–1, n = 58
Klua Creek all 0.1231 9.2796 0.003 DBH = 3.0526 – 0.000063 × stems·ha–1, n = 60 ≤ 6,000 0.0000 0.3151 0.577 DBH = 3.0456 – 0.000045 × stems·ha–1, n = 41
Profit River all 0.0757 6.8103 0.011 DBH = 8.9825 – 0.00026 × stems·ha
–1, n = 72
≤ 5,000 0.0467 3.3538 0.073 DBH = 8.8273 – 0.00037 × stems·ha–1, n = 49
Luyben all 0.0000 0.7863 0.378 DBH = 5.7047 – 0.000035 × stems·ha–1, n = 68 ≤ 6,000 0.0000 0.0608 0.806 DBH = 5.8230 – 0.000029 × stems·ha–1, n = 49
in bold – significant at α = 0.05 when the regression changes from significant to non-significant
Fig. 2. Mean spruce and birch DBH (± SEM) at plot establishment by birch relative density index (RDI) classes at different sites
0 3 6 9 12
≤ 0.5 1 1.5 2 3 4 5 ≤ 6 all
DBH (cm)
RDI class Luyben
spruce birch
(f) 0 3 6 9 12
≤ 0.5 1 1.5 2 3 4 5 ≤ 6 all
DBH (cm)
Klua Creek (e)
0 3 6 9 12
≤ 0.5 1 1.5 2 3 ≤ 4 all
DBH (cm)
Beaver Lake (d)
0 3 6 9 12
≤ 0.5 1 1.5 2 3 4 5 ≤ 6 all
DBH (cm)
Rasberry Creek 11 (a)
0 3 6 9 12
≤ 0.5 1 1.5 2 3 4 ≤ 5 all
DBH (cm)
Rasberry Creek 12 (b)
0 3 6 9 12
≤ 0.5 1 1.5 2 3 4 ≤ 5 all
DBH (cm)
Profit River (c)
RDI class
(a)
(c) (b)
(d)
(e)
[image:6.595.65.535.389.723.2]tively, which did not significantly affect the spruce establishment DBH. This implies that below these levels trial establishment DBH had not been affected by birch competition (Table 5). Birch RDI did not significantly affect spruce establishment DBH at two
[image:7.595.61.531.72.357.2]sites RC11 and Klua; whereas it was significantly impacted by all RDI classes at RC12 site (Table 6). While at Beaver Profit and Luyben sites, RDI classes up to ≤ 3, ≤ 4 and ≤ 6 had no significant effect on spruce establishment DBH (Table 6).
Table 6. Regression of establishment spruce DBH (cm) against relative density index (RDI) classes at the six sites
Site RDI class r2 F P Equation
Raspberry
Creek 11 ≤ 5all 0.00390.004 1.4681.398 0.2280.240 DBH = 9.2943 – 0.11115 × RDI, DBH = 9.3691 – 0.10299 × RDI, nn = 128 = 107
Beaver Lake
all 0.0000 0.0102 0.9199 DBH = 7.6204 – 0.01561 × RDI, n = 78 ≤ 3 0.0444 4.0630 0.0480 DBH = 8.0054 – 0.48827 × RDI, n = 67 ≤ 2 0.0000 0.0894 0.7661 DBH = 7.8103 – 0.10870 × RDI, n = 55
Raspberry Creek 12
all 0.1144 10.5581 0.0018 DBH = 9.9249 – 0.35227 × RDI, n = 75 ≤ 5 0.0526 4.8835 0.0304 DBH = 9.9907 – 0.39846 × RDI, n = 71 ≤ 2 0.1167 7.4704 0.0088 DBH = 10.422 – 1.23046 × RDI, n = 50 ≤ 1 0.1383 6.1366 0.0189 DBH = 10.732 – 2.64170 × RDI, n = 33
Klua Creek all 0.0305 2.8555 0.0964 DBH = 2.9201 – 0.09036 × RDI, n = 60 ≤ 6 0.0107 1.5821 0.2140 DBH = 2.9478 – 0.10727 × RDI, n = 55
Profit River
all 0.02076 2.67467 0.10599 DBH = 6.80375 + 0.23984 × RDI, n = 80 ≤ 4 0.0581 4.0868 0.0487 DBH = 5.59262 + 0.71877 × RDI, n = 51 ≤ 3 0.0492 3.1758 0.0821 DBH = 5.49744 + 0.76737 × RDI, n = 43
Luyben
all 0.0000 0.1089 0.7424 DBH = 5.5948 – 0.01377 × RDI, n = 68 ≤ 8 0.0518 4.0588 0.0488 DBH = 5.9866 – 0.19724 × RDI, n = 57 ≤ 6 0.0043 1.2022 0.2786 DBH = 5.9789 – 0.18691 × RDI, n = 48
in bold – significant atα = 0.05 when the regression changes from significant to non-significant
Table 7. Regressions of mean annual spruce DBH (cm) growth against density (stems·ha–1) classes at the six sites
Site Density class r2 F P Equation
Raspberry Creek 11
all 0.1228 10.5185 0.0018 DBH = 1.0303 – 0.000043 ×stems·ha–1, n = 69 ≤ 5,000 0.1043 8.2178 0.0057 DBH = 1.0463 – 0.000054 ×stems·ha–1, n = 56 ≤ 4,000 0.03325 2.6852 0.1078 DBH = 1.0478 – 0.000054 ×stems·ha–1, n = 50
Beaver Lake all 0.0929 6.5302 0.0135 DBH = 1.1307 – 0.000032 ×stems·ha–1, n = 55 ≤ 5,000 0.0204 1.9594 0.1684 DBH = 1.1395 – 0.000037 ×stems·ha–1, n = 47 Raspberry
Creek 12 all 0.1392 8.2790 0.0062 DBH = 1.0247 – 0.000052 ×stems ha
–1, n = 65 ≤ 4,000 0.0563 3.6232 0.0637 DBH = 1.0265 – 0.000053 ×stems·ha–1, n = 45
Klua Creek
all 0.3318 23.3473 < 0.0001 DBH = 0.9145 – 0.000024 ×stems·ha–1, n = 46 ≤ 5,000 0.1078 4.3823 0.0458 DBH = 0.9821 – 0.000050 ×stems·ha–1, n = 29 ≤ 4,000 0.0814 3.3029 0.0812 DBH = 0.9901 – 0.000058 ×stems·ha–1, n = 27
Profit River ≤ 5,000all 0.230720.11890 21.994766.39793 < 0.00010.21558 DBH = 0.98239 – 0.000072 ×DBH = 0.96239 – 0.000063 ×stems·hastems·ha––11, , nn = 71 = 41
Luyben all 0.0789 5.1958 0.0271 DBH = 0.7957 – 0.000013 ×stems·ha–1, n = 50 ≤ 8,000 0.0668 3.7214 0.0614 DBH = 0.8225 – 0.000027 ×stems·ha–1, n = 39
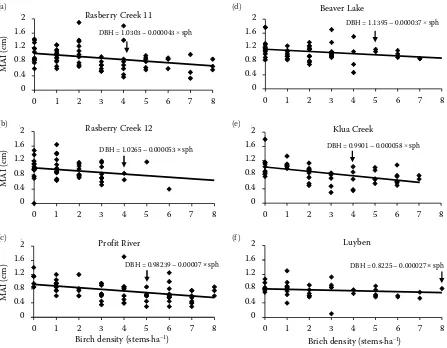
[image:7.595.59.533.501.736.2]The effect of birch density and RDI on mean an-nual DBH growth showed diverse responses among the different sites (Figs. 3 and 4, Tables 6 and 7). The impact of birch density on spruce mean an-nual DBH growth was not significant up to a birch density of 8,000 stems·ha–1 at Luyben site, which
was followed by Beaver and Profit sites (5,000 stems·ha–1) while at RC11, RC12 and Klua sites the
density was 4,000 stems·ha–1 (Table 7). On the
oth-er hand birch RDI class up to ≤ 5 had no significant effect on spruce mean annual growth at Profit site, which was followed by RC12 and Luyben (RDI ≤ 4), Beaver and RC11 (RDI ≤ 3). However, the lowest RDI class ≤ 2, which did not significantly affect spruce mean annual growth, was observed at Kula site (Table 8).
DISCUSSION
Based on our study it was observed that the in-tensity of tree neighbour competition on target
co-nifers differed considerably among sites (Table 3) and stand age, which reflects the dynamic nature of seral mixed forests (Simard et al. 2004). As mean annual DBH growth and mean basal area varied significantly among the sites and competing densi-ties, it is difficult to accurately predict tree growth rate at a given neighbourhood competition level. Other studies also suggested that variation in tree growth at a given site can result from many factors other than competition such as genetics (Clair, Snieko 1999), damage or disturbance (Perry 1994), disease (Simard et al. 2001), initial seed-ling size (Wagner, Radosevich 1991), interac-tions with soil organisms (Simard et al. 1997) or microsite quality (Arii, Turkington 2001). In our study spruce growth could be influenced by some of these factors. In another study Légaré et al. (2004) reported that despite the presence of similar abiotic conditions growth of conifers [Picea mariana (Mill.) Britton, Sterns & Poggenburg] and the nature of the influence of broadleaves ( Popu-lus tremuloides Michx.) changed with the change
Fig. 3. Mean spruce annual DBH increment by birch density (stems·ha–1) classes at different sites
The arrow indicates density classes that significantly affect spruce mean annual DBH increment (MAI), sph – stems per hectar, density class based on 1,000 stems·ha–1
Figure 3. Mean spruce annual DBH increment by birch density (stem/ ha) classes at different sites
0 0.4 0.8 1.2 1.6 2
0 1 2 3 4 5 6 7 8
MAI
(c
m)
Brich density (stems·ha–1)
Luyben
DBH = 0.8225 – 0.000027 × sph
0 0.4 0.8 1.2 1.6 2
0 1 2 3 4 5 6 7 8
MAI
(c
m)
Beaver Lake
DBH = 1.1395 – 0.000037×sph
(d)
0 0.4 0.8 1.2 1.6 2
0 1 2 3 4 5 6 7 8
MAI
(c
m)
Klua Creek
DBH = 0.9901 – 0.000058×sph
(e)
0 0.4 0.8 1.2 1.6 2
0 1 2 3 4 5 6 7 8
MAI
(c
m)
Birch density (stems·ha–1)
Profit River
DBH = 0.98239 – 0.00007 × sph
(c) 0 0.4 0.8 1.2 1.6 2
0 1 2 3 4 5 6 7 8
MAI
(c
m)
Rasberry Creek 11
DBH = 1.0303 – 0.000043×sph
(a)
0 0.4 0.8 1.2 1.6 2
0 1 2 3 4 5 6 7 8
MAI
(c
m)
Rasberry Creek 12
DBH = 1.0265 – 0.000053 × sph
(b)
(f) (a)
(b)
(c)
(d)
(e)
[image:8.595.73.520.54.402.2]of broadleaf density. In most cases spruce size de-creased with increasing birch density but the rate of annual DBH growth significantly increased with the increasing stand age from 15 to 20 years. How-ever, the strength of the relationship between age and annual DBH growth became weaker with the increase of age. This might be due to the increase of intertree competition. Simard et al. (2004) re-ported that conifer stands reached the full site oc-cupancy at the age of 25 years; full site ococ-cupancy indicating stem exclusion stages of stand develop-ment, intense intertree competition, beginning of self-thinning, and maximal leaf area (Oliver, Lar-son 1996; Kozlowski 2002; Simard et al. 2004).
At the beginning of early stand development it appears that birch competition did not have a detrimental impact on spruce radial growth ex-cept at RC12 site. This possibly is reflected by similar trial establishment heights (codominant) between spruce and birch – the spruce had not been overtopped except at the younger Klua site or had caught up to the birch in height. This is con-sistent with the observations of Valkonen and Valsta (2001), who suggested a small negative ef-fect of birch on Norway spruce growth. Based on the study by Fahlvik et al. (2005) and Hawkins
et al. (2012a), the productivity of birch and spruce mixture was greater compared to Norway spruce or white spruce monocultures. The Scandinavian experience shows that birch-spruce mixtures are more productive than spruce alone until the age of ca 20 years and thereafter, spruce monocultures are usually more productive (Frivold, Frank 2002). However, Bergqvist (1999) hypothesized that the uppermost leaves of spruce are light saturated and therefore shading has a small impact on spruce photosynthetic productivity. However, there still is an uncertainty regarding birch-spruce competition and whether it will increase or decrease with stand age at the Klua site (Fig. 2). From different stud-ies it was revealed that birch growth slows down with increased stand age [around 15 years (Fri- vold, Frank 2002) and 15–20 years (Simard, Vyse 2006)]. If this is the case at Klua, the competi-tive effects of birch should decrease in the future.
With the exception of RC12 site, there were birch density and RDI class below which white spruce trial establishment DBH was not affected by com-petition (Tables 5 and 6). Based on this study, the birch density that significantly affects the spruce growth exceeded the current reforestation guide-lines (British Columbia Ministry of Forests 2002,
[image:9.595.78.519.55.364.2]Fig. 4. Spruce mean annual DBH increment by birch relative density index (RDI) classes at different sites The arrow indicates birch RDI classes that significantly affect spruce mean annual DBH increment (MAI)
Figure 4. Spruce mean annual DBH increment by birch relative density index (RDI) classes at different sites
[Arrow ( ) indicates birch RDI classes significantly affect spruce mean annual DBH increment (MAI)] 0
0.4 0.8 1.2 1.62
0 1 2 3 4 5 6 7 8
MAI (
cm)
Rasberry Creek 12
DBH= 1.0182 – 0.04710×RDI
0 0.4 0.8 1.2 1.62
0 1 2 3 4 5 6 7 8
MAI (
cm)
Beaver Lake
DBH = 1.1661 – 0.08154×RDI
0 0.4 0.8 1.2 1.62
0 1 2 3 4 5 6 7 8
MAI (
cm)
RDI class Profit River
DBH = 0.87622 – 0.06440×RDI
0 0.4 0.8 1.2 1.62
0 1 2 3 4 5 6 7 8
MAI (
cm)
Klua Creek
DBH = 0.9765 – 0.11223×RDI
0 0.4 0.8 1.2 1.62
0 1 2 3 4 5 6 7 8
MAI (
cm)
Rasberry Creek 11
DBH = 1.0299 – 0.07889×RDI
(a)
0 0.4 0.8 1.2 1.62
0 1 2 3 4 5 6 7 8
MAI (
cm)
RDI class Luyben
DBH = 0.8362 – 0.03779×RDI
(b)
(c)
(d)
(e)
(f) (a)
(b)
(c)
(d)
(e)
2005). Conversely, the observed results of minimal birch impact on spruce DBH at trial establishment are supported by different studies in North America (Kelty 2006) and Scandinavia (Bergqvist 1999). At RC12 site, where birch competition significantly affected spruce establishment DBH (Table 5), but when we consider the mean annual spruce DBH growth over a three-year period, birch density up to 4,000 stems·ha–1 showed an insignificant effect.
Birch densities and RDI had to exceed 4,000 stems·ha–1 and 3, respectively, to affect
spruce annual DBH growth significantly at all sites except the Klua site, where density was greater than 4,000 stems·ha–1 but RDI less than 3 (Tables 7 and
8). Again, these values represent significant levels of competition that largely exceed the current BC reforestation guidelines (British Columbia Min-istry of Forests 2002, 2005). Even at the Klua site, where birch was dominant rather than codomi-nant, the density exceeded the BC reforestation guideline too (1,000 stems·ha–1 broadleaves). This
suggested that the retention of broadleaves up to a threshold density level in the conifer forest may increase the total productivity of stands. Some other studies in the central BC interior (Hawkins, Dhar 2011; Hawkins et al. 2012a) showed that the threshold density of birch in spruce-birch mixed stands was within 3,000–4,000 stems·ha–1 in 10 to
[image:10.595.64.531.467.737.2]18 years old stand. Moreover, they also reported that spruce-birch mixed stands are more produc-tive than the single species stand. Some other in-vestigations in mixed stands also suggested greater productivity than that of pure stands of either spe-cies (Simard et al. 2005; Newsome et al. 2010). According to Kelty (2006) more than two species combinations provide the greatest yield compared to pure stand. A similar observation was reported by Mårda (1996), where spruce yield was signifi-cantly hampered by mixedwood conditions but the yield of birch was almost three times higher than the loss of spruce yield. On the other hand, Knoke et al. (2008) stated that compared to pure stand the yield of mixed stand varies from site to site. Similarly, Brown (1992), Frivold and Frank (2002), Pretzsch (2005) concluded that depend-ing on the adaptation of the monoculture stand to the site conditions both higher and lower or even equal yield can be possible in mixed stands com-pared to pure stand. Newton and Comeau (1990) hypothesized that the potential benefit of compet-ing vegetation to the site nutrient balance could lead to long-term productivity gains while others (Matthews 1989; Simard, Vyse 2006) suggested that nutrient inputs to the system from birch lit-ter are important for maintaining site productivity over several rotations. According to Richards et
Table 8. Regressions of mean annual spruce DBH (cm) growth against different relative density index (RDI) classes at the six sites
Site RDI class r2 F P Equation
Raspberry Creek 11
all 0.027 2.8853 0.094 DBH = 0.9704 – 0.03533 × RDI, n = 69 ≤ 4 0.1268 9.4184 0.0033 DBH = 1.0406 – 0.09375 × RDI, n = 59 ≤ 3 0.043 3.2007 0.0799 DBH = 1.0299 – 0.07889 × RDI, n = 50
Beaver Lake
all 0.0941 6.6097 0.013 DBH = 1.1390 – 0.05730 × RDI, n = 55 ≤ 5 0.1266 9.988 0.0025 DBH = 1.0277 – 0.08161 × RDI, n = 63 ≤ 4 0.1227 8.1293 0.0063 DBH = 1.1655 – 0.08119 × RDI, n = 52 ≤ 3 0.0558 3.6024 0.0644 DBH = 1.1661 – 0.08154 × RDI, n = 45 Raspberry
Creek 12 ≤ 4all 0.13250.0337 7.87022.4988 0.00750.1214 DBH = 1.0350 – 0.07066 × RDI, DBH = 1.0182 – 0.04710 × RDI, nn = 47 = 44
Klua Creek
all 0.3916 29.966 < 0.0001 DBH = 0.9406 – 0.06959 × RDI, n = 46 ≤ 3 0.1186 5.3041 0.0282 DBH = 0.9705 – 0.09805 × RDI, n = 33 ≤ 2 0.0787 3.3055 0.0806 DBH = 0.9765 – 0.11223 × RDI, n = 28
Profit River ≤ 5all 0.068650.10235 6.159767.61334 0.077180.01551 DBH = 0.83466 – 0.03666 × RDI, DBH = 0.87622 – 0.06440 × RDI, nn = 59 = 71
Luyben
all 0.0812 5.3294 0.0253 DBH = 0.7893 – 0.01397 × RDI, n = 50 ≤ 5 0.1222 6.4283 0.0155 DBH = 0.8432 – 0.04521 × RDI, n = 40 ≤ 4 0.0207 1.697 0.202 DBH = 0.8362 – 0.03779 × RDI, n = 34
al. (2010), more than 65% of mixed species studies showed a significant increase of nitrogen (N) and phosphorus (P) use efficiencies when different spe-cies are grown in a mixture compared to a mono-culture. Therefore beneficial interactions inherent in species mixes will be lost when broadleaf species (birch) are removed. Moreover, birch is an early seral species and its competitive effect on the co-nifer target species diminishes after crown closure (Frivold, Frank 2002; Simard, Vyse 2006).
Management implications
Forest management practices in British Columbia (BC) deal with the removal of broadleaf trees and other competing vegetation to increase conifer pro-ductivity due to the Forest and Range Practices Act of BC (1996) (Comeau et al. 2000; Wagner et al. 2005; Hawkins et al. 2012a). According to this regulation forest managers are forced to measure a regenerating plantation performance against pure conifer stands where all deciduous vegetation is treated as a com-petitor. The major consideration for this practice is to reduce the competitive effect on conifer crop or target trees and facilitate a better productive environ-ment (Wagner et al. 2005). Based on this practice a free growing policy has been implemented to regulate competition from broadleaves and other vegetation (British Columbia Ministry of Forests 2002; Simard, Vyse 2006). A free growing stand is defined as a stand of healthy trees of a commercially valuable species, the growth of which is not impeded by competition from plants, shrubs or other trees (British Columbia Ministry of Forests 2005). Based on this, a free grow-ing conifer could have no broadleaf tree greater than two-thirds of its height within a 1-m radius.
In BC, hardly any of the conifer plantations meets free growing requirements without a brush-ing treatment and these brushbrush-ing treatments com-monly involve almost complete broadleaf removal. This may lead to unnecessary herbicide application costs for attaining a free growing standard and it may have a detrimental impact on ecosystems al-though a study by Hawkins et al. (2012b) reported that herbicide application showed minimal or no impact on understorey vegetation diversity in cen-tral BC. From our investigation, birch densities up to 4,000 stems·ha–1 in 15–20 years old stands
ap-pear not to significantly influence spruce produc-tivity in the northern BC interior. However, compe-tition relationships derived in this study need to be further tested in a manipulated experimental trial in another part of BC to validate the results as other
than birch density, different underlying environ-mental factors may also affect the target conifer per-formance directly. This might also be the reason to have low adjusted r2 values in our regression models.
Therefore we recommended forest managers to use these results but use them with caution and find spe-cies mixtures that maximize the benefits and mini-mize the costs of maintaining mixedwood stands. Moreover, this knowledge will provide an outline for more diverse provincial policies regarding the main-tenance of mixed species composition.
Acknowledgements
This work was funded by the Forest Investment Ac-count, Forest Science Program of British Columbia. The opinions expressed here do not necessarily re-flect the opinions of the funding agency. O. Quinn, B. Rogers, K. Menounos, J. Lange, D. Danskin, N. Balliet, C. Baker, K. Runzer, Ch. Maundrel and Y.P. Liang are all thanked for field work on the project. We are also thankful to two anonymous re-viewers and the editor for their valuable comments and meaningful suggestions which helped us to im-prove the overall manuscript substantially.
References
Aitken K.E.H., Wiebe K.L., Martin, K. (2002): Nest-site reuses patterns for a cavity-nesting bird community in interior British Columbia. The Auk, 119: 391–402. Arii K., Turkington R. (2001): Assessing competition
in-tensity along productivity gradients using a simple model. Canadian Journal of Botany, 79: 1486–1491.
Bergqvist G. (1999): Wood volume and stand structure in Norway spruce understory depending on birch shelterwood density. Forest Ecology and Management, 122: 221–229. Binkley D. (2003): Seven decades of stand development in
mixed and pure stands of conifers and nitrogen-fixing red alder. Canadian Journal of Forest Research, 33: 2274–2279. Brand D.G. (1986): A competition index for predicting the
vigour of planted Douglas-fir in southwestern British Co-lumbia. Canadian Journal of Forest Research, 16: 23–29. British Columbia Ministry of Forests (2002): Reference Guide
for FDP Stocking Standards, Prince George Forest Region. Available at http://www.llbc.leg.bc.ca/public/pubdocs/ bcdocs/358509/stocking_standards.htm (accessed October 24, 2012).
Brown A.H.F. (1992): Functioning of mixed-species stands at Gisburn, N.W. England. In: Cannell M.G.R., Malcolm D.C., Robertson P.A. (eds): The Ecology of Mixed-Species Stands of Trees. Oxford, Blackwell: 125–150.
Burton P.J. (1993): Some limitations inherent to static indices of plant competition. Canadian Journal of Forest Research, 23: 2141–2152.
Clair J.B., Snieko R.A. (1999): Genetic variation in response to shade in coastal Douglas-fir. Canadian Journal of Forest Research, 29: 1751–1763.
Comeau P.G., Biring B.S., Harper G.J. (2000): Conifer Response to Brushing Treatment: Summary of British Columbia Data. Available at http://www.for.gov.bc.ca/hfd/ pubs/docs/en/en41.pdf (accessed November 17, 2012). Curtis R.O. (1970): Stand density measures: an
interpreta-tion. Forest Science, 16: 403–414.
Curtis R.O (1982): A simple index of stand density for Douglas–fir. Forest Science, 28: 92–94.
DeLong S.C. (1991): The light interception index: a potential tool for assisting in vegetation management decisions. Canadian Journal of Forest Research, 21: 1037–42. DeLong C., Annas R.M., Stewart A.C. (1991): Boreal
white and black spruce zones. In: Meidinger D., Pojar J. (eds): Ecosystem of British Columbia. Victoria, BC Ministry of Forests: 237–250.
Ducey M.J., Knapp R.A. (2010): Rapid assessment of rela-tive density in mixed-species stands of the north-eastern United States. International Journal of Forest Research.
doi:10.1155/2010/212068
Ducey M.J., Larson B.C. (2003): Is there a correct stand density index? An alternate interpretation. Western Journal of Applied Forestry, 18: 179–184.
Fahlvik N., Agestam E., Nilsson U., Nyström K. (2005): Simulating the influence of initial stand structure on the development of young mixtures of Norway spruce and birch. Forest Ecology and Management, 213: 297–311. Forest Practices Code of British Columbia Act (1996): RSBC,
Chapter 159. Available at http://www.bclaws.ca/EPLibrar-ies/bclaws_new/document/ID/freeside/00_96159_01 (ac-cessed February 19, 2013).
Frivold L.H., Frank J. (2002): Growth of mixed birch-coniferous stands in relation to pure birch-coniferous stands at similar sites in South-eastern Norway. Scandinavian Journal of Forest Research, 17: 139–149
Haggar J.B., Ewell J.J. (1997): Primary productivity and resource partitioning in model tropical ecosystems. Ecol-ogy, 78: 1211–1221.
Hawkins C.D.B., Dhar A., Rogers B.J. (2012a): How much birch (Betula papyrifera) is too much for maximizing spruce (Picea glauca) growth: a case study in boreal spruce plantation forests. Journal of Forest Science, 58: 314–327. Hawkins C.D.B., Dhar A., Lange J. (2012b): Vegetation
management with Glyphosate has little impact on under-story species diversity or tree growth in a sub boreal spruce plantation – a case study. Plant Biosystems (in press). doi: 10.1080/11263504.2012.736421.
Hawkins C.D.B., Dhar A. (2011): Mixtures of broadleaves and conifers are ecologically and economically desired in an uncertain future changing climate. In: Muys B. (ed.): Proceedings of the Conservation and Management of Forests for Sustainable Development: Where Science Meets Policy. Leuven, 23.–24. November 2011. Belgium, Katholieke University Leuven: 20.
Kelty M.J. (2006): The role of species mixtures in plantation forestry. Forest Ecology and Management, 233: 195–204. Kent M., Coker P. (1992): Vegetation Description and Anal-ysis: A Practical Approach. Exeter, Short Run Press: 363. Knoke T., Ammer C., Stimm B., Mosandl R. (2008):
Admix-ing broadleaved to conifer tree species: A review on yield, ecological stability and economics. European Journal of Forest Research, 127: 89–101
Kozlowski T.T. (2002): Physiological ecology of natural regeneration of harvested and disturbed forest stands: implications for forest management. Forest Ecology and Management, 158: 195–221.
Lautenschlager R.A. (2000): Can intensive silviculture contribute to sustainable forest management in northern ecosystems? The Forestry Chronicle, 76: 283–295. Lavender D.P., Parish R., Johnson C.M., Montgomery
G., Vyse A., Willis R.A., Winston D. (1990): Regenerat-ing British Columbia’s Forests. Vancouver, UBC Press: 385. Légaré S., Paré D., Bergeron Y. (2004): The responses of black
spruce growth to an increased proportion of aspen in mixed stands. Canadian Journal of Forest Research, 34: 405–416. Leiffers V.J., Macmillan R.B., MacPherson D., Branter
K., Stewart J.D. (1996): Semi-natural and intensive sil-vicultural systems for the boreal mixedwood forest. The Forestry Chronicle, 72: 286–292.
Long J.N. (1985): A practical approach to density manage-ment. The Forestry Chronicle, 61: 23–27.
Mårda H. (1996): The influence of a birch shelter (Betula
spp.) on the growth of young stands of Picea abies. Scan-dinavian Journal of Forest Research, 11: 343–350. Matthews J.D. (1989): Silvicultural Systems. Oxford,
Clar-endon Press: 284.
Ministry of Forests, Lands and Natural Resource Opera-tions (2011): Site Index Estimates by Site Series: Report by Region. Available at http://www.for.gov.bc.ca/hre/sibec/ reports/sisuByRegion.pdf
Misson L., Vincke C., Devillez F. (2003): Frequency responses of radial growth series after different thinning intensities in Norway spruce (Picea abies (L.) Karst.) stand. Forest Ecology and Management, 177: 51–63.
Mitchell S.J. (2003): Effects of mechanical stimulus, shade and nitrogen fertilization on morphology and bending resistance in Douglas-fir seedlings. Canadian Journal of Forest Research, 33: 1602–1609.
Newsome T., Heineman J.L., Nemec A. (2010): A comparison of lodgepole pine responses to varying levels of trembling aspen removal in two dry south-central British Columbia eco-systems. Forest Ecology and Management, 259: 1170–1180. Newton M., Comeau P.G. (1990): Control of competing
vegetation. In: Lavender D.P., Parish R., Johnson C.M., Montgomery G., Vyse A., Willis R.A., Winston D. (eds): Regenerating British Columbia’s Forests. Vancouver, UBC Press: 256–265.
Newton P.F., Jolliffe P.A. (1998): Assessing processes of intraspecific competition within spatially heterogeneous black spruce stands. Canadian Journal of Forest Research, 28: 259–275.
Oliver C.D., Larson B.C. (1996): Forest Stand Dynamics. New York, John Wiley and Sons: 540.
Perry D.A. (1994): Forest Ecosystems. Baltimore, Johns Hopkins University Press: 649.
Paquette A., Messier C. (2011): The effect of biodiversity on tree productivity: from temperate to boreal forests. Global Ecology and Biogeography, 20: 170–180.
Pretzsch H. (2005): Diversity and productivity in forests: evidence from long-term experimental plots. In: Scherer-Lorenzen M., Körner C., Schulze E.D. (eds): Forest Diversity and Function: Temperate and Boreal Systems. Ecological Studies, Vol. 176. Berlin, Springer: 41–64. Pretzsch H., Schütze G. (2009): Transgressive over yielding in
mixed compared with pure stands of Norway spruce and Eu-ropean beech in Central Europe: Evidence on stand level and tree level. European Journal of Forest Research, 128: 183–204. Reineke L.H. (1933): Perfecting a stand density index for
even age forests. Journal of Agricultural Research, 46: 627–638.
Richards A.E., Forrester D.I., Bauhus J., Scherer-Lorenzen M. (2010): The influence of mixed species tree plantations on the nutrition of individual species: a review. Tree Physiology, 30: 1192–1208.
Rothe A., Binkley, D. (2001): Nutritional interactions in mixed species forests: A synthesis. Canadian Journal of Forest Research, 31: 1855–1870.
Simard S.W. (1990) A Retrospective Study of Competition between Paper Birch and Planted Douglas-fir. Available at http://www.for.gov.bc.ca/hfd/pubs/Docs/Frr/Frr147.pdf (accessed September 6, 2012).
Simard S.W., Sachs D.L. (2004): Assessment of inter-specific competition using relative height and distance indices in an age sequence of seral interior cedar-hemlock forests in British Columbia. Canadian Journal of Forest Research, 34: 1228–1240.
Simard S.W., Vyse A. (2006): Trade-offs between competi-tion and facilitacompeti-tion: A case study of vegetacompeti-tion
manage-ment in the interior cedar-hemlock forests of southern British Columbia. Canadian Journal of Forest Research, 36: 2486–2496.
Simard S.W., Sachs, D.L., Vyse A., Blevins L. L. (2004): Paper birch competitive effects vary with conifer tree species and stand age in interior British Columbia forests: implications for reforestation policy and practice. Forest Ecology and Management, 198: 55–74.
Simard S.W. Heineman J.L., Mather W.J., Sachs D.L., Vyse A. (2001): Effects of Operational Brushing on Co-nifers and Plant Communities in the Southern Interior of British Columbia: Results from PROBE 1991–2000. Available at http://www.for.gov.bc.ca/hfd/pubs/docs/Lmh/ Lmh48.pdf (accessed October 19, 2012).
Simard S.W., Hagerman S.M., Sachs D.L., Heineman J.L., Mather W.J. (2005): Conifer growth, Armillaria ostoyae
root disease and plant diversity responses to broadleaf competition reduction in temperate mixed forests of southern interior British Columbia. Canadian Journal of Forest Research, 35: 843–859.
Simard S.W., Perry D.A., Jones M.D., Myrold D.D., Durall D.M., Molina R. (1997): Net transfer of carbon between tree species with shared ectomycorrhizal fungi. Nature, 388: 579–582.
Taylor S.P., Alfaro R.I., DeLong C., Rankin L. (1994): Effects of over-story shading on white pine weevil dam-age to interior white spruce. In: Alfaro R.I., Kiss G., Fraser R.G. (eds): Proceedings of the Symposium – The White Pine Weevil: Biology, Damage and Management. Richmond, 19.–21. January 1994, Victoria, BC Ministry of Forests: 254–261.
Torres-Rojo J.M., Martínez A. (2000): Relative stand density index for mixed even-aged stands. Agrociencia, 4: 497–507.
Valkonen S., Valsta L. (2001): Productivity and economics of mixed two-storied spruce and beech stands in Southern Finland simulated with empirical models. Forest Ecology and Management, 140: 133–149.
Vandermeer J. (1989): The Ecology of Intercropping. Cam-bridge, Cambridge University Press: 237.
Wagner R.G., Little K.M., Richardson B., McNabb K. 2005. The role of vegetation management for enhancing productivity of the world’s forests. Forestry, 7: 57–79. Wagner R.G., Radosevich S.R. (1991): Interspecific
com-petition and other factors influencing the performance of Douglas-fir saplings in the Oregon coast range. Canadian Journal of Forest Research 21: 829–835.
Received for publication January 24, 2013 Accepted after corrections March 14, 2012
Corresponding author:
Dr. Amalesh Dhar, Bulkley Valley Centre for Natural Resources Research and Management, 1188 Main Street/Box 4274, Smithers, British Columbia V0J 2N0, Canada