Solidification-Path and Microstructure of Al-Ti-Cr Alloy Analyzed
by Progressive-Type Solidification Equation
Nobuyuki Mori and Keisaku Ogi
Dept. of Materials Science and Engineering, Faculty of Engineering, Kyushu University, Fukuoka 812-8581, Japan
There have been many analytical and numerical studies on microsegregation and prediction of second phase in solidification structures of alloys, and they have both advantages and disadvantages especially on the applicability of variable partition ratio (k) of solute and diffusion coefficient (D) in the solid. In this paper, we propose and apply a new progressive-type solidification equation: CLi¼
CLi1 ½f1 ð1Bki1Þfsig=f1 ð1Bki1Þfsi1gðki11Þ=ð1Bki1Þ, which has a parameter (B) including variable partition ratio (k) and
D. A specific parameterBis given in each progressive solidification model:B¼2(Flemings model),B¼2ð1expð1=ÞÞ expð1=2Þ (Clyne-Kurz model), orB¼2=ð1þ2Þ(Ohnaka model), where¼Df=L2,L: effective length of volume element (¼sd2=2,s: structure factor (¼0:51),d2: dendrite arm spacing),f: local solidification time. The difference inB-values among the above models are small when
D-value is relatively small. The solidification-paths of various Al-Ti-Cr alloys, which crystallize L12-type (Al,Cr)3Ti as the primary phase, are analyzed by the progressive-type solidification equation by using the aboveBvalues and the data of Al-Ti-Cr phase diagram includingk-values (: functions of composition) and experimentally determined diffusion coefficient. The calculated results agree well with the solidification microstructures: the species and the amounts of non-equilibrium eutectic phases and the composition of primary phases.
(Received April 4, 2003; Accepted September 12, 2003)
Keywords: solidification, microsegregation, solidification path, solidification equation, aluminum-titanium-chromium, non-equilibrium second phase, progressive equation, intermetallic compound
1. Introduction
Many analytical or numerical methods were proposed and examined to analyze microsegregation of alloys: Flemings equation, Clyne-Kurz equation, Ohnaka equation, or many numerical simulations.1–3)The authors have proposed a new progressive-type solidification equation which has a param-eter (B) includingDin the solid and variable partition ratios (ki1).4–6) This progressive-type solidification equation is applied to analyze the solidification of L12-type (Al,Cr)3Ti alloys. This intermetallic alloy is studied as a next-generation heat-resistant alloy, however, the industrial applications are not realized yet because of its insufficient toughness. Since the information on the solidification process in arc-melting or unidirectional solidification is not sufficient for this Al-Ti-Cr system, the microstructure couldn’t be controlled well and contains defects such as non-equilibrium second phases and boids after solidification or heat treatment.7–9)In this study, to evaluate the solidification path and non-equilibrium solid-ification microstructures of (Al,Cr)3Ti alloys, the new progressive-type solidification equation is applied with solidification parameters: variable partition ratio (k) of solute and diffusion coefficient (D), effective length of volume element (L¼sd2=2, s: structure factor (¼0:51), d2: dendrite arm spacing) and local solidification time (f)
obtained by the experiment.10,11)
2. Analysis of Solidification Path by Progressive-Type Solidification Equation
The following equation is given for the solidification of a volume element (with section: A, length: L) when the interface position isand fraction of solid isfs(¼=L).
ðCLCsÞ Ad¼ ð1fsÞ V0dCL
þADð@Cs=@xÞdt ð1Þ
The following approximate equation is given by Flemings
et al.when the growth is proportional to the square root of the time (t): ¼Lðt=fÞ1=2, and ð@Cs=@xÞ ¼dCs=d, dCs¼ kdCL.
ðCLCsÞ dfs¼ ð1fsþBkfsÞ dCL ð2Þ
where,CL: liquid concentration,Cs: solid concentration,Cs:
interface concentration of solid (¼kCL),k: partition ratio
of solute,fs: solid fraction,B¼2,¼Df=L2,f: local
solidification time, D: diffusion coefficient in the solid, L: growth length (¼d2=2,d2is secondary dendrite arm spacing of primary phase), V0: volume of the element (¼AL for plate).
By the integration of the equation (2), the following solidification equations on the changes of liquid and solid are obtained. Three cases ((a) Constant k, (b) Variable k, (c) VariablekandD) are shown in the following.
2.1 Constantk
The following solidification equation is obtained by the integration of Eq. (2) from (CL0, 0) to (CL,fs).
CL¼CL0½1 ð1BkÞfs
k1
1Bk ð3Þ
For Flemings model,B¼2,¼Df=L2. When¼0,
Eq. (3) becomes to well-known Scheil’s equation (or Pfann’s equation).12,13)Since the above equation becomes ‘‘Equili-brium solidification equation’’ when¼0:5(B¼1:0), and the error becomes larger for large value of diffusion coefficient (D), the following modified models are proposed. In Clyne-Kurz model,2) B¼2ð1expð1=ÞÞ expð1=2Þis applied for the eq. (3). By using this modified
B, eq. (3) becomes ‘‘Equilibrium solidification equation’’ whenD¼ 1,¼ 1andB¼1:0, and Scheil’s equation is obtained when D¼0, ¼0, B¼0. In Ohnaka model,3)
B¼2=ð1þ2Þ is applied for the eq. (3), and solid concentration (Cs) is given by the equation: Cs¼bþcx2
(b, c are constants, x is the distance from the center of dendrite arm).
2.2 Variablek
The following progressive-type solidification equation is obtained by the integration of eq. (2) from (CLi1,fsi1) to (CLi,fsi) wherekis approximated as a constant value (ki1).
CLi¼CLi1
1 ð1Bki1Þfsi
1 ð1Bki1Þfsi1
ki11
1Bki1
ð4Þ
For Flemings model: B¼2. Clyne-Kurz model: B¼
2ð1expð1=ÞÞ expð1=2Þ, Ohnaka model: B¼
2=ð1þ2Þ, where ¼Df=L2, f: local solidification
time, L: length of volume element (¼sd2=2,s: structure factor (¼0:51), which is defined in the following section ‘‘3.1.2’’ and ‘‘3.2.1’’).
By using the above equation, ki1 (i¼1 to n) values (ki1(Ti) for Ti andki1(Cr) for Cr) are used in the dividedn -regions, and the solidification path can be calculated for ternary- or multi-component systems. The effect of n is described in ‘‘3.2.2’’.
2.3 Variablekand VariableD
The following progressive-type solidification equation is obtained by the integration of eq. (2) from (CLi1,fsi1) to (CLi,fsi) wherekandB(andD) are approximated as constant
values (ki1,Bi1).
CLi¼CLi1
1 ð1Bi1ki1Þfsi
1 ð1Bi1ki1Þfsi1
ki11
1Bi1ki1 ð5Þ
For Flemings model: Bi1¼2i1, Clyne-Kurz model:
Bi1¼2i1ð1expð1=i1ÞÞ expð1=2i1Þ, Ohnaka model:Bi1¼2i1=ð1þ2i1Þ, andi1¼Di1f=L2.
By using the above equation, ki1 andBi1ðDi1Þ values (i¼1 to n) are used in the divided n-regions, and the solidification path can be calculated for ternary- or multi-component systems. However, in this paper, experimentally obtained constantDvalue is used in the following analysis: the above case (2.2) is used for the calculation.
3. Results and Discussion
3.1 Partition Ratio (k) and Length of Volume Element (L) for Diffusion in Dendrite
3.1.1 Partition Ratio (k)
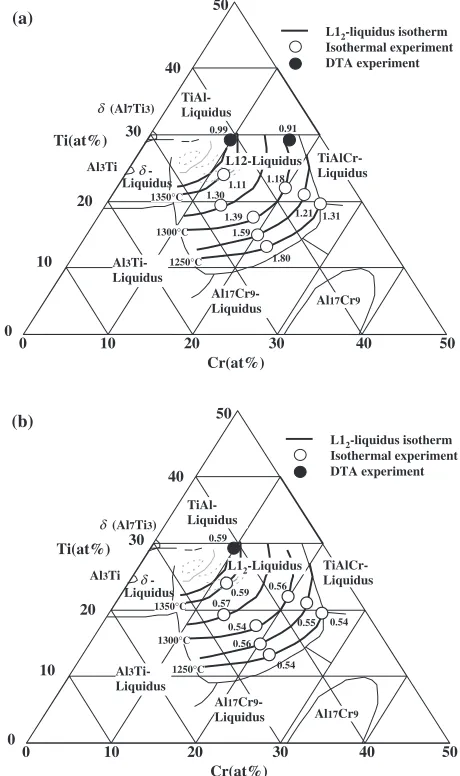
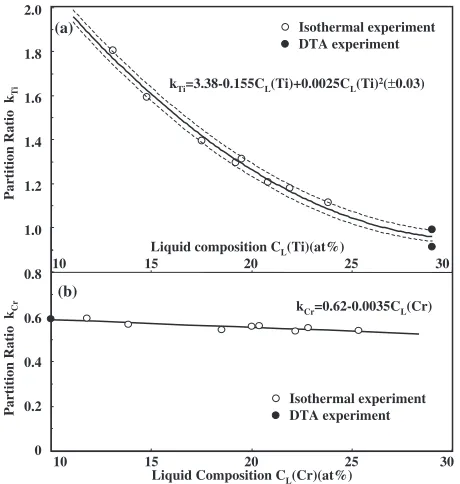
The liquidus surface and isotherms of L12-phase and partition ratio (k) were experimentally obtained as shown in Fig. 1(a)(b).10) From these results, partition ratios (kTi;kCr)
are given as functions of the liquid concentrations (CL(Ti), CL(Cr)), and are shown in Fig. 2(a),(b). These partition ratios
are obtained from experimental tie-lines, and the following approximate equations are derived on the variable partition ratio (kTi,kCr) for Ti and Cr.10)
kTi¼3:380:155CLðTiÞ þ0:0025CLðTiÞ2 ð0:03Þ ð6Þ
kCr¼0:620:0035CLðCrÞ ð0:02Þ ð7Þ
In Figs. 1 and 2, white circles ( ) were obtained by the
high temperature isothermal experiment to determine the equilibrium concentrations of liquid and solid, and black circles ( ) were obtained from the minimum concentration of primary crystals in the solidified DTA-specimens under the approximation of negligible solid diffusion. The errors in the above equations (0:03for Ti,0:02for Cr) might be caused by the experimental errors in determining liquidus composition etc.
3.1.2 Effect of Dendrite Structure on the Length of Volume Element (L) and Experimentally Deter-mined Diffusion Coefficient (D)
In the above analysis, the length of volume element (L) is approximately given by L¼d2=2, where d2 is secondary dendrite arm spacing. However, it is known that solute diffusion in the dendrite arms occur as L¼d2=4, since the secondary arm spacing increases during solidification by coarsening and coalescence.11)The same phenomena should occur in Al-Ti-Cr alloys, as shown in Fig. 3: an example of coalescence of dendrite arms (an arrow(S) in the photograph shows the solute rich region in a dendrite arm, indicating the coalescence occurred here at later stage of solidification). For these cases, the length of volume element (L) for the analysis
0 10 20 30 40 50
Cr(at%) Ti(at%)
-δ
Liquidus Al3Ti
δ(Al7Ti3) 30
40
0 10
20
50
L12-Liquidus
TiAlCr-Liquidus
Al17Cr9
-Liquidus Al17Cr9
Al3 Ti-Liquidus
TiAl-Liquidus
0.59
0.54 0.55 0.56
0.57 0.59
0.54
0.54 0.56 1350°C
1300°C
1250°C
L12-liquidus isotherm
Isothermal experiment DTA experiment
(b)
0 10 20 30 40 50
Cr(at%) Ti(at%)
-δ
Liquidus Al3Ti
δ(Al7Ti3) 30
40
0 10
20
50
L12-Liquidus TiAlCr-Liquidus
Al3 Ti-Liquidus
Al17Cr9
-Liquidus Al17Cr9
TiAl-Liquidus
0.99 0.91
1.30
1.21 1.11
1.31 1.18
1.39 1.59
1.80 1350°C
1300°C
1250°C
L12-liquidus isotherm
Isothermal experiment DTA experiment
(a)
[image:2.595.311.541.76.464.2]should be equal tod2=4.
Therefore, in this paper, the effective length of volume element L (¼sd2=2, s: structure factor (¼0:51)) is defined, and the effects of L (and s) and experimentally determined diffusion coefficient (D) on the analysis are discussed. Further discussion on s-values for various solid-ification conditions will be a future subject.
The solid diffusion coefficient (D) of solute (Ti and Cr) was obtained by the following equation14)from the homog-enization experiment of Al-25%Ti-10%Cr alloy (d2¼22 106m,fs
0: fraction of solid before homogenization = 0.88) at 1,300C for 3600(s) (after homogenization:fs¼0:98). D
of Ti and Cr were assumed to be the same.
g
g0
¼exp
2Dt
4L2
ð8Þ
The following relation is obtained from the above equation.
D¼ 4L
2
2tln
g
g0
ð9Þ
where, g = (fraction of liquid (1fs) after homogeniza-tion)/(fraction of solidfsafter homogenization) = 2/98 = 0.02,g0 = (fraction of liquid (1fs0) before homogeniza-tion)/(fraction of solidfs0before homogenization) = 12/88 = 0.14,t: diffusion time, L: diffusion length (m) =d2=2, or
L¼d2=4(d2: secondary dendrite arm spacing).
Therefore;for L¼d2=2 :D¼Da¼2:71014 ðm2=sÞ10Þ
for L¼d2=4 :D¼De¼0:6751014 ðm2=sÞ
3.2 Calculated Results for Al-25%Ti-10%Cr Alloy by the Progressive-Type Solidification Equation 3.2.1 Effects of Solidification Model and Diffusion
[image:3.595.55.285.73.315.2]Co-efficient in the Solid
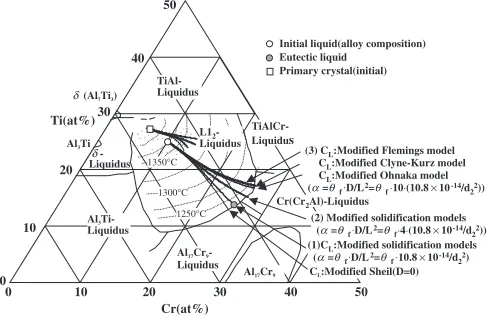
Figure 4 shows Al-rich side equilibrium phase diagram of Al-Ti-Cr alloys,10,15) which mainly illustrates the liquidus and solidus surfaces of L12-type (Al,Cr)3Ti phase and their isothermal lines. In the figure, calculated solidification paths are shown for the three progressive-type solidification equation models: Modified Flemings model, Modified Clyne-Kurz model and Modified Ohnaka model. The models give almost the same changes of liquid concentration of Cr(:CL(Cr)) and Ti(:CL(Ti)) and those of solid concentration
(CS(Cr),CS(Ti)) of the primary phase for Al-25%Ti-10%Cr
alloy (f ¼2540s,d2¼150mm,Tf ¼127K). The above
10 15 20 25 30
Liquid Composition CL(Cr)(at%) 2.0
1.8
1.6
1.4
1.2
1.0
0.8
0.6
0.4
0.2
0
Partition Ratio k
Cr
Partition Ratio k
Ti
Liquid composition CL(Ti)(at%)
10 15 20 25 30
Isothermal experiment DTA experiment
Isothermal experiment DTA experiment kTi=3.38-0.155CL(Ti)+0.0025CL(Ti)2(±0.03)
kCr=0.62-0.0035CL(Cr)
(a)
(b)
Fig. 2 Relationship between partition ratios (kTi,kCr) and liquid compo-sitions (CL(Ti),CL(Cr)). (a)kTi, (b)kCr.
L12
Al17Cr9
S
S
Fig. 3 An example of EPMA map showing coalescence of secondary arms in Al-25%Ti-6%Cr alloy (d2¼160mm,f¼3650s).
0 10 20 30 40 50
Cr(at%)
(1)CL: k= variable, modified Sheil model( =0)α (2)CL: k=variable: modified Flemings,
Clyne-Kurz, and Ohnaka models (α=θf.D/L2=θf10.8×10-14/d22, L=sd2/2)
Ti(at%)
-Liquidus δ Al3Ti
δ(Al7Ti3)
30 40
Al3 Ti-Liquidus
0 10
20
50
Al17Cr9 -Liquidus
Cr(Cr2Al)-Liquidus TiAlCr-Liquidus
1300°C
1250°C
Al17Cr9
TiAl-Liquidus
L12 -Liquidus
(2)Cs: k=variable: modified Flemings, Clyne-Kurz, and Ohnaka models (α=θf.D/L2=θf.10.8×10-14/d22)
(1)Cs: k=variable, modified Sheil( =0)α
1350°C
Initial liquid(alloy composition) Eutectic liquid
Primary crystal(initial) Primary crystal(eutectic) Second phase(eutectic)
Fig. 4 Calculated solidification-paths of Al-25Ti-10Cr alloy for various modified solidification models (k=variable: modified Flemings, Clyne-Kurz, and Ohnaka models). (d2¼150mm,f ¼2540(s)). In the figure, (1)¼0(D¼0), and (2)¼fD=L2¼f10:81014=d22 with
L¼sd2=2¼d2=2 (s¼1) and D¼Da¼2:71014, or L¼
[image:3.595.54.284.365.656.2] [image:3.595.308.549.550.719.2]approximate equation (6), (7) of the variable partition ratio for Ti and Cr are used in the calculation, but for Ti, the following equation (= upper limit values of Eq. (6)) were used to fit the results best to the experimentally determined solidification-path.10)
kTi¼3:410:155CLðTiÞ þ0:0025CLðTiÞ2 ð10Þ
As shown by the solid line in the figure, the liquid composition (CL) changes from the initial value ( ) to the
L12+Al17Cr9 binary eutectic-line as temperature decreases. When the liquid composition reaches to the eutectic-line ( ), eutectic reaction (L!L12+Al17Cr9) occurs. The eutectic Al17Cr9 is confirmed in the microstructure of experimental specimen. The concentration of this second phase (Al17Cr9) is shown in the figure ( ), and the section of triangle-pipe is also shown as a triangle (thin line) constructed by the eutectic L12phase ( ), the liquid phase ( ) and the eutectic Al17Cr9 ( ). The calculated initial solid concentration (CS(Cr),CS(Ti)) of primary (L12) phase is near the exper-imental value ( ) obtained as the concentration at the center of the primary crystal, indicatingDof solute in this alloy is very small.
For Flemings model B¼2, Clyne-Kurz model
B¼2ð1expð1=ÞÞ expð1=2Þ, and Ohnaka model
B¼2=ð1þ2Þ are used for the analysis, where ¼ Df=L2,f: local solidification time,L: length of volume
element(¼sd2=2, s: structure factor(¼0:51),d2: den-drite arm spacing). The above calculated results are obtained for L¼d2=2 (:s¼1) and D¼Da¼2:71014 (m2/s), and the same result is obtained forL¼d2=4(:s¼0:5) and
D¼De¼0:6751014 (m2/s), since both cases: ¼ fD=L2¼f10:81014=d22. Therefore, -value is used to show the condition of the calculated results.
The calculated result of the modified Scheil model (without D-effect: D¼0) in the figure shows very small difference (:solidification path sifts a little to low-Ti side) from the above results considering theD-effect. Namely, in the case of this DTA-sample (solidified at the cooling rate of 0.05 K/s), the effect of solid diffusion is almost negligible.
To make clear the effect of solid diffusion coefficient (D) and length of volume element (L), the calculated results for the following cases are shown in Fig. 5.
(1) ¼fD=L2¼f10:81014=d22, with L¼d2=2 (s¼1) andD¼Da¼2:71014(m2/s), orL¼d
2=4(s¼ 0:5) and D¼De¼Da=4, (2) ¼fD=L2¼f4 10:81014=d
22, with L¼d2=4 (s¼0:5) and D¼De¼
Da=4, (3)¼fD=L2¼f1010:81014=d22, with
L¼d2=2 (s¼1) andD¼10Da. By using such large D -values as case (3), the difference between the modified models becomes visible.
3.2.2 Effect of the Number of Divisions (n)
In the above analysis with the progressive-type equations, as the sufficient number of divisions (n) offs,n¼400was used to get a consistent result of high accuracy. In this section, the effect of number of divisions (n) is tested, and Fig. 6 shows that the aboven-value (¼400) is needed to get a consistent result for Al-25%Ti-10%Cr alloy. In this figure, the difference of the calculated results becomes smaller for
n>100, and the results for n>300 are almost the same. Therefore,n¼400is enough to get the accurate result, and
we can get the suitable n-value always by this trying-n
method. In the case of small n-value such asn¼5, the error is fairly larger, and becomes close to the result for k = constant (kTi¼1:1, kCr¼0:59), which predicts a second
phase different from the experimental one. Thus, the constant-k model is inapplicable to the present case.
3.3 Analysis of Solidification Path for Various Al-Ti-Cr Alloys.
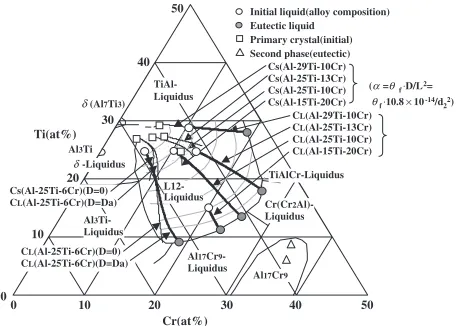
In Fig. 7, calculated solidification paths are shown for various compositions of Al-Ti-Cr alloys. The following results are calculated for L¼d2=2 (:s¼1) and D¼Da¼ 2:71014 (m2/s), and the same results are obtained for
L¼d2=4 (:s¼0:5) and D¼De¼0:6751014 (m2/s) (¼fD=L2¼f10:81014=d22). The variable par-tition ratio (k, Eq. (6), (10)) are employed in the calculation
0 10 20 30 40 50
Cr(at%) Ti(at%)
-δ
Liquidus Al3Ti
δ(Al7Ti3)
30 40
0 10
20
50
Initial liquid(alloy composition) Eutectic liquid
Primary crystal(initial)
Al17Cr9
-Liquidus
Cr(Cr2Al)-Liquidus
L12 -Liquidus
TiAlCr-Liquidus
TiAl-Liquidus
Al3
Ti-Liquidus
Al17Cr9
1300°C
1250°C 1350°C
(3) CL:Modified Flemings model
CL:Modified Clyne-Kurz model
CL:Modified Ohnaka model
(α=θf.D/L2=θf.10.(10.8×10-14/d22))
(2) Modified solidification models (α=θf.D/L2=θf.4.(10.8×10-14/d22))
(1)CL:Modified solidification models
(α=θf.D/L2=θf.10.8×10-14/d22)
CL:Modified Sheil(D=0)
Fig. 5 Effect of the length of volume element (L) and diffusion coefficient (D) on the solidification-path of Al-25%Ti-6%Cr alloy. (d2¼150mm,
f ¼2540 (s)) (1) ¼fD=L2¼f10:81014=d22, with L¼
sd2=2¼d2=2 (s¼1) and D¼Da, or L¼sd2=2¼d2=4 (s¼0:5) andD¼De¼Da=4(2)¼fD=L2¼f410:81014=d22, with
L¼sd2=2¼d2=4 (s¼0:5) and D¼Da (¼4De) (3) ¼
fD=L2¼f1010:81014=d22, with L¼sd2=2¼d2=2 (s¼
1) andD¼10Da.
0 10 20 30 40 50
Cr(at%)
CL: ki(n=20) CL: ki(n=100)
Ti(at%)
-δ
Liquidus Al3Ti
δ(Al7Ti3)
30 40
0 10
20
50
CL: k=const. CL: ki(n=5) Cs: ki(n=20) Cs: ki(n=100) Cs: ki(n=300,500,1000)
CL: ki(n=300,500,1000) Initial liquid(alloy composition) Eutectic liquid
Primary crystal(initial) Primary crystal(eutectic)
Al3 Ti-Liquidus
Al17Cr9 -Liquidus TiAl-Liquidus
TiAlCr-Liquidus
Al17Cr9
L12 -Liquidus Cs: k=const.
Cs: ki(n=5)
Cr(Cr2Al)-Liquidus
Fig. 6 Effect of the change in equilibrium partition ratios (kTi,kCr), andn
(:number of fs divisions for calculation) on the solidification-paths, which were calculated by the modified Clyne-Kurz model (k = variable:ki,
i¼1n) for Al-25Ti-10Cr alloy (¼fD=L2¼f10:8
1014=d
[image:4.595.305.550.75.233.2] [image:4.595.312.541.344.508.2](Modified Clyne-Kurz model). The evaluated solidification path of Al-25%Ti-6%Cr alloy predicts that the liquid composition reaches to the L12-Al17Cr9 eutectic line and Al17Cr9 forms as the second phase. This result agreed well with the microstructure of a DTA specimen (f ¼3560s, d2¼160mm, Tf ¼178K), thus Al17Cr9 formed as the non-equilibrium second phase. On the other hand, in this sample, since the liquid composition at the second phase formation is near the primary liquidus surface of Al3Ti, the calculation by modified Scheil model (neglecting the effect of diffusion: D¼0) predicts Al3Ti as the second phase, which disagreed with the experimental result. Therefore, for these delicate cases, the effect of solute diffusion should be correctly estimated.
The calculated solidification path of Al-25%Ti-13%Cr alloy (f ¼1940s,d2¼140mm,Tf ¼97K), predicts that
Cr(Cr2Al) forms as the second phase, and this result agreed well with the experimental one.
The other calculated results(non-equilibrium second phase) for Al-15%Ti-20%Cr alloy (Al17Cr9), and for Al-29%Ti-10%Cr alloy (TiAlCr), also showed good agreement with each experimental data.
4. Conclusions
To overcome a weak point of past analytical methods such as Flemings equation, Clyne-Kurz equation, and Ohnaka equation using a constant partition ratio (k) to analyze microsegregation of alloys, by using a newly proposed progressive-type solidification equation with solidification parameters: variable partition ratio (k) of solute and diffusion coefficient (D), effective length of volume element (L¼sd2=2, s: structure factor (¼0:51), d2: dendrite arm spacing) and local solidification time (f) obtained by
the experiment, the solidification path of Al-Ti-Cr alloys were analyzed, and the following results were obtained.
(1) Liquid composition (CLi) at the solid fraction (fsi) of a
region iis calculated from the data of (i1) region by the progressive-type solidification equation:CLi¼CLi1 ½f1 ð1Bki1Þfsig=f1 ð1Bki1Þfsi1gðki11Þ=ð1Bki1Þ, whereki1 is partition ratio atCLi1,Bis given as follows:
B¼2 for Flemings model, B¼2ð1expð1=ÞÞ
expð1=2Þ for Clyne-Kurz model, B¼2=ð1þ2Þ for
Ohnaka model for plate-like dendrite, and¼Df=L2,D:
solid diffusion coefficient, f: local solidification time, L:
effective length of volume element (¼sd2=2,s: structure factor (¼0:51)). The above modified equation enabled analysis of precise solidification path by using variable partition ratio (ki) fromi¼1tonin the solidification range
by dividing it with enough number (n) for the precise calculation.
(2) The solidification path of Al-Ti-Cr alloys were analyzed by the above progressive-type solidification equa-tion by using experimentally obtained partiequa-tion ratios (kTi, kCr), which are the functions of liquid compositions, and the
calculated results agreed well with the experimental results. (3) When D values are obtained as a function of composition and temperature, the following progressive-type solidification equation can be used for more precise analysis: CLi¼CLi1 ½f1 ð1Bi1ki1Þfsig=f1 ð1
Bi1ki1Þfsi1gðki11Þ=ð1Bi1ki1Þ, where ki1 is partition ratio at CLi1, Bi1 is given as follows: Bi1¼2i1 for Flemings model, Bi1¼2i1ð1expð1=i1ÞÞ
expð1=2i1Þ for Clyne-Kurz model, and Bi1¼
2i1=ð1þ2i1Þ for Ohnaka model, with i1¼
Di1f=L2.
The authors would like to thank Y. Miura (Kyushu University) for useful discussion and K. Yamada (Kyushu University), M. Ichimaru (master’s course student, now: NTT DATA Corp.), S. Kuwatsuka (master’s course student, now: Nippon Hatsujyo, Inc.) and M. Watanabe (student, now: Fuji xerox, Inc.) for assistance with experiment.
REFERENCES
1) H. D. Brody and M. C. Flemings: Trans. TMS-AIME,236, (1966), 615-624.
2) T. W. Clyne and W. Kurz: Met. Trans. A,12A(1981), 965-971. 3) I. Ohnaka: Trans. ISIJ,26(1986), 1045-1051.
4) N. Mori: Collected Abstracts of the 2000 Spring Meeting of the Japan Inst. of Metals,674(p. 351).
5) M. Ichimaru, N. Mori and Y. Miura: Collected Abstracts of the 2000 Autumn Meeting of the Inst. of Light Metals.
6) N. Mori and K. Ogi: J. Japan Inst. Metals,65(2001), 848-851. 7) H. Mabuchi, K. Hirukawa, H. Tsuda and Y. Nakayama: Scr. Metall.
Mster.,24(1990), 505.
8) S. Zhang, J. P. Nic and D. E. Mikkola: Scr. Metall. Mster.24(1990), 57-61.
9) H. Mabuchi and Y. Nakayama: Intermetallics1(1993), 41. 10) M. Ichimaru, N. Mori and Y. Miura: J. Light Metals,51(2001), 640. 11) N. Mori and K. Ogi: J. Japan Inst. Metals,40(1976), 1276-1283. 12) E. Scheil: Z. Metallk.,34(1942), 70-72.
13) W. G. Pfann: Trans. Met. Soc. AIME,194(1952), 747-754. 14) M. C. Flemings:Solidification Processing, McGraw-Hill, New York
(1974), 290-327
15) H. Mabuchi, H. Tsuda, T. Matsui and K. Morii: Metal. Trans. JIM,38
(1997), 560.
CL(Al-29Ti-10Cr) CL(Al-25Ti-13Cr) CL(Al-25Ti-10Cr) CL(Al-15Ti-20Cr)
0 10 20 30 40 50
Cr(at%) Ti(at%)
0 10
20 30
40 50
Al3Ti
Cs(Al-29Ti-10Cr) Cs(Al-25Ti-13Cr) Cs(Al-25Ti-10Cr) Cs(Al-15Ti-20Cr) Initial liquid(alloy composition) Eutectic liquid
Primary crystal(initial) Second phase(eutectic)
(Al7Ti3)
δ
TiAlCr-Liquidus
Cr(Cr2 Al)-Liquidus
Al17Cr9 Al17Cr9 -Liquidus Al3
Ti-Liquidus -Liquidus
δ
TiAl-Liquidus
Cs(Al-25Ti-6Cr)(D=0) CL(Al-25Ti-6Cr)(D=Da)
CL(Al-25Ti-6Cr)(D=0) CL(Al-25Ti-6Cr)(D=Da)
L12-Liquidus
(α=θf.D/L2= θf.10.8×10-14/d22)
Fig. 7 Solidification-paths of various Al-Ti-Cr alloys calculated by the modified solidification model (k = variable, ¼fD=L2¼
[image:5.595.55.285.73.236.2]