Transient Liquid Phase Bonding of Nitrogen Containing Duplex
Stainless Steel UNS S31803 Using Ni–Cr–Fe–Si–B Insert Metal
Byongho Rhee
1;*, Sungjoo Roh
2and Dohyang Kim
1 1Department of Metallurgical Engineering, Yonsei University, Seoul 120-749 Korea
2Vitzrotech Co., Ltd. 605-2 Sunggok Dong, Ansan City, Gyunggi-Do, Korea
Microstructural evolution during transient liquid phase (TLP) bonding of nitrogen containing duplex stainless steel UNS S31803 has been investigated. In order to evaluate mechanical property of joint, tensile strength test was carried out at room temperature. TLP bonding was conducted at the temperature range 1283–1353 K for 0–1000 s under a vacuum of 6.7 mPa using Ni–7 mass%Cr–3 mass%Fe–4.5 mass%Si– 3.2 mass%B amorphous insert metal. The results show that the volume fraction of austenite () decreased with increasing bonding temperature and holding time. Particularly, in the case of prolonged holding time, the depleted area ofphase was observed in the base metal adjacent to joints. There were linear correlations between the width of the remaining liquid phase and square root of holding time at each bonding temperature. In this investigation, the secondary phases formed in the joint area were (Cr, Mo) borides dominantly. For the specimen bonded for longer time up to 1000 s, boron nitride formed at the center and interface of joint area, on the other hand, the amount of borides decreased compared with the case of shorter bonding time. Tensile strength increased with holding time, and the bonding efficiency was94% for the specimen held for 1000 s at 1353 K. Tensile strength of joint depended on, for a short holding time, brittle eutectic and borides, and after completion of isothermal solidification, depended on the boron nitride formed at the joint interface.
(Received January 20, 2003; Accepted March 25, 2003)
Keywords: Transient liquid phase bonding; Duplex stainless steel; Ni–7 mass%Cr–3 mass%Fe–4.5 mass%Si–3.2 mass%B amorphous Insert
metal
1. Introduction
Although commercial austenitic stainless steels have superior general corrosion resistance and low temperature impact toughness, crevice corrosion and stress resistances are poor in chloride-containing environments. Therefore, the application of the austenitic stainless steels to environments that are not severely corrosive has been limited. On the other
hand, the duplex stainless steels containing both ferrite ()
and austenite () phases have better localized corrosion
resistance than the single-phase austenitic stainless steels in chloride containing solution. In addition, as compared with the austenitic stainless steels, the duplex stainless steels have lower cost performance because of the lower nickel content. Therefore, the application area of the duplex stainless steels as structural materials in various industrial sectors has been
increased steadily.1–3)
However, when inappropriate thermal cycle is adopted
during the fabrication process, such as fusion welding, -
ratio may be changed together with the precipitation of
intermetallic compounds (e.g. phase, phase, Cr23C6,
Cr2N, etc.), reducing mechanical property and corrosion
resistance of original materials. It is, therefore, strongly required that the thermal cycle should be controlled precisely to optimize the mechanical property and corrosion resistance of the joints.
TLP bonding has been known as one of the methods capable of controlling thermal cycle precisely. The process involves using an interlayer that melts at the bonding temperature. With a sufficient holding time at the bonding temperature, the interdiffusion of solutes (melting point depressant) at the liquid filler-base metal interface results in
isothermal solidification. Subsequently, given a suitable homogenization treatment, the microstructure and mechan-ical properties of the joint can resemble those of the base
metal.4) Most of works on TLP bonding have been
concentrated on Ni base superalloys.5–7) But, very few
research results have been reported on the TLP bonding of duplex stainless steels, although their applications have been
increasing. Kanget al.reported on brazing duplex stainless
steel UNS S32550 using Ni base insert metal. They suggested that at the initial stage of bonding eutectic phases were not formed, and isothermal solidification process is controlled by
the formation of boron nitrides.8)
In this work, during TLP bonding of duplex stainless steel UNS S31803 using Ni–Cr–Fe–Si–B insert metal, change of austenite fraction in the base metal, mechanism of isothermal solidification and formation of secondary phases were investigated. Effects of microstructures of joints on the mechanical property were discussed.
2. Experimental Procedure
Duplex stainless steel used in this work was UNS S31803 grade in the form of bar, manufactured by AVESTA. The supplied duplex stainless steel bar was annealed at 1343 K for
10 min, followed by water quenching. Chen et al. reported
that the temperature range of 1293–1353 K is suitable for the solution treatment in a 2205 duplex stainless steel (UNS S31803) to dissolve the secondary precipitates without
affecting the balance of matrix phases.9) Therefore, Ni–Cr–
Fe–Si–B amorphous insert metal (thickness 40mm),
appro-priate for bonding in the above temperature range and with good corrosion resistance, was used. The compositions of the
materials in the present study are shown in Table 1.
The specimens with dimension of 10 mm diameter and 10 mm length were machined from the bar. Their faying
*Corresponding author: Vitzrotech Co., Ltd. 605-2 Sunggok-Dong,
Ansan-City, Gyunggi-Do, Korea. E-mail: [email protected] 2003 The Japan Institute of Metals
surface was perpendicular to the drawing direction. They were ground with 1200 grit silicon carbide emery paper to
maintain the flatness of 2mm. All specimens were
degreased with acetone in an ultrasonic cleaner after
grinding. 40mm spacer was inserted between the faying
surfaces to maintain parallel and unrestrained liquid width
during bonding (Fig. 1). TLP bonding was conducted at the
temperatures ranging of 1283–1353 K for 0–1000 s under a vacuum of 6.7 mPa. A heating rate of 10 K/s and an average cooling rate of 20 K/s from bonding temperature to 1073 K were used.
Cross-sections of joints were prepared for microstructure examination. The cross-sections were electrolytically etched
at 7 V in 10 N of NaOH solution to observeandphases of
the base metal and at 4.5 V in 5 vol% of H2SO4 solution to
observe the microstructure of the joints. Microstructures were investigated using optical microscope (OM) and scanning electron microscope (SEM). Compositions were analyzed using energy dispersive X-ray spectroscopy (EDS) and electron probe X-ray microanalyzer (EPMA). Volume
fraction of thephase and width of the remained liquid phase
were measured using an image analyzer.
Tensile strength tests were carried out at room temperature with the crosshead speed of 1 mm/min of speed. Fractured surfaces and cross-sectional microstructures were investiga-ted using OM and SEM.
3. Results and Discussion
3.1 Microstructures of base metals
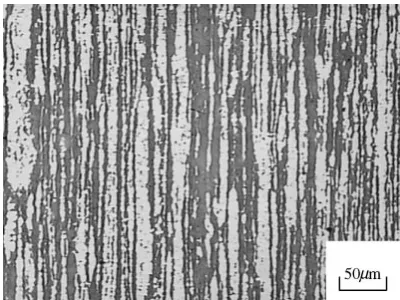
Figure2 shows the optical microstructure of the duplex
stainless steel used in the present study. The light and dark
phases areand, respectively. The volume fraction of the
phase measured by the image analyzer was about 50%.
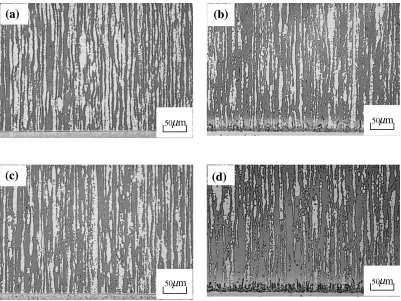
Figure3 shows the optical microstructures of the base
metals bonded at 1283 K and 1353 K, for respectively 0 s and
1000 s. Figures4(a) and (b) show the variations of the volume
fraction of phase in the base metal adjacent to the joint
interface after bonding at 1283 K and 1353 K, respectively. In case of a holding time of 0 s at 1283 K, the microstructure of
base metal is similar to original material (Fig. 3(a)). (Zero
second means that, immediately after the bonding tempera-ture reaches the set value, heating is interrupted.) However,
volume fraction of phase decreased with increasing
bonding temperature and holding time. This is because that
during bonding a part of the originalphase was dissolved,
and cooling rate was too fast to reform phase during
cooling. Liouet al. reported that the amount of reformed
phase increased with increasing cooling time between 1073 K
and 773 K and the reformation of phase is controlled by
diffusion of stabilizing elements, such as N and Ni.10)In
case of prolonged holding time,depleted area was observed
in the base metal adjacent to joints (Figs.3(b) and (d)). The
depletion of thephase can occur sincestabilizing element
(N) contained in the base metal diffuses into the insert metal,
while stabilizing element (Si) diffuses into the base metal
during bonding.
3.2 Microstructures of joints and isothermal solidification
Figure5shows the optical microstructures of joints at each
temperature with the holding time of 0 s. As can be seen in Fig.5, dissolution of base metal occurred uniformly at all bonding temperatures. The rate of dissolution increased with increasing the bonding temperature.
Figure6 shows SEM microstructure of the remaining
liquid phase after bonding at 1313 K for 30 s. As can be seen
in Fig.6(b), the remaining liquid phase consisted of massive
phase (marked B) and lamellar structure (marked C). Since the composition of insert metal used in the present study is close to eutectic composition, the lamellar structure in Fig. 6(b) is formed by eutectic reaction of -Ni solution and intermetallic compound. The eutectic structure is known to be detrimental to mechanical properties due to its
brittle-ness.11)
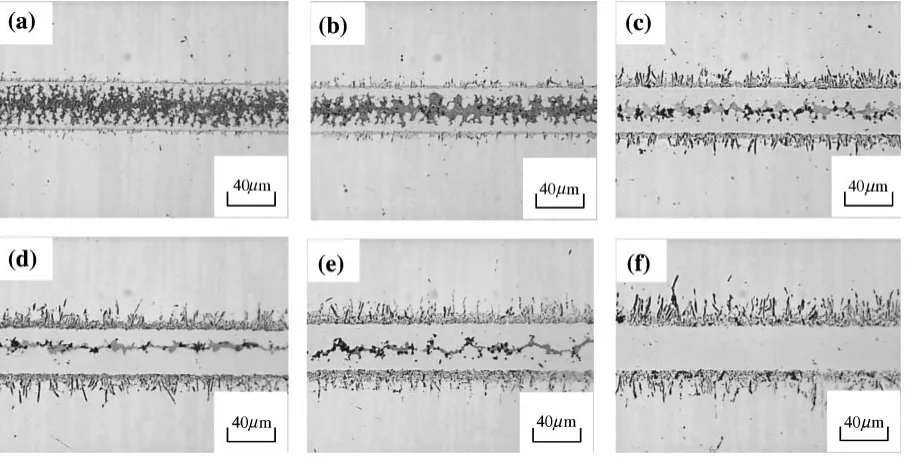
The effects of holding time on the microstructures of joints
at 1313 K are shown in Fig. 7. The width of the remaining
liquid phase decreased with increasing holding time. After bonding for 1000 s, remaining liquid phase was not observed.
As can be seen in Fig.7, in spite of the holding time up to
[image:2.595.326.526.71.221.2]1000 s the width of the joint was nearly constant, which Table 1 Chemical composition of materials used (mass%).
Materials B N Mn Si Ni Cr Mo Fe
Base metal UNS S31803 0.16 1.46 0.56 5.04 22.75 3.19 bal.
Insert metal MBF-20 3.2 4.5 bal. 7 3
Fig. 1 Schematic illustration of TLP bonding specimen.
[image:2.595.59.285.77.298.2]0 200 400 600 800 1000 15
20 25 30 35 40 45 50
Distance from Base Metal/Bonded Interlayer Boundary, d/µm
A
u
stenite Phase
V
o
lume F
raction(%)
A
u
stenite Phase
V
o
lume F
raction(%)
1283K(0 s) 1283K(100 s) 1283K(1000 s)
0 200 400 600 800 1000
15 20 25 30 35 40 45
1353K(0 s) 1353K(100 s) 1353K(1000 s)
Distance from Base Metal/Bonded Interlayer Boundary, d/µm 50
(a) (b)
Fig. 4 Variation of austenite phase volume fraction in base metal after bonding.
Fig. 3 Optical microstructures of the base metal in the vicinity of joints; (a) 1283 K–0 s, (b) 1283 K–1000 s, (c) 1353 K–0 s, (d) 1353 K–1000 s.
[image:3.595.98.499.70.371.2] [image:3.595.80.518.431.593.2] [image:3.595.75.522.646.756.2]indicates that the base metal dissolution is completed at the early stage (0 s) during bonding. The same type of behavior was observed for the joints bonded at 1283 K and 1353 K.
The variations of the width of the remaining liquid phase with holding time at each bonding temperature are shown in Fig.8. During TLP bonding, the disappearance of liquid in joints starts after the dissolution of the base metal is
completed.12) Since the dissolution of the base metal is
completed at the early stage (Fig. 7), the disappearance of the
liquid was considered to start just after the bonding
temperature was reached. As can be seen in Fig.8, there
were linear correlations between the width of the remaining liquid phase and square root of the holding time at each bonding temperature. The decreasing rate of the liquid phase became higher with increasing bonding temperature. It indicates that the process of isothermal solidification is controlled by diffusion. Generally, in TLP bonding process, isothermal solidification is controlled by diffusion of melting point depressant contained in the insert metal. It can be easily verified that isothermal solidification is controlled by
diffu-Fig. 6 SEM microstructures of the joint area after bonding at 1313 K for 30 s; (a) joint area, (b) enlarged of A area marked in (a).
Fig. 7 SEM microstructures of the joint area after bonding at 1313 K for; (a) 0 s, (b) 30 s, (c) 100 s, (d) 250 s, (e) 500 s, (f) 1000 s.
0 5 10 15 20 25 30 35 40
0 5 10 15 20 25 30 35 40 45 50
Holding Time, t/s1/2
Remaining Liquid Phase
Width, w/
µ
m
1283K 1313K 1353K
[image:4.595.97.501.71.223.2] [image:4.595.73.526.276.505.2] [image:4.595.308.546.555.734.2]sion of the solute element in the binary system. In multi-component system, however, the situation is more complex. Since the materials used in this work are multi-component system, the isothermal solidification is controlled by complex diffusion reaction of several elements and compound forma-tion reacforma-tion.
Meanwhile, in case that initial substance having C0
concentration exists in finite area namely, h<x<h, the
concentration distribution with time can be expressed by
eq. (1).13)
Cðx;tÞ ¼C0=2½erfððhxÞ=ð2ðDtÞ1=2ÞÞ
þerfððhþxÞ=ð2ðDtÞ1=2ÞÞ ð1Þ
where,D; diffusion coefficient,t; time, andx; distance.
Here, it is assumed that the base metal is pure Fe. When melting point depressant elements (Si, B) in insert metal
diffuse into the base metal, concentration (Cp) variation at
the center of the insert metal calculated by eq. (1) is shown in Fig.9. Here, insert metal thickness (2 h) is 40mm, and the initial concentrations of Si, B are 4.5 mass% and 3.2 mass% respectively. Diffusion coefficients of Si and B in pure Fe
were calculated using vibration factor (D0Si¼
7:4105m2/s, D
0B¼2:6107m2/s) and activation
energy (QSi¼220kJ/mol,QB¼95kJ/mol).14)
From the result of EDS analysis, the average concentration of Si in the isothermally solidified joint area adjacent to
solid-liquid interface was 3:2mass%. In the case of boron,
quantitative analysis was difficult due to presence of small
amount. Therefore, content of boron in-Ni was assumed to
be 0.3 at%, which is the maximum solubility of boron in the Ni–B binary system. Concentration variations of Si and B in
the joint area are shown in Fig.9. Isothermal solidification
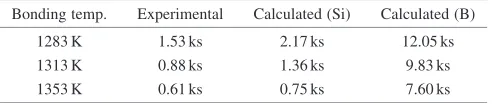
completion times calculated by the diffusion equation, and
extrapolated by experimental result are compared in Table 2.
Experimentally extrapolated time was shorter than those calculated by diffusion equation at all bonding temperature. This can be regarded because of the difference between actual complex reaction in multi-component system and simple model calculation. However, in the case of calculation of Si diffusion model, isothermal solidification completion
time can be predicted more accurately by calculation than the case of B diffusion model.
3.3 Formation of secondary phase at joint and joint-base metal interface.
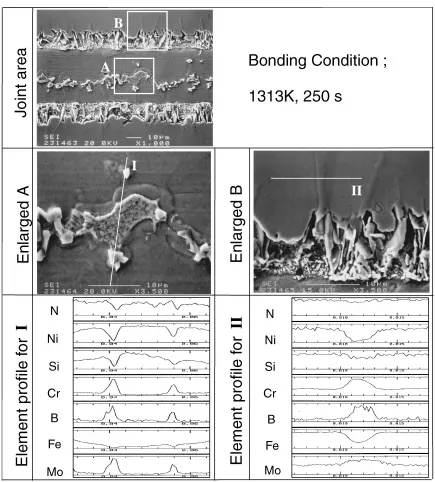
Figure10 shows SEM microstructures and element
dis-tribution of the joint area bonded at 1313 K for 250 s. As can be seen in the enlarged image of A and B, The secondary phases formed in the joint area (marked A) and in the base metal adjacent to the joint area (marked B). EPMA analysis showed that the lump-shaped phase in the joint area (marked A) and the rod-shaped phase in the base metal were enriched in Cr, Mo, B elements. Therefore, it is considered that the secondary phases are mainly (Cr, Mo) borides. The
rod-shaped phase in the base metal grew along the - grain
boundary dominantly.
On the other hand, Fig.11shows SEM microstructure of
the joint area bonded at 1313 K for 1000 s. Although isothermal solidification was completed, there were still secondary phases at the center of the joint. Particularly, the secondary phase other than what were observed in the joint area bonded at 1313 K for 250 s appeared clearly in the joint area. EPMA analysis showed that the secondary phases were enriched in B, N elements. Therefore, it is considered that the secondary phase is B nitride. In the vicinity of the joint interface, there were two shape B nitrides. One close to the insert metal is a small spherical shape, and another close to the base metal is a massive shape.
The (Cr, Mo) boride (dark phase in Fig.7) was
continu-ously coarsened with increasing holding time up to 100 s. However, the fraction of the (Cr, Mo) boride decreased after bonding for 100 s. Then, the B nitride at the joint interface coarsened with increasing holding time up to 1000 s. At the center of the joint, the B nitride coarsened with the shrinkage
of the (Cr, Mo) boride (Fig.11). Still, the amounts of (Cr,
Mo) borides were dominant.
The mechanism of the formation of the secondary phases in the joint area during bonding is as follows. At the early stage of bonding, base metal is dissolved with the reaction of base metal and insert metal at the joint interface. The elements contained in the dissolved base metal, such as Fe,
Cr, Mo, N, etc diffuse into liquid insert metal, and the
elements contained in the liquid insert metal, such as Ni, Si,
B,etcdiffuse into base metal. In the process, the stable phase,
which is the lowest Gibbs free energy, is formed
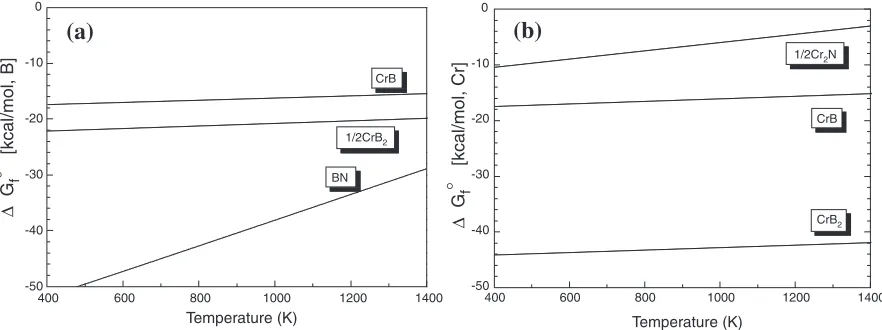
preferen-tially. Figure12 shows the standard Gibbs energies for
formation of borides and nitrides calculated by
thermody-namic data.15)As can be seen in Fig.12(a), B nitride is more
stable than Cr borides. Therefore, the B nitride is formed preferentially at the join interface. Although B nitride is stable thermodynamically, since the content of nitrogen contained in the base metal is meager, its quantity is very
0 2000 4000 6000 8000 10000
0 1 2 3 4 5 1353K 1313K 1283K Boron Cp(mass%)
Holding Time, t/s
Silicon
[image:5.595.305.551.85.137.2]Fig. 9 Concentration (Cp)-time curves at the center of the joint area (calculated by eq. (1)).
Table 2 Completion time for isothermal solidification.
Bonding temp. Experimental Calculated (Si) Calculated (B)
1283 K 1.53 ks 2.17 ks 12.05 ks
1313 K 0.88 ks 1.36 ks 9.83 ks
[image:5.595.50.287.576.757.2]small.
In the case that a specimen (the sink of solute) of
compositionC1between specimens (the source of solute) of
compositionC0exists in finite area namely,h<x<h, the
concentration profile is given by eq. (2), which is converted from eq. (1).
Cðx;tÞ ¼C0C0=2½erfððhxÞ=ð2ðDtÞ1=2ÞÞ
þerfððhþxÞ=ð2ðDtÞ1=2ÞÞ þC1
ð2Þ
where,D; diffusion coefficient,t; time, andx; distance.
Here, it is assumed that the insert metal is pure Fe (C1 ¼0)
and there is no the dissolution of the base metal. When nitrogen contained in base metal diffuses into the insert metal at 1313 K, the concentration profile of nitrogen calculated by
eq. (2) is shown in Fig.13. The concentration profile of boron
in Fig. 13 was calculated by eq. (1). Here, insert metal
thickness (2 h) is 40mm, and the initial concentrations of N, B
are 0.63 at% and 14.50 at% respectively. Diffusion
coeffi-cient of nitrogen in pure-Fe was calculated using vibration
factor (D0N¼3:6105m2/s) and activation energy
(QN¼157kJ/mol).14)
The secondary phases forming in the joint area during bonding can be predicted as following. As can be seen in Fig. 13(a), at the early stage of bonding, nitrogen and boron coexist only in the vicinity of the joint interface. The content of nitrogen diffused into the insert metal is very small compare with boron. Therefore, the excess boron after
forming B nitride diffuses into base metal along the-grain
boundary preferentially, and Cr borides with the reaction of the excess boron and Cr contained in the base metal were
formed. As can be seen in Fig.12(b), Cr borides are more
[image:6.595.80.515.66.548.2]Fig. 11 SEM microstructures of the joint area and element profiles analyzed by EPMA.
400 600 800 1000 1200 1400
-50 -40 -30 -20 -10 0
BN 1/2CrB2
Temperature (K)
CrB
400 600 800 1000 1200 1400
-50 -40 -30 -20 -10 0
CrB2 CrB 1/2Cr2N
Temperature (K)
(a)
(b)
∆
G
f
°
[kcal/mol, B]
∆
G
f
° [kcal/mol, Cr]
[image:7.595.79.520.602.767.2]formed inside the joint are (Cr, Ni, etc.) borides. Here, Mo
detected by EPMA in Fig.10 is not considered. With
increasing holding time, the quantity of B nitride in the joint area is increased. However, for a short holding time (Fig. 13(b)), since the content of boron is still richer in the joint area, the fraction of boride is dominant. For 1000 s (Fig. 13(c)), the fraction of boride decreases with increasing the fraction of nitride. This coincides well with experimental
result (Fig.11).
Meantime, as can be seen in Fig. 11, the B nitride was
richer in the joint interface than inside joint. It is considered that most of nitrogen reacts with boron in the joint interface prior to the diffusion of nitrogen into the joint, and the isothermal solidified layer roles as the diffusion barrier of nitrogen.
3.4 Tensile strength of joints
The result of the tensile strength test for specimens, held for 0 s, 100 s and 1000 s at each bonding temperature, is
shown in Fig.14. The bonding efficiency was94% for the
specimen held for 1000 s at 1353 K. Tensile strength increased with holding time at all bonding temperature,
since the amount of brittle eutectic and borides decreased
with holding time. Figure 15shows SEM microstructure of
the joint area bonded at 1313 K for 50 s. It can be seen that the crack occurred at the center region of the joint layer. This is considered that the crack occurs because of stress induced by shrinkage during solidification of the remaining liquid phase. However, the crack was not observed in the joint area bonded for more than 100 s, because of the decrement of the amount of brittle eutectic and borides. Therefore, the tensile strength of the joint abruptly increased by prolonging the holding time more than 100 s.
SEM microstructures of the cross section and fractographs of fractured surface after the tensile test of the specimen
bonded at 1313 K are shown in Fig.16. In the case of 0 s
holding time, fracture occurred at the center of the joint where liquid phase remained. Fracture mode was brittle-flat mode without plastic deformation. In the case of 100 s holding time, ductile dimple mode at the joint interface and brittle-flat mode at the center of the joint was observed. In the case of 1000 s holding time, full ductile dimple mode was observed at the joint interface. In this case, from SEM micrograph and EPMA analysis, it can be seen that the fracture of the joint occurs in the place of B nitride formed at the joint interface. These results indicate that tensile strength of joint depended on, for a short holding time, brittle eutectic and borides, and after completion of isothermal solidification, depended on the boron nitride formed at the joint interface. -50 -40 -30 -20 -10 0 10 20 30 40 50
0 2 4 6 8 10 12 14 16 B M
B M I M
Nitrogen
Concentr
ation, at%
Distance, d/µm
Boron
-300 -200 -100 0 100 200 300 0.0 0.5 1.0 1.5 2.0 2.5
Distance, d/µm
Concentr
ation, at%
Nitrogen Boron
-300 -200 -100 0 100 200 300 0.0 0.5 1.0 1.5 2.0 2.5
Distance, d/µm
Concentr
ation, at%
Nitrogen Boron
[image:8.595.51.548.74.203.2](a) (b) (c)
Fig. 13 Nitrogen and boron distribution calculated by eqs. (1) and (2) in BM(Base Metal)-IM(Insert Metal)-BM couple at 1313 K for; (a) 0.1 s, (b) 100 s, (c) 1000 s.
0 200 400 600 800 1000
0 100 200 300 400 500 600 700 800 900 1000 Base Metal T e nsile Strength, σ /MP a
Holding Time, t/s
1283K 1313K 1353K
[image:8.595.325.528.268.415.2]Fig. 14 Tensile strength test results of the bonded materials for the different temperature and holding time.
[image:8.595.51.291.565.741.2]4. Conclusions
(1) The volume fraction of phase in the base metal
decrease with increasing bonding temperature and holding time. Particularly, in the case of prolonged
holding time, the depleted area ofphase is observed in
the base metal adjacent to joints. It is considered
becausestabilizing element (N) contained in the base
metal diffuses into the insert metal, whilestabilizing
element (Si) diffuses into the base metal during bonding.
(2) Isothermal solidification has a linear correlation with
holding time1=2. The isothermal solidification behavior
occurs with complex reactions of constituents, but is mainly controlled by diffusion of melting point depres-sant elements. Especially, in the case of calculation of Si diffusion model, isothermal solidification completion time can be predicted more accurately by calculation than the case of B diffusion model.
(3) In this investigation, the secondary phases formed in the joint area are (Cr, Mo) borides dominantly. For the specimen bonded for longer time up to 1000 s, boron nitride forms at the center and interface of joint area, on the other hand, the amount of borides decreased compared with the case of shorter bonding time. It is considered that the formation of boron nitride depends on diffusion of nitrogen and boron. Borides formed in
joint-base metal interface grow along-grain
bound-ary preferentially.
(4) Tensile strength increases with holding time up to 1000 s at all bonding temperature. The highest bonding
efficiency is94% (for the specimen held for 1000 s at
1353 K). Tensile strength of joint depends on, for a short holding time, brittle eutectic and borides, and after completion of isothermal solidification, depends on the boron nitride formed at the joint interface.
REFERENCES
1) J. O. Nilsson: Mater. Sci. Technol.8(1992) 685–700.
2) H. D. Solomon and T. M. Devine: R. A. Lura (Ed), Duplex Stainless Steel, ASM (1982) pp. 693–756.
3) N. Lopez, M. Cid and M. Puiggali: Corros. Sci.41(1999) 1615–1631. 4) T. I. Khan and E. R. Wallach: J. Mater. Sci.31(1996) 2937–2943. 5) H. Ikawa and Y. Nakao: Trans. Japan Welding Society8(1977) 3–8. 6) Y. Nakao, K. Nishimoto, K. Shinozaki and C. Y. Kang: Proceedings
Superalloys ’89, (Metall. Soc. AIME, 1989) 775–783.
7) W. F. Gale and S. V. Orel: Metall. Trans. A27A(1996) 1925–1931. 8) C. Y. Kang, C. S. Woo, T. K. Han, C. H. Hong, D. U. Kim and Y. C.
Woo: Proc. Conf. ‘2001 International Brazing & Soldering’, Yangz-hong, China, 148–155.
9) T. H. Chen and J. R. Yang: Mater. Sci. Eng. A311(2001) 28–41. 10) H. Y. Liou, R. I. Hsieh and W. T. Tsai: Corrosion Science44(2002)
2841–2856.
11) X. W. Wu, R. S. Chandel, H. P. Seow and H. Li: J. Mater. Proc. Technol.113(2001) 215–221.
12) K. Saida, Y. Zhou and T. H. North: J. Japan Inst. Metals58(1994) 810– 818.
13) J. Crank: The Mathematics of Diffusion, (Oxford University Press, 1975) pp. 13–16.
14) The Japan Institute of Metals:Metals Data Book, (Maruzen, 1993) pp. 21–22.