Effect of Initial Grain Orientation on Evolution of Deformed Microstructure
in Hot Compressed Ni-30Fe Alloy
Jae-Young Cho
1;2, Tadanobu Inoue
1, Fuxing Yin
1and Kotobu Nagai
11
Steel Research Center, National Institute for Materials Science, Sengen, Tsukuba 305-0047, Japan 2School of Materials Science and Engineering, Seoul National University Shinrim-dong,
San 56-1, Kwanak-ku, Seoul 151-742, Korea
An experimental procedure has been developed to investigate systematically the effect of initial grain orientation on the evolution of deformed microstructure in Ni-30Fe alloy. The investigation of identical grains before and after hot deformation made it possible to trace the evolution of microstructure deformed up to 50% at a strain rate of 1/s in a single pass at 1023 K using a hot compression simulator. The localized inhomogeneous shear bands occurred in almost all grains. On the other hand, the nearf110gh001igrains have undergone fairly homogeneous deformation even after a high equivalent plastic strain of 1.9.
(Received April 6, 2004; Accepted August 12, 2004)
Keywords: nickel-30 ferrous alloy, shear band, hot deformation, electron back-scattering diffraction pattern, Goss orientation
1. Introduction
In recent years, two kinds of approaches to ultrafine-grained steels have been suggested. One is the heavy deformation of austenite in non-recrystallized region, which results in the dynamic transformation of unstable austenite to ultrafine ferrite grains1–3) and the other is to introduce the accumulation of strains into ferrite grains by severe warm deformation, which induces the recovered or recrystallized ultrafine ferrite grains.4–7)
The key element in the method of heavy deformation of austenite in non-recrystallized temperature region is to increase the density of localized inhomogeneous deformation defects within austenite grains. But it is very difficult to investigate systematically the deformation defects in the austenite of the low carbon steel because the austenite grains are transformed to martensite or bainite during quenching to room temperature.
Since Charnock and Nutting8)reported the stacking fault energy across the iron-nickel system, there have been a number of investigations on the deformed structures of austenite using the austenitic Ni-30Fe alloy which has the stacking fault energy and the deformation characteristics similar to those of low carbon austenite. Hurley et al.9)
studied the deformed structures of the austenite through hot compression and torsion tests, and Adachi et al.10) inves-tigated the deformed substructure of austenite by hot compression test of the Ni-30Fe alloy. Recently, Suh et al.11) studied the change of deformed microstructure of austenite at various strains, strain rates and deformation temperatures using the Ni-30Fe alloy.
In general, the subdivision of grains during deformation takes place macroscopically with the formation of shear bands and microscopically with the formation of cell blocks and cells.12)The deformed structures may vary considerably depending on processing variables such as strain, strain rate and deformation temperature and material variables such as stacking fault energy and grain size. Furthermore, consider-ing the crystallographic nature of plastic deformation, the development of deformed microstructure can be greatly
affected by the initial grain orientation relative to the imposed deformation conditions. Accordingly, the present work aims to investigate the effect of initial grain orientation on the evolution of the deformed microstructure of the Ni-30Fe alloy on a macroscopic scale using SEM and EBSD technique.
2. Experimental
2.1 Specimen preparation
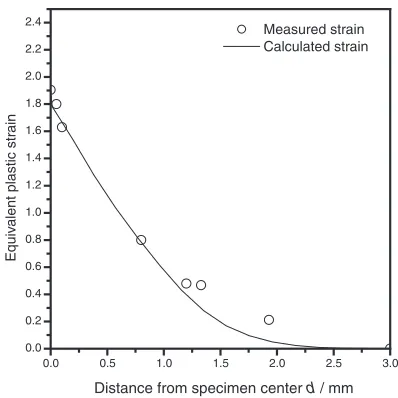
The ingot of Ni-30Fe alloy was prepared in a 50-kg vacuum induction melting furnace. The chemical composi-tion of Ni-30Fe alloy is given in Table 1. The ingot was re-heated to 1473 K and hot rolled to make a plate with a size of T60W140L550(mm). The final rolling was performed at the temperature of 1243 K. Rectangular specimens that were 12 mm in thickness, 7.5 mm in width and 20 mm in length were machined from the hot rolled plate for hot compression test. Two blocks of specimens were assembled together by bolts and nuts to form a 15 mm wide specimen as shown in Fig. 2, which made it possible to observe the inner contacting surface after deformation.
2.2 Hot compression test
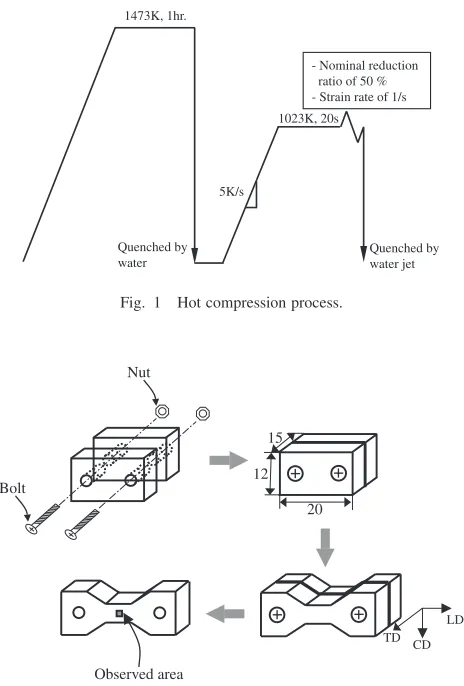
Figure 1 shows the path of the hot compression test. A high temperature deformation simulator (DSI, Gleeble 2000) was used for the thermo-mechanical treatment. The specimen was put into a furnace maintained at 1473 K and held for 1 hour to allow the initial grain size to grow to about 450mm, followed by water quenching to room temperature. Then the specimen was heated to 1023 K and held for 20 seconds to make the specimen temperature uniform and then deformed by a reduction ratio of 50% at a strain rate of 1/s. The deformation temperature of 1023 K is known to be in the
non-recrystal-Table 1 Chemical compositions of specimen (in mass%).
C Mn Si P S Ni Fe
0.002 <0:002 0.008 0.002 0.001 69.8 Bal.
[image:1.595.303.552.755.782.2]lized region.13)The specimen was quenched to room temper-ature by water jet immediately after the compression to freeze the deformed microstructure.
2.3 Observation of microstructural characteristics
The metallographic examination was performed by optical microscopy and scanning electron microscopy (SEM JEOL 5400). The microstructural observation was carried out on the center of the specimen parallel to the compressive direction, which is known to have a plane strain condition according to FEM analysis of this specimen geometry by Inoueet al.,14)as shown in Fig. 2. The specimens were first electropolished and etched for 20 seconds using a solution containing HCl (10 ml), FeCl3 (5 g) and ethanol (40 ml), by which {111} planes were attacked most slowly and consequently revealed. The measurement of grain orientation was carried out by a scanning electron microscope (LEO Gemini 1550) equipped with TSL EBSD system. The specimens for the EBSD examination were ground with SiC papers and mechanically polished with a 1mm alumina paste, and then they were electrochemically polished for 20 s with a solution of 10% perchloric acid in ethanol.
3. Results and Discussion
3.1 Strain distribution
Figure 3 shows the change of the specimen shape by the
assembled specimen is relatively smooth compared with the sides (Fig. 3(c)). The cross-section could be investigated after a slight grinding. Therefore, if the microstructure of the cross-section before compression is observed, it becomes possible to compare the microstructures of identical grains before and after the hot compression test. Figure 4 shows one example of the deformed microstructure after 50% deforma-tion at 1023 K and a strain rate of 1/s. The micrograph corresponds to the hatched area of the deformed specimen. According to FEM analysis of this specimen geometry by Inoue et al.,14) there is a large plastic strain in the regions towards the anvil edges from the original point and the plastic strains in the y direction show a plane strain condition ("xxþ"yy¼0,"zz¼0). In the present study, the
investiga-tion of strain was carried out along the compression axis, that is, in the y direction. The initial grain size,do, at each position was measured. Then the experimental measurement of the compressive strain "yy was carried out from lnðd=doÞ by measuring the size, d, of the identical grain after hot compression test. The measured compressive strain "yy was
converted into the equivalent plastic strain "eq using
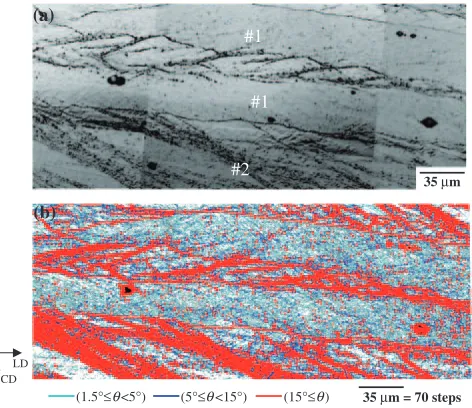
2=p3"yy. Figure 5 shows the measured equivalent plastic
strain and the calculated strain. The equivalent plastic strain obtained from the experimental measurement showed a good agreement with the calculated strain.
In this study, the positions in the range of 0–100mmfrom the center corresponding to the compressive strain range of 1.65–1.9 were chosen for investigating the effect of initial grain orientation on the evolution of the deformed micro-structure after hot compression test.
3.2 Deformed microstructure
Figure 6(a) represents an initial microstructure of the specimen. The initial grain size is about 450mm. The schematic drawing of Fig. 6(a) is shown in Fig. 6(b). Figure 6(c) shows the microstructure in the same region as Fig. 6(a) after 50% deformation at 1023 K and a strain rate of 1/s. Figure 6(d) shows the schematic drawing of Fig. 6(c). The indexing numbers in Fig. 6 mean the identical grains before and after deformation. From Figs. 6(a) and (c), grains #10, #11 and #12 that are slightly deformed can be easily discriminated before and after deformation. Once some grains are discriminated, the neighboring grains like grain #9 can be easily discriminated even though they are heavily deformed. In this way, we distinguished the identical grains before and after 50% deformation. The laminar elongation of the structure is evidently parallel to the longitudinal direction as can be seen in Fig. 6(c). There are numerous dark etching shear bands lying at 30–40 to the longitudinal direction across almost all the grains, signifying the localized inhomogeneous deformation. Even though the microstruc-ture of grain #1 is considerably elongated, no shear bands are observed. Figure 7 represents an SEM micrograph, which confirms the presence of shear bands in grain #2 and their absence in grain #1.
3.3 Orientation analysis by EBSD
As seen in Fig. 8(a), the optical micrograph shows the Observed area
Bolt
Nut
20 12
15
LD
TD CD
Fig. 2 Schematic drawing of compression test and observed area of deformed specimen.
1023K, 20s
- Nominal reduction ratio of 50 % - Strain rate of 1/s
Quenched by water jet Quenched by
water
5K/s
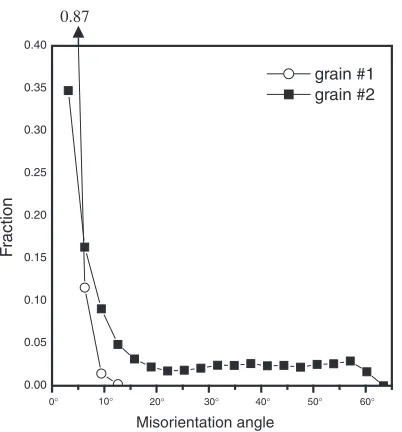
[image:2.595.53.285.69.412.2]magnified area including grains #1 and #2 deformed to a strain of about 1.65, indicated by the block in Fig. 6(c). Figure 8(b) shows the misorientation map of Fig. 8(a). In the EBSD map, high angle grain boundaries (>15 misorienta-tion between adjacent pixels) are depicted as red lines, while low angle boundaries (<15) as blue lines. As seen in Fig. 8(b), the shear bands in grain #2 produce sharply rotated small areas, whereas the region between these shear bands is deformed homogeneously. On the other hand, grain #1 does not reveal any heterogeneity or orientation splitting on a macroscopic scale even after the deformation to an
equiv-alent plastic strain of 1.65. This is different from Korbel and Martin’s theory15) that shear bands generate large stress concentrations at their tips which may eventually enable them to penetrate a neighboring grain.
The misorientation distributions within grains #1 and #2 determined from the EBSD maps are shown in Fig. 9. The
500 µm
x y
x
y
Fig. 4 Optical micrograph showing microstructure of cross-section after 50% deformation at 1023 K and strain rate of 1/s.
0.0 0.5 1.0 1.5 2.0 2.5 3.0
0.0 0.2 0.4 0.6 0.8 1.0 1.2 1.4 1.6 1.8 2.0 2.2 2.4
Equiv
alent plastic str
ain
Measured strain Calculated strain
Distance from specimen center d / mm
Fig. 5 Distribution of equivalent plastic strain along the compression axis after 50% deformation at 1023 K and strain rate of 1/s.
(a)
(b)
(c)
[image:3.595.58.279.74.598.2] [image:3.595.312.539.78.416.2] [image:3.595.326.525.465.664.2]graphs show the relative frequency of misorientations at intervals of 3. Misorientations less than 1.5are omitted due to the orientation noise in EBSD measurements. The fraction of misorientation angle for grain #1 exists only in a low angle
1 1 1 1 1 1 1 1 1 1 1 1 1 11 1 1
1 1 11 1
111111 1 1 1 1 11 2
2 2
2 22 2 2 2 2 2 2 2 2 2 2 2 2 2 2 2 2 22
222 2 2 2 22 2
2 2 22 2
2 2 2 2 2 2 2 2 2 2 2 22 2 2
2 2 2 2 2 2 2 9 3 33
3 33 3 3 3 3 33
3 3 3 4 4 4 4 4 4 444
4 5 5 5 55
5 5 5 5 5 9 9 9 9 9 9 9 9 9 9 9 9 9 9 9 9 9 9 9 9
9 9 999 9 9 9 9 9 9 9 9 9 9 9 9 9 9 9 9 9 9 9 9 99
6 6666 6 6 6 6 6 6
77 7 7 7777 7 7 7 7
8
8 8 8 8 8 8 8 8 8 8 8 8 8 8 8 8 8
8 8 8 8 8 8 8
1 1 1 1 1 1 1 1 1 1 1 1 1 1 111 1 1 1 1 1 1 1 1 1 1 1 1 1 1 1 1 1 1 1 1 1 1 1 1 1 1 1 1 1 1 1 1 1 1 1 1 1 1 1 1 1 1 1 1 1 1 1 1 1 1 1 1 1 1 1 1 1 1 11 1 1 1 1 1 1 1 1 1 1 1 1 1 1 1 1 1 1
1 1 1
1 1 1 1 1 1 1 11 1 2 2 2 2 2 2 2 2 2 2 2 2 2 2 2 2 2 2 2 2 2 2 2 2 2 2 2 2 2 22 2 2 2 2 2 2 2
2 2 2 2 22 2
2 2 2 2 2 2 2 22 2 22 2 2 22 2 2 2
2 2 2 2 22 2 22 2 2
222 2 2 2 2 2 2
2 2 2 2 22 2
22 22
22222 2 2 22222 2 2 2 2 3 3 3 3 3
3 3 3 3 3 3 3 3 3 3 3 3 3 3 3 3 3 3 3
3 333333 3 3 3 3 3 3 4 4 4 4 4 4 4 4 4 4 4 4 4 4 4 4 4 5 5 5 5 5 5 5 5 5 5 5 5 5 5 5 5 5 5 5 9 9 9 9 9 9 9 9 9 9 9 99
9 9 9 9 9 9 9 9 9 9 9
9 9 9 9 9 9 9 9
9 9999 9 9 9 9999999999 9 9
9 9 9 9 9 9 9 9 9 9 9 9 9 9 9 9 666 6 6 6 6
6 6 6 6
7 7 7 7 7 7 7 7 7 7 7 7 7
8 88 8
8 8 88 8
8 8 8 8
8 8 8 8 8
8 8 8 8 8 8 8 88 8 8 8 8 8 8 87 8 7 6
(d)
300 µm
9
10
11
5 4
1
3
2
6 78
12
300 µm
(c)
LD CD9
10
11
12
Fig. 6 Optical micrographs showing microstructures of identical area (a) before and (c) after 50% deformation at 1023 K and strain rate of 1/s. (b) and (d) are schematic illustrations of (a) and (c), respectively. Microstructure within white frame corresponds to Fig. 8.
20 µm
#1
#2
Fig. 7 SEM micrograph showing microstructure of grains #1 and #2 in Fig. 6(c).
LD CD
35 µm = 70 steps
(a)
35 µm
#1
#2 #1
(b)
(1.5°≤θ<5°) (5°≤θ<15°) (15°≤θ)
[image:4.595.123.479.73.499.2] [image:4.595.311.547.544.748.2] [image:4.595.50.289.544.693.2]grain boundary region (<15). On the contrary, the misor-ientation distribution within grain #2 spreads out to a high angle grain boundary region as large as 60.
In general, shear bands have been observed to form as microstructural inhomogeneities at large strains during plastic deformation. It has been observed that shear bands are capable of storing large shear strains in the deformation process and, consequently, producing high local dislocation densities.16,17) These shear bands are thought to serve as favorable nucleation sites upon recrystallization that occurs during subsequent annealing, and thus have a very important effect on microstructural properties such as recrystallized grain size and texture. Macroscopic properties of shear bands seem to be greatly affected by the macroscopically imposed deformation variables that include strain, strain rate, temper-ature, grain size,etc.
In the present experiment, the deformation parameters of each grain are absolutely the same except the initial orientation of grains. Therefore, regarding the formation of shear bands, an important observation in this study is that the presence or absence of shear bands seems to depend on the initial grain orientation, as can be seen in Fig. 8. So we will below seek to make clear the reason for the homogeneous deformation of grains even after deformation of high compression strains.
Figure 10(a) represents the initial orientations of 14 grains as {100} pole figure, showing shear bands after deformation. On the other hand Fig. 10(b) presents the initial orientations of 13 grains that show no heterogeneities such as shear bands even after deformation to equivalent plastic strains of 1.65– 1.9 at 1023 K and a strain rate of 1/s. The pole figure was determined from the average value of the Euler angles of each grain before deformation processing. As seen in Fig. 10(a), in case of the initial orientations of grains with shear bands, it seems that the nearf110gh111iorientation exists as a main component. To the contrary, in case of the initial orientations of grains showing no shear bands after deforma-tion, most of the initial orientations are clustered around
f110gh001i orientation (Goss orientation) with a maximum deviation angle of 27.5fromf110gh001i.
In general, a deformed single crystal is divided into being either stable or unstable.18)The Goss (011)[100] and Brass
ð011Þ½2111orientations are examples of stable orientations. Their deformation orientations do not spread from the starting orientations even after high strains. On the other hand, the Cube (001)[100] and ND rotated Cube (001)[110] orientations comprise unstable orientations. These orienta-tions are known to develop shear bands that lead to a large scattering from the starting orientation.
In a crystal with the (011)[100] initial orientation, the active slip systems are ð111Þ½1011, ð111Þ½1110, ð1111Þ½101 andð1111Þ½110.19)The coplanar slip of equal magnitude on each of the four slip systems is expected, which produces self-compensating orientation changes. Such a deformation mode is known to lead to a uniform dislocation micro-structure without heterogeneities such as shear bands. Ferry and Humphreys20)showed that single phase crystals of Al-0.05%Si of f110gh001i, deformed in plane strain compres-sion, are stable up to true strains of 3.0.
Considering that the division of grains into stable or unstable orientations refers essentially to the room-temper-ature behavior, the stability of grains may be affected by deformation temperature. Actually, Maurice et al.21) inves-tigated the influence of deformation temperature on the stability of the Cube (001)[100] orientation of Al and Al-1%Mn crystals at 473–673 K. They showed that the behavior of the cube orientation is dependent on temperature and strain rate. That is, atT <573K the decomposition into bands of octahedral slip occurs to lead the cube-oriented crystal unstable whereas at higher temperature the cube orientation is deformed by double slip on f110gh1110i systems and is stable up to high strain of 1.5. As a result, in case of the Goss (011)[100] orientation that is more stable than the Cube orientation at room temperature, it is very presumable in this study that the homogeneous deformation can be expected at high temperature in grains with a little deviation angle from the ideal Goss orientation.
4. Conclusion
The effect of grain orientation on deformed microstructure in the Ni-30Fe alloy after hot deformation to equivalent 0.87
0.00 0.05 0.10 0.15 0.20 0.25 0.30 0.35 0.40
F
raction
grain #1 grain #2
10° 20° 30° 40° 50° 60°
0°
Misorientation angle
Fig. 9 Misorientation distributions within grains #1 and #2.
{110}<001> LD
(a) (b)
CD
LD
[image:5.595.71.272.70.286.2]CD
[image:5.595.302.550.74.199.2](1) The presence or absence of shear bands depended on the initial orientations of grains.
(2) Some grains did not reveal any heterogeneity or orientation splitting on a macroscopic scale even after deformation to an equivalent plastic strain of 1.9.
(3) Most of the initial orientations of grains which showed no shear band after deformation were clustered around the Goss f110gh001i orientation with a maximum deviation angle of 27.5fromf110gh001i.
(4) The homogeneous deformation could be expected at high temperature in grains with a little deviation angle from the ideal Goss orientation.
Acknowledgements
The authors would like to thank Ms. Sakurai, NIMS, for her help with EBSD experiment. One of the authors (J.Y.C) was supported by the Post-doctoral Fellowship Program of KOREA SCIENCE & Engineering Foundation (KOSEF) and wishes to express sincere gratitude to the Steel Research Center, NIMS.
REFERENCES
1) C. M. Li, H. Yada and H. Yamagata: ISIJ Int.39(1999) 209–211.
Hodgson: Metall. Mater. Trans.33A(2002) 1019–1026.
4) R. Z. Valiev, A. V. Korznikov and R. R. Mulyukov: Mater. Sci. Eng. A168(1993) 141–148.
5) D. H. Shin, B. C. Kim, K.-T. Park and W. Y. Choo: Acta Mater.48 (2000) 3245–3252.
6) Y. Saito, N. Tsuji, H. Utsunomiya and T. Sakai: Acta Mater.47(1999) 579–583.
7) A. Belyakov, T. Sakai, H. Miura and R. Kaibyshev: ISIJ Int.39(1999) 592–599.
8) W. Chranock and J. Nutting: Met. Sci. J.1(1967) 123–127. 9) P. J. Hurley, B. C. Muddle, P. D. Hodgson, C. H. J. Davies, B. P.
Wynne, P. Cizek and M. R. Hickson: Mater. Sci. Forum284–286 (1998) 159–166.
10) Y. Adachi: CAMP-ISIJ12(1999) 1123.
11) D. W. Suh, S. Torizuka, A. Ohmori, T. Inoue and K. Nagai: ISIJ Int.42 (2002) 432–439.
12) N. Hansen: Metall. Mater. Trans.32A(2001) 2917–2935.
13) P. J. Hurley, B. C. Muddle and P. D. Hodgson: Metall. Mater. Trans. 32A(2001) 1507–1517.
14) T. Inoue, S. Torizuka, K. Nagai, K. Tsuzaki and T. Ohashi: Meter. Sci. Tech.17(2001) 1580–1588.
15) A. Korbel and P. Martin: Acta Mater.34(1986) 1905–1909. 16) A. A. Ridha and W. B. Hutchinson: Acta Mater.30(1982) 1929–1939. 17) A. Duckham, R. D. Knutsen and O. Engler: Acta Mater.49(2001)
2739–2749.
18) A. Mecif, B. Bacroix and P. Franciois: Acta Mater.45(1997) 371–381. 19) J. Hirsch and K. Lu¨cke: Acta Mater.36(1988) 2883–2904.