Differences in soil sulfur fractions due to limitation
of atmospheric deposition
J. Balík
1, M. Kulhánek
1, J. Černý
1, J. Száková
1, D. Pavlíková
1, P. Čermák
21
Faculty of Agrobiology, Food and Natural Resources, Czech University of Life Sciences
in Prague, Prague, Czech Republic
2
Central Institute for Supervising and Testing in Agriculture, Brno, Czech Republic
ABStrAct
The aim of this work was to estimate the changes in contents of different sulfur (S) fractions in soils under con-ditions of lowering inputs of S from emissions together with the influence of application of manure and mineral fertilizers. Soil samples from long-term field experiments were used for this purpose. The samples were taken from 10 sites from precise long-term field experiments with different soil-climatic conditions in the Czech republic. The samples were analyzed using the following fractionation: (i) water soluble S (H2o extracts), (ii) sorbed S (0.032M naH2Po4 extracts) and (iii) S occluded with carbonates (1M HCl extract). Furthermore, the concentration of total S (Stot) and organic S (Sorg) was determined. Soil samples were taken in the years 1981 and 2007. During 26 years a decrease of Stot by about 3–8%, water soluble S by 65–68% and sorbed S by 39–44% were observed in the topsoil of the evaluated soils. Furthermore, a low increase in the content of organic S was observed. The estimated ratio of Sorg reached 78.7–80.9% from Stot in the year 1981 and 87.7–89.8% in 2007. Farmyard manure (40 t/ha) applied every 4 years did not have a significant influence on S fractions and Stot contents in soils; intensive S fertilizing in-creased Stot and mobile S forms contents in soils. very close correlations were obtained especially between Stot and water soluble S and organic S.
Keywords: soil; S; long term stationary experiments; S-fractionation; fertilizing
Sulfur deficiency in plant nutrition is an actual problem in the Czech republic (Matula 1999, Matula and Pechová 2005, vaněk et al. 2008) and in other European states (Scherer 2001, Zhao et al. 2003, Yang et al. 2007, lehmann et al. 2008). agricultural and horticultural crops are more susceptible to sulfur deficiency. Sulfur deficiency can be attributed to the decrease of atmospheric emissions, less intensive application of mineral fertilizers together with change of their composi-tion, restriction of manure and cropping of plants with high S uptake in crop rotation (e.g. rape) on bigger areas.
the total content of S in soil usually ranges be-tween 0.01 and 0.1% (Stevenson and Cole 1999, Balík et al. 2007, Morche 2008). the main portion of total S in soils is bound in soil organic matter
(Eriksen et al. 1998, Kertesz and Mirleau 2004, Yang et al. 2007).
Plant available S consists of: (i) soluble inorganic So42–, (ii) sorbed inorganic So
42–, (iii) the portion
of organic S in soil that is mobilized during veg-etation periods.
although it is possible to estimate the content of inorganic fractions using different extractants, a satisfactory method for estimating mobile organic S is currently not known. For the quantification of inorganic fraction the following extractants are used: H2o, CaCl2, Ca(H2Po4)2, naH2Po4, KH2Po4, naHSo3 (Zhao and McGrath 1994, Matula 1999, Hu et al. 2005, lehmann et al. 2008). the So42– ions
in soil solution and weakly sorbed So42– are esti-mated using water extracts (Prietzel et al. 2001). the P-containing extractants are used to release
water soluble forms and sorbed S. the extractants on the Cl– basis mobilize water soluble So
4 2– (Hu
et al. 2005). the CaCl2 solution has a lower ex-traction power because of the formation of lowly soluble CaSo4 (Matula 1999); therefore, the water extraction is more suitable. the number of stud-ies for estimating mobile fractions in soils has increased after the restriction of S emissions. the results of lehmann et al. (2008) showed that during 150 years on the rothamsted (UK) site, the content of different S fractions varied according to S emissions.
the aim of our experiment was to estimate the changes in different S fractions in soils that were influenced by lowering S inputs from emissions. Furthermore, the influence of manure and mineral fertilization was assessed.
MAteriAl AnD MethoDS
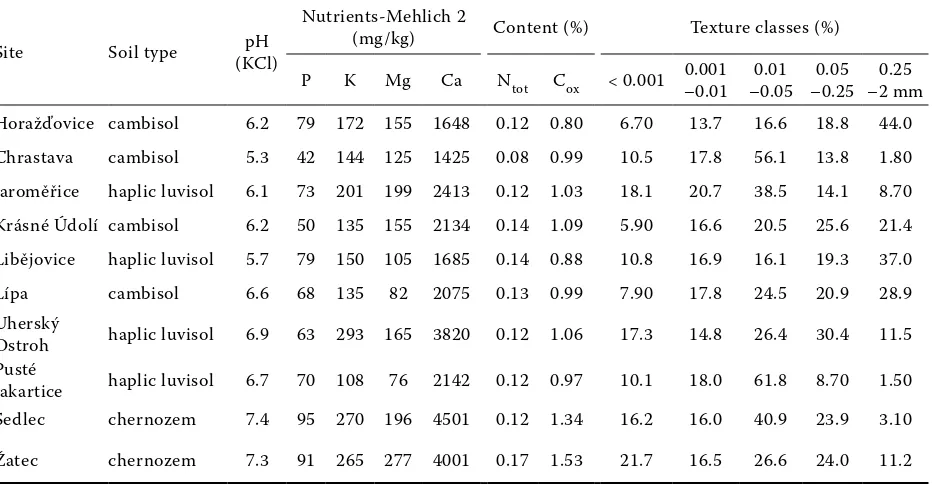
topsoil (0–30 cm) samples from stationary long-term field experiments were used for the experiment. the experimental sites are owned by the Central institute for Supervising and testing in agriculture (CiSta) Brno, Czech republic. Samples from the years 1981 and 2007 were chosen. the stationary experiments on 10 sites with differ-ent soil-climatic conditions in the Czech republic were established in the years 1966–1977. Basic agrochemical characteristics of the soil samples before establishing the experiments are presented
in table 1. Periodic crop rotation was used during the experiments (table 2).
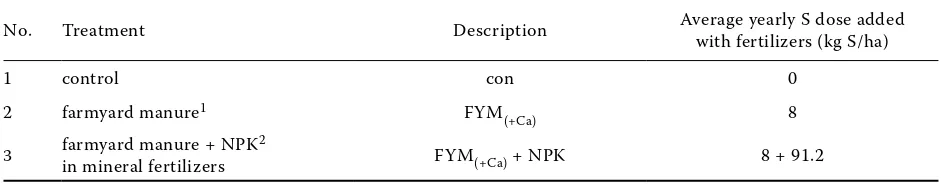
three fertilization treatments were chosen: (i) control – not fertilized, (ii) farmyard manure, (iii) farmyard manure + mineral nPK fertiliz-ing (table 3). Each treatment was conducted in 6 replicates and then mixed together to get one representative soil sample from each treatment. the samples were always taken after the harvest of winter wheat in the years 1981 and 2007.
Fine soil was used for the analysis (< 2 mm). the samples were extracted using the following S-fractionation (Morche 2008): the soil sample was first extracted with demineralized water at 1:10 (w/v). after 30 min of shaking, each sample was centrifuged at 10 000 rpm for the duration of 10 min. Following the centrifugation, the samples were extracted with 0.032M naH2Po4 at the 1:10 (w/v) ratio. after 30 min of shaking, each sample was again centrifuged at 10 000 rpm for the du-ration of 10 min. the rest of the soil sample was extracted with 1M HCl. the extraction ratio was 1:20 (w/v). after 60 min of shaking, the samples were centrifuged 10 min at 10 000 rpm.
total concentrations of S in soils were determined in the digests obtained by the following decompo-sition procedure: aliquots (0.5 g) of air-dried soil samples were decomposed in a digestion vessel with a mixture of 8 ml of concentrated nitric acid, 5 ml of hydrochloric acid, and 2 ml of concentrated hydrofluoric acid. the mixture was heated in the Ethos 1 (MlS GmbH, Germany)
microwave-as-table 1. agrochemical characteristics of the soils in the year of the experiments establishment
Site Soil type (KCl)pH
nutrients-Mehlich 2
(mg/kg) Content (%) texture classes (%)
P K Mg Ca ntot Cox < 0.001 0.001 –0.01 –0.050.01 –0.250.05 –2 mm0.25
Horažďovice cambisol 6.2 79 172 155 1648 0.12 0.80 6.70 13.7 16.6 18.8 44.0 Chrastava cambisol 5.3 42 144 125 1425 0.08 0.99 10.5 17.8 56.1 13.8 1.80 Jaroměřice haplic luvisol 6.1 73 201 199 2413 0.12 1.03 18.1 20.7 38.5 14.1 8.70 Krásné Údolí cambisol 6.2 50 135 155 2134 0.14 1.09 5.90 16.6 20.5 25.6 21.4 libějovice haplic luvisol 5.7 79 150 105 1685 0.14 0.88 10.8 16.9 16.1 19.3 37.0
lípa cambisol 6.6 68 135 82 2075 0.13 0.99 7.90 17.8 24.5 20.9 28.9
Uherský
ostroh haplic luvisol 6.9 63 293 165 3820 0.12 1.06 17.3 14.8 26.4 30.4 11.5 Pusté
Jakartice haplic luvisol 6.7 70 108 76 2142 0.12 0.97 10.1 18.0 61.8 8.70 1.50 Sedlec chernozem 7.4 95 270 196 4501 0.12 1.34 16.2 16.0 40.9 23.9 3.10
[image:2.595.67.533.515.757.2]sisted wet digestion system for 33 min at 210°C. after cooling, the digest was quantitatively trans-ferred into a 50 ml teflon® vessel and evaporated to dryness at 160°C. the digest was then dissolved in a 3 ml nitric and hydrochloric acid mixture (1:3), transferred into a 25 ml glass tube, filled up with deionized water, and kept at laboratory temperature until measurement. the certified reference material rM 7003 loam was applied for the quality assurance of analytical data.
the concentrations of S in soil digests and extracts were determined using optical emission spectros-copy with inductively coupled plasma (iCP-oES) with axial plasma configuration, varian, vistaPro, equipped with autosampler SPS-5 (australia). operating measurement wavelength for iCP-oES was 180.7 nm for S. Measurement conditions were: power 1.2 kW, plasma flow 15.0 l/min, auxillary flow 0.75 l/min, nebulizer flow 0.9 l/min.
reSultS AnD DiScuSSion
the Czech republic was known as an important S emitting country from the 1950s to the begin-ning of the 1990s. For example in the year 1991, the emissions in Prague region reached 394 kg S/ha, in the north Bohemian region 484 kg S/ha and in the rest of the Czech republic they reached almost 100 kg S/ha (tlustoš et al. 2001). new tech-nologies of thermal power plant desulfurization significantly decreased So2 emissions. therefore, dry + wet deposition is currently approximately 15–30 kg S/ha. it is possible to deduce that this change could significantly influence the total con-tent of S in soils and its different fractions (Zhao et al. 2003).
table 1 summarizes the agrochemical character-istics of the soils from different sites at the begin-ning of the long-term field experiments. ten of the chosen sites represent well different soil-climatic conditions in the Czech republic. these soils are usually loamy and the pH ranges between acidic and neutral values. in these long-term experiments stabile crop rotation was performed (table 2). in this study, 3 treatments were chosen. the control treatment was not fertilized. Quality farmyard ma-nure was periodically applied to treatments 2 and 3. Based on manure analysis in the last 10 years, it is possible to deduce that S input is approximately 8 kg/ha year (table 3), which also corresponds to the results of Eriksen et al. (1998). ammonium sulfate and simple superphosphate application before sowing to treatment 3 added high amounts of mineral S (99.2 kg S/ha year).
[image:3.595.63.292.77.232.2]the plant material was not archived in the pre-vious years of experiment. it is thus problematic to estimate S export through harvest. Zhao et al.
table 2. Crop rotations on the different sites
Year 1 2
1 oat – alfalfa oat – clover
2 alfalfa clover
3 winter wheat winter wheat
4 silage maize potatoes
5 winter wheat winter wheat
6 spring barley spring barley
7 sugar beet potatoes
8 spring barley spring barley
1 – Uherský ostroh, Pusté Jakartice, Sedlec, Žatec; 2 – Horažďovice, Chrastava, Jaroměřice, Krásné Údolí, libějovice, lípa
table 3. Design of the experiment
no. treatment Description average yearly S dose added with fertilizers (kg S/ha)
1 control con 0
2 farmyard manure1 FYM
(+Ca) 8
3 farmyard manure + nPKin mineral fertilizers 2 FYM(+Ca) + nPK 8 + 91.2
1 40 t farmyard manure/ha is periodically applied to the root crops (potatoes, sugar beet) in the crop rotation.
the average farmyard manure dose is 10 t/ha year
2 the amount of farmyard manure is same with the treatment 2. the average yearly dose of nutrients is: 69 kg
[image:3.595.62.535.575.667.2](2003) estimated that S ratio originating from the atmosphere accounted for 60–78% of total S up-take with harvest of winter wheat during maximal atmospheric deposition (year 1970). therefore, we can assume that in our experiments this factor dominated between 1970 and 1995. From the ex-actly registered harvest results, from the different sites and average S uptakes from the literature, the yearly uptake of S was estimated to 13.1 kg S/ha at the control treatment, 14.0 kg S/ha at the FYM(+Ca) treatment and 22.0 kg S/ha at the FYM(+Ca) + nPK treatment. Higher contents (approximately by 1/3) of S due to intensive fertilization with mineral S form were calculated at the treatment 3.
tables 4 and 5 summarize S contents using the fractionation of the soil samples from the years 1981 and 2007. the contents of plant available S (SH2o), exchangeable sorbed S (SnaH2Po4) and occluded S (SHCl) were estimated after Morche (2008). the content of organic S (Sorg) was calculated as a dif-ference between total S (Stot) and sum of mineral S (S*). a decrease of total S content in soils was
observed in time. average contents observed at the control treatment were 221 mg S/kg in the year 1981 and 204 mg S/kg in 2007. Similar decreasing trends were observed at the treatment 2 (from 216 mg S/kg to 210 mg S/kg) and 3 (from 235 mg S/kg to 219 mg S/kg). the contents of Stot ranged in dependence on the site and treatment between 133 and 334 mg S/kg in 1981 and between 105 and 321 mg S/kg in 2007. these soils follow similar Stot trends as most European soils. Similar results in other European experiments were published also by Zhao et al. (2003), lehmann et al. (2008) or Morche (2008).
the content of SH2o reached 22.6 mg S/kg at the control treatment in 1981 and was only about 7.20 mg S/kg in 2007, which represents only a frac-tion of 32% (Figure 1). Similar trends were obtained at the treatments 2 and 3 where it accounted for 33% and 35%, respectively. the measured results varied on the majority of sites (except Žatec) be-tween 4–9 mg S/kg. this corresponds with the results of Balík et al. (2006) in other soil-climatic
0 20 40 60 80 100 120 140
SH2O SNa2PO4 SHCl
(%)
year 1981 = 100 %
Con FYM (Ca) FYM(Ca) + NPK
s d
0 20 40 60 80 100 120 140
ΣS* Sorg Stot
(%)
ΣS*=SH2O+SNaH2PO4+SHCl
year 1981 = 100 %
[image:4.595.126.441.360.723.2]Con FYM(Ca) FYM(Ca)+NPK
Figure 1. the average ratio (in %) of different S fractions in soils in the samples of the year 1981 compared to 2007
∑S* = Sh2o + Snah2Po4 + Shcl
Sh2o Snah2Po4 Shcl
∑S* Sorg Stot
year 1981 = 100%
conditions in the Czech republic and it confirms the need for S application through mineral fertiliz-ers for sulfur-intensive crops. it is also necessary to mention that S analyses using iCP-oES estimate
[image:5.595.63.531.78.680.2]total extractable S and the ratio of total S with mineral S ranges between 50 and 90% (Kotková et al. 2008). the content of exchangeable sorbed S also decreased through the 26 years of experiment
table 4. the content of different S fractions, year 1981
Site treatment SH2o SnaH2Po4 SHCl S* Sorg Stot
(mg S/kg)
Horažďovice Con 14.4 6.10 12.4 32.9 187 219
FYM(+Ca) 15.6 7.10 15.2 37.9 170 208
FYM(+Ca) + nPK 21.5 6.70 18.2 46.4 162 208
Chrastava Con 41.2 16.0 21.7 79.3 244 323
FYM(+Ca) 35.7 13.0 19.5 68.5 229 297
FYM(+Ca) + nPK 40.1 15.0 23.7 79.0 239 318
Jaroměřice Con 18.9 7.50 8.27 34.7 228 262
FYM(+Ca) 19.3 7.40 9.13 35.8 172 207
FYM(+Ca) + nPK 31.4 8.50 10.9 50.7 211 262
Krásné Údolí Con 29.8 11.0 16.9 57.4 227 284
FYM(+Ca) 22.2 9.00 16.1 47.3 231 279
FYM(+Ca) + nPK 25.5 9.00 25.1 59.6 215 274
libějovice Con 21.3 5.60 10.6 37.4 171 209
FYM(+Ca) 20.5 5.60 10.5 36.5 187 223
FYM(+Ca) + nPK 24.9 6.60 13.9 45.5 175 221
lípa Con 18.3 9.40 11.4 39.1 147 186
FYM(+Ca) 19.1 8.70 10.8 38.6 120 159
FYM(+Ca) + nPK 18.3 8.30 11.6 38.2 108 146
ostroh Con 14.1 5.40 10.7 30.2 134 164
FYM(+Ca) 15.4 5.80 8.90 30.0 124 154
FYM(+Ca) + nPK 21.3 6.30 8.80 36.4 134 170
Pusté Jakartice Con 19.2 6.40 8.40 33.9 99.2 133
FYM(+Ca) 16.7 5.80 7.30 29.8 104 133
FYM(+Ca) + nPK 20.1 7.30 7.00 34.4 149 183
Sedlec Con 24.0 8.30 14.7 47.1 187 234
FYM(+Ca) 22.2 9.00 11.2 42.4 168 210
FYM(+Ca) + nPK 32.2 9.70 10.7 52.6 181 234
Žatec Con 24.6 9.60 9.20 43.4 149 192
FYM(+Ca) 27.5 9.20 10.3 47.0 245 292
FYM(+Ca) + nPK 38.5 9.00 11.1 58.6 275 334
average of the sites
Con 22.6 8.50 12.4 43.5 177 221
FYM(+Ca) 21.4 8.10 11.9 41.4 175 216
FYM(+Ca) + nPK 27.4 8.70 14.1 50.1 185 235
duration. Contents in the year 2007 decreased to 61% at the treatment 3 (Figure 1). From the results of Prietzel et al. (2001) it is clear that the So42– sorption intensity strongly depends on soil
pH value and increases with increasing acidity. this was not verified in our experiments. With liming, the oH– ion displaces the So
42– from the
[image:6.595.62.536.82.690.2]sorption sites on the Fe and al oxides and the
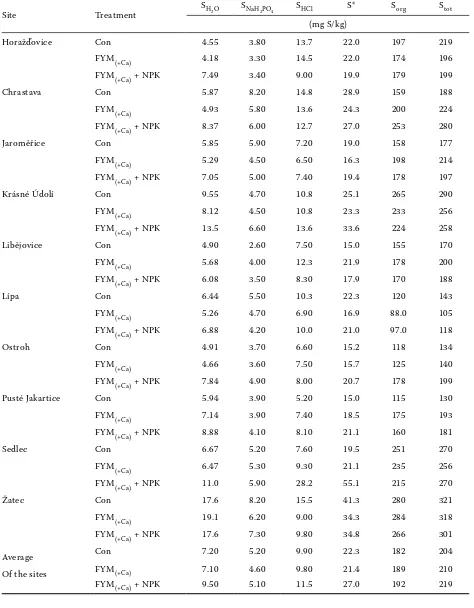
table 5. the content of different S fractions, year 2007
Site treatment SH2o SnaH2Po4 SHCl S* Sorg Stot
(mg S/kg)
Horažďovice Con 4.55 3.80 13.7 22.0 197 219
FYM(+Ca) 4.18 3.30 14.5 22.0 174 196
FYM(+Ca) + nPK 7.49 3.40 9.00 19.9 179 199
Chrastava Con 5.87 8.20 14.8 28.9 159 188
FYM(+Ca) 4.93 5.80 13.6 24.3 200 224
FYM(+Ca) + nPK 8.37 6.00 12.7 27.0 253 280
Jaroměřice Con 5.85 5.90 7.20 19.0 158 177
FYM(+Ca) 5.29 4.50 6.50 16.3 198 214
FYM(+Ca) + nPK 7.05 5.00 7.40 19.4 178 197
Krásné Údolí Con 9.55 4.70 10.8 25.1 265 290
FYM(+Ca) 8.12 4.50 10.8 23.3 233 256
FYM(+Ca) + nPK 13.5 6.60 13.6 33.6 224 258
libějovice Con 4.90 2.60 7.50 15.0 155 170
FYM(+Ca) 5.68 4.00 12.3 21.9 178 200
FYM(+Ca) + nPK 6.08 3.50 8.30 17.9 170 188
lípa Con 6.44 5.50 10.3 22.3 120 143
FYM(+Ca) 5.26 4.70 6.90 16.9 88.0 105
FYM(+Ca) + nPK 6.88 4.20 10.0 21.0 97.0 118
ostroh Con 4.91 3.70 6.60 15.2 118 134
FYM(+Ca) 4.66 3.60 7.50 15.7 125 140
FYM(+Ca) + nPK 7.84 4.90 8.00 20.7 178 199
Pusté Jakartice Con 5.94 3.90 5.20 15.0 115 130
FYM(+Ca) 7.14 3.90 7.40 18.5 175 193
FYM(+Ca) + nPK 8.88 4.10 8.10 21.1 160 181
Sedlec Con 6.67 5.20 7.60 19.5 251 270
FYM(+Ca) 6.47 5.30 9.30 21.1 235 256
FYM(+Ca) + nPK 11.0 5.90 28.2 55.1 215 270
Žatec Con 17.6 8.20 15.5 41.3 280 321
FYM(+Ca) 19.1 6.20 9.00 34.3 284 318
FYM(+Ca) + nPK 17.6 7.30 9.80 34.8 266 301
average Con 7.20 5.20 9.90 22.3 182 204
of the sites FYM(+Ca) 7.10 4.60 9.80 21.4 189 210
FYM(+Ca) + nPK 9.50 5.10 11.5 27.0 192 219
sorption values of sulfates are underestimated (Evans 1986). in our experiment, lower contents at the treatment 2 (limed on some sites) compare to the treatment 1 were calculated, but the differ-ences were not significant. therefore, we can only speculate about some trends without significant relevance. the sorption could as well decrease due to increased sorption of organic anions after farmyard manure application. other works are not uniform in this question. although Haque and Walnsley (1973) estimated a positive correlation between the sorption of So42– and organic matter,
Singh and Johnson (1986) obtained a negative correlation. the results of Kaiser and Zech (1996) show that organic acids anions block the sorption sites on hydrated Fe and al oxides. Furthermore, the increasing concentration of phosphorus anions in soil solution decreases So42– sorption (Bohn
et al. 1986). therefore, application of phospho-rus fertilizers increases the mobility of So42–. We
cannot quantify how these factors influenced our experiments, although at the treatment 3, intensive phosphorus and S fertilization was performed. our measured values correspond well with the results of Scott (1976), who found similar value in australian soils, but are higher than Schnug’s (1988) results from northern Germany.
Using the HCl extraction as a part of the frac-tionation should mobilize a major portion of S occluded with carbonates (Shan et al. 1992, Chen et al. 1997).
From the data presented in tables 4 and 5 it is clear that high S contents on the Sedlec and Žatec sites were not found, which was previously expected (based on the soils characteristics). The values of pH/KCl were 7.3 (Žatec) and 7.4 (Sedlec). Calcium contents (Mehlich 2) were 4001 mg Ca/kg (Žatec) and 4501 mg Ca/kg (Sedlec). on the other hand, on the Chrastava site (acidic soils); the highest SHCl contents were obtained. Therefore, using HCl does not selectively estimate only S occluded with carbon-ates. That confirms the results of Morche (2008); the data on occluded S obtained from this extraction are thus overestimated. From the comparison of the data from 1981 and 2007 a decrease of occluded S is apparent. The values of this fraction in the year 2007 reached only 80–89% from the year 1981.
[image:7.595.62.534.77.249.2]the sum of the fractions SH2o, SnaH2Po4 and SHCl represents the so-called ‘inorganic S’ (Morche 2008). although the use of the extractants is not fully selective, it is possible to assume that most of the extracted S is inorganic S (Shan et al. 1992, Morche 2008). Due to the significant restriction of atmospheric depositions during the last 20 years
table 6. the ratio (in %) of the different S fractions compared to the Stot content in soils
treatment SH
2o SnaH2Po4 SHCl S* Sorg Stot
Year 1981
Con 10.2 3.9 5.6 19.7 80.3 100
FYM(+Ca) 9.90 3.7 5.5 19.2 80.9 100
FYM(+Ca) + nPK 11.7 3.7 6.0 21.3 78.7 100
Year 2007
Con 3.5 2.5 4.9 10.9 89.1 100
FYM(+Ca) 3.4 2.2 4.6 10.2 89.8 100
FYM(+Ca) + nPK 4.3 2.3 5.3 12.3 87.7 100
S* = Σ SH2o + SnaH2Po4 + SHCl
table 7. the values of the correlation coefficients between Stot content and the different S fractions contents in soils (n = 30)
1981 2007
SH
2o SnaH2Po4 SHCl Sorg SH2o SnaH2Po4 SHCl Sorg
Correlations with Stot 0.811 0.685 0.622 0.987 0.720 0.558 0.373 0.993
[image:7.595.62.533.684.756.2]in the Czech republic the ratio of inorganic S de-creased by 50% (Figure 1). intensive S fertilization (treatment 3) led to increased contents of inorganic S in soil (27 mg S/kg) in the year 2007. the ratio of different fractions (in %) from the total S content is mentioned in table 6. Similar to the results of Chapmann (2001), organic S is the major fraction. it accounted for 78.7–80.9% from Stot in the year 1981 and 87.7–89.8% in 2007. the experimentally estimated data in the year 2007 are close to the data presented by Kertesz and Mirleau (2004), who published a ratio of 95%. From the comparison of the results from 1981 and 2007, the content of inorganic S fractions decreased during 26 years. While the ratio ranged between 9.9 and 11.7% in the year 1981, it was only between 3.4 and 4.3% in 2007. the ratio of S occluded with carbonates ranged between 5.5–6.0% in the year 1981 and between 4.6–5.3% in 2007. Similar results (6.9% from total S) were mentioned also by Chen et al. (1997). our results are significantly lower then the values from roberts and Bettany (1985) for calcar-eous soils in Canada. the decreasing content of inorganic S was probably influenced by decreasing inputs and with elutriation losses. the content of Sorg did not change. that corresponds also with a stable Cox content. the average value of Cox was 1.02% at the control treatment in the year 1981 and 1.04% in 2007, at the treatment FYM(+Ca) 1.04% in 1981 and 1.07% in 2007 and at the treatment FYM(+Ca) + nPK the content decreased from 1.15% in 1981 to 1.09% in 2007.
the values of correlation coefficients between different S fractions with Stot are presented in table 7. it is necessary to point out, that the high values were partly influenced by the evaluation of the long-term field experiments, where the closer relation can be expected. For both sets of samples a close relations between SH2o and Stot were found. that indirectly confirms the usefulness of the SH2o extraction for S fertilizing optimization. the close relations between Sorg and Stot were influenced by the procedure of Sorg estimation.
referenceS
Balík J., Pavlíková D., tlustoš P., Černý J., Jakl M. (2007): the fluctuation of copper content in oilseed rape plants (Brassica napus l.) after the application of nitrogen and sulphur fertilizers. Plant, Soil and En-vironment, 53: 143–148.
Balík J., Pavlíková D., tlustoš P., Sýkora K., Černý J. (2006): The fluctuation of molybdenum content in oilseed rape
plants after the application of nitrogen and sulphur fertilizers. Plant, Soil and Environment, 52: 301–307. Bohn H.l., Barrow n.J., rajan S.S.S., Parfitt l. (1986):
reactions of inorganic sulfur in soils. in: tabatabai M.a. (ed.): Sulfur in agriculture. agronomy Monogra-phy 27. aSa, CSSa and iSSSa, Madison, 233–249. Chapmann S.J. (2001): Sulfur forms in open and
af-forested areas of two Scottish peatlands. Water, air, and Soil Pollution, 128: 23–39.
Chen B., Shan X.Q., Shen D.Q., Mou S.F. (1997): nature of the HCl-soluble sulfate in the sequential extrac-tion for sulfur speciaextrac-tion in soils. Fresenius’ Journal of analytical Chemistry, 357: 941–945.
Eriksen J., Murphy M.D., Shung E. (1998): the soil sul-phur. in: Schung E. (ed.): Sulphur in agroecosystems. Kluwer academic Publishers, Dordrecht, 39–73. Evans a. jr. (1986): Effects of dissolved organic carbon
and sulfate on aluminium mobilization in forest soil columns. Soil Science Society of america Journal,
50: 1576–1578.
Haque i., Walmsley D. (1973): adsorption and desorp-tion reversibility in a variety of forest soils. Journal of Environmental Quality, 18: 419–426.
Hu Z.Y., Zhao F.J., McGrath S.P. (2005): Sulphur frac-tionation in calcareous soils and bioavailability to plants. Plant and Soil, 268: 103–109.
lehmann J., Solomon D., Zhao F.J., McGrath S. (2008): atmospheric So2 emissions since the late 1800s change organic sulfur forms in humic substance ex-tracts of soils. Environmental Science and technol-ogy, 42: 3550–3555.
Kaiser K., Zech W. (1996): nitrate, sulfate, and biophos-phate retention in acid forest soils affected by natural dissolved organic carbon. Journal of Environmental Quality, 25: 1325–1331.
Kertesz M.a., Mirleau P. (2004): the role of soil mi-crobes in plant sulphur nutrition. Journal of Experi-mental Botany, 55: 1939–1945.
Kotková B., Balík J., Černý J., Bazalová M. (2008): Crop influence on mobile sulphur content and arylsulpha-tase activity in the plant rhizosphere. Plant, Soil and Environment, 54: 100–107.
Matula J. (1999): Use of multinutrient soil tests for sulphur determination. Communications in Soil Sci-ence and Plant analysis, 30: 1733–1746.
Matula J., Pechová M. (2005): influence of gypsum treatment on extractability of nutrients from soils. Plant, Soil and Environment, 51: 368–375.
Morche l. (2008): S-Flüsse und räumliche veränderungen anorganischer und organischer Schwefelfraktionen im Boden sowie deren an- und abreicherung in der rhizosphäre landwirtschaftlicher Kulturpflanzen unter partiellem Einsatz des radioisotops 35S. [Dissertation.]
Prietzel J., Weick C., Korintenberg J., Seybold G., thumerer t., treml B. (2001): Effects of repeated (nH4)2So4 application on sulfur pool in soil, soil microbial biomass, and ground vegetation of two watersheads in the Black Forest/Germany. Plant and Soil, 230: 287–305.
roberts t.l., Bettany J.r. (1985): the influence of to-pography on the nature and distribution of soil sulfur across a narrow environmental gradient. Canadian Journal of Soil Science, 65: 419–434.
Scherer H.W. (2001): Sulphur in crop production – invited paper. European Journal of agronomy, 14: 81–111.
Schnug B. (1988): Quantitative und qualitative aspekte der Diagnose und therapie der Schwefelversogung von raps (Brassica napus l.) unter besonderer Be-rücksichtigung glucosinolatermer Sorten. [Habili-tationnsschrift.] agrawissenschaftliche Fakultät der Universität Kiel.
Scott n.M. (1976): Sulphate contents and sorption in Scottish soils. Journal of the Science of Food and agriculture, 27: 367–372.
Shan X.Q., Bin C., long-Zhu J., Yan Z., Xiao-Ping H., Shi-Fen M. (1992): Determination of sulfur frac-tions in soils by sequential extraction, inductively coupled plasma-optical emission spectroscopy and ion chromatography. Chemical Speciation and Bio-availability, 4: 97–103.
Corresponding author:
Prof. ing. Jiří Balík, CSc., Česká zemědělská univerzita v Praze, Fakulta agrobiologie, potravinových a přírodních zdrojů, Kamýcká 129, 165 21 Praha 6, Česká republika
phone: +420 224 382 732, e-mail: balik@af.czu.cz
Singh B.r., Johnson D.W. (1986): Sulfate content and adsorption in soils of two forest watersheds in southern norway. Water, air, and Soil Pollution, 31: 847–856.
Stevenson F.J., Cole M.a. (1999): Cycles of Soil – Car-bon, nitrogen, Phosphorus, Sulfur, Micronutrients. John Wiley and Sons inc., new York, 427.
tlustoš P., Pavlíková D., Balík J., Száková J. (2001): Sulphur cycle in the soil and in the environment. in: 7th international Conference reasonable Use of
Fertilizers Focused on Sulphur in Plant Production, Czech University of life Sciences Prague, 20–26. (in Czech)
vaněk v., Balík J., Šilha J., Černý J. (2008): Spatial vari-ability of total soil nitrogen and sulphur content at two conventionally managed fields. Plant, Soil and Environment, 54: 413–419.
Yang Z., Singh B.r., Hansen S., Hu Z., riley H. (2007): aggregate associated sulfur fractions in long-term (> 80 years) fertilized soils. Soil Science Society of america Journal, 70: 163–170.
Zhao F.J., McGrath S.P. (1994): Extractable sulphate and organic sulphur in soils and their availability to plants. Plant and Soil, 164: 243–250.
Zhao F.J., Knights J.S., Hu Z.Y., McGrath S.P. (2003): Stable sulfur isotope ratio indicates long-term changes in sulfur deposition in the Broadbalk experiment since 1845. Journal of Environmental Quality, 32: 33–39.